
1
Vol.:(0123456789)
Scientific Reports | (2021) 11:13518 | https://doi.org/10.1038/s41598-021-91949-y
www.nature.com/scientificreports
Delayed subsidence
of the Dead Sea shore due
to hydro‑meteorological changes
Sibylle Vey1*, D. Al‑Halbouni 1,2, M. Haghshenas Haghighi 3, F. Alshawaf1, J. Vüllers 4,
A. Güntner1,5, G. Dick1, M. Ramatschi1, P. Teatini 6, J. Wickert1,7 & M. Weber 1
Many studies show the sensitivity of our environment to manmade changes, especially the
anthropogenic impact on atmospheric and hydrological processes. The effect on Solid Earth processes
such as subsidence is less straightforward. Subsidence is usually slow and relates to the interplay
of complex hydro‑mechanical processes, thus making relations to atmospheric changes difficult to
observe. In the Dead Sea (DS) region, however, climatic forcing is strong and over‑use of fresh water
is massive. An observation period of 3 years was thus sufficient to link the high evaporation (97 cm/
year) and the subsequent drop of the Dead Sea lake level (− 110 cm/year), with high subsidence rates
of the Earth’s surface (− 15 cm/year). Applying innovative Global Navigation Satellite System (GNSS)
techniques, we are able to resolve this subsidence of the “Solid Earth” even on a monthly basis and
show that it behaves synchronous to atmospheric and hydrological changes with a time lag of two
months. We show that the amplitude and fluctuation period of ground deformation is related to poro‑
elastic hydro‑mechanical soil response to lake level changes. This provides, to our knowledge, a first
direct link between shore subsidence, lake‑level drop and evaporation.
Motivation
The Dead Sea is a hyper-saline terminal lake located in the Dead Sea transform rift system1–3. Today its catch-
ment area provides fresh water for more than 16 million people in Jordan, Israel and the Palestinian territories4.
In recent decades, this region has faced substantial environmental challenges5; water scarcity is one of the most
serious. Since the 1950s, anthropogenic influence led to an unprecedented recession of the Dead Sea4–6. The
lake level has steadily decreased with now more than −110cm/year7, leaving the level in October 2018 at 433m
below mean sea-level (msl).
There are several reasons for the net loss of lake volume in the water balance of the Dead Sea5,8: (1) A high
net evaporation rate of around 1000mm/year (~ 700 × 10e6 m3/year) with large seasonal variations9 of which
the quantification has recently been improved by new eddy covariance measurements10; (2) Extensive use of the
DS brine for Potash production in Israel and Jordan with a net water usage in the order of 250 × 106 m3/year is
estimated to be responsible for 40% of the lake level drop8,11; (3) Large water irrigation projects in the North12,
causing fresh water inflow of the Jordan River to decrease by 90% compared to the natural situation before 1955,
to 60–400 × 10e6 m3/year nowadays11,13,14.
Generally, surface and subsurface water inflow into the Dead Sea are difficult to determine due to complex
geology and spatio-temporal effects8,15–17. Regional-scale 3D hydro(geo)logical modelling in salt-water environ-
ments has shown the most promising results for the Dead Sea aquifer systems18–21. Water inflow into the DS
comprises direct surface runoff from river basins with a volume of 58–66 × 106 m3/year (excluding the Jordan
River), submarine groundwater discharge for the Lower Cretaceous Aquifers of ca. 170 × 10e6 m3/year and pre-
cipitation on the lake surface of ca. 45 × 106 m3/year8,11. These inflows, which additionally tend to decrease due
to climate change21–23 cannot compensate for the high evaporation.
The rapid decline of the DS level leads to both short and medium term climatic changes and natural
hazards5,24,25 that pose a major challenge to local communities26. Changes in precipitation and evaporation
cause major flooding events, desertification and land degradation4,26,27. The retreat of the salt-water to fresh-water
transition zone at the DS shore28 results in an increasing groundwater gradient7,29. Both developments have led
OPEN
1Deutsches GeoForschungsZentrum, GFZ, Telegrafenberg, 14473 Potsdam, Germany. 2GEOMAR - Helmholtz
Centre for Ocean Research, Kiel, Germany. 3Leibniz University Hanover, Hanover, Germany. 4Karlsruhe Institute
of Technology, Karlsruhe, Germany. 5University of Potsdam, Potsdam, Germany. 6University of Padova, Padua,
Italy. 7Technische Universität Berlin, Berlin, Germany. *email: sibylle.vey@gfz-potsdam.de

2
Vol:.(1234567890)
Scientific Reports | (2021) 11:13518 | https://doi.org/10.1038/s41598-021-91949-y
www.nature.com/scientificreports/
to dissolution and erosion processes of the DS sediments, evaporates (salt) and other soluble material on both
sides of the Dead Sea30–32. As a consequence, strong subsidence in the order of mm to cm/month on different
spatial scales7,33–35 and hazardous local sinkhole phenomena occur30,31,36, with disastrous effects on infrastructure,
industry, tourism and agriculture6,37,38.
Determining the link between land subsidence and lake level change is essential for understanding the physi-
cal processes behind. Subsidence estimation at the Dead Sea has been performed locally by close-range photo-
grammetry, interferometric synthetic aperture radar (InSAR) or LiDAR techniques or by reconstruction of the
Dead Sea bathymetry7,33,34,36,39–43. In contrast, regional studies exist that yield contrasting results, interpreted as
lithostatic rebound46.
To shed light on the link between evaporation rate, lake-level decline and ground subsidence we use a recently
acquired and compiled dataset in the framework of the interdisciplinary DESERVE (DEad SEa Research VEnue)
project5. Ground deformation is hereby measured with up-to-date high precision Global Navigation Satellite
System (GNSS) stations. GNSS reflectometry is used for high precision leveling. GNSS is especially suitable for
monitoring high temporal land subsidence variations as expected in natural and man-made (mining) cases e.g.
Refs.45–48. We use this technique to record the temporal subsidence at the western side of the Dead Sea, in differ-
ent distances to the shore line. We compare, in high temporal resolution, evaporation and lake level changes at
the Dead Sea and are able to determine a first direct and interdisciplinary link on a monthly basis between the
Solid Earth, climate and water processes.
Study area and experiment description
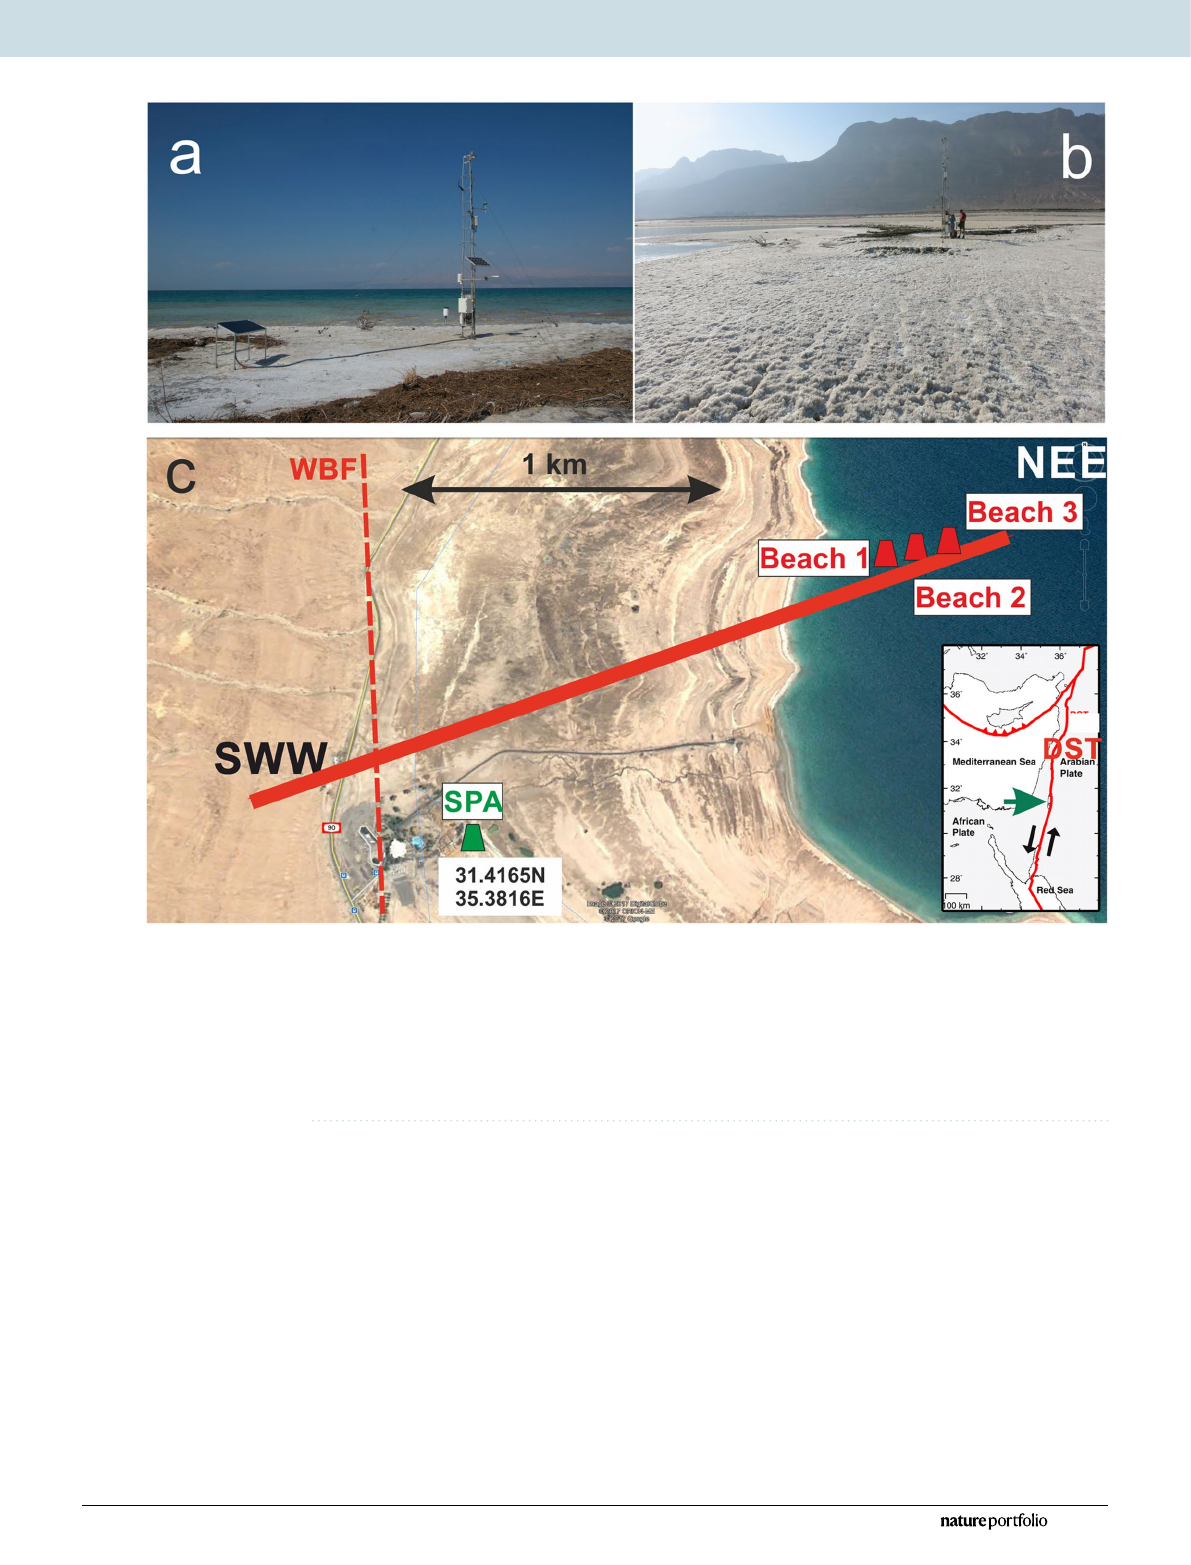
Figure1 shows the tectonic setting of the DS and the location of the Global Navigation Satellite System (GNSS)
stations used. The study area is located on the west coast of the DS near Ein Gedi, Israel, at 31.41° N, 35.39° E.
Meteorological and GNSS data were recorded for nearly 3years from 11th June 2014 until 29th March 2017. The
SPA site had a fixed location next to the spa area of Ein Gedi. As the coastline of the DS retreats about 100m/year
horizontally, the Beach site had to be moved twice towards the waterfront in spring 2015 and 2016, respectively.
The GNSS antennas are mounted about 4m above the ground on towers with meteorological sensors (tipping
bucket rain gauge 52,202 from Young IRGASON; integrated CO2/H2O open-path gas analyzer and 3D sonic
anemometer from Campbell Scientific) installed by the Karlsruhe Institute of Technology (KIT) in the frame-
work of the DESERVE project5. The GNSS equipment consists of an OEM receiver board type Javad TRE_G3T
and an antenna Javad JAV_GRANT-G3T without radome. The ground around the Beach station is a slightly
undulating, massive and rock-hard salt crust of 10–20cm thickness (Fig.1b). Below this stable lid of salt, the soft
clayey sediments are brine-/water-logged. GNSS-reflectometry, a method that uses the GNSS signals reflected
from land, snow and water surfaces is applied to monitor the Dead Sea lake level change49–54. For details on the
data analysis and the construction of 3-year GNSS time series, the reader is referred to the supplement and Sup-
plementary Figs.S_1 and S_2, respectively.
Observations
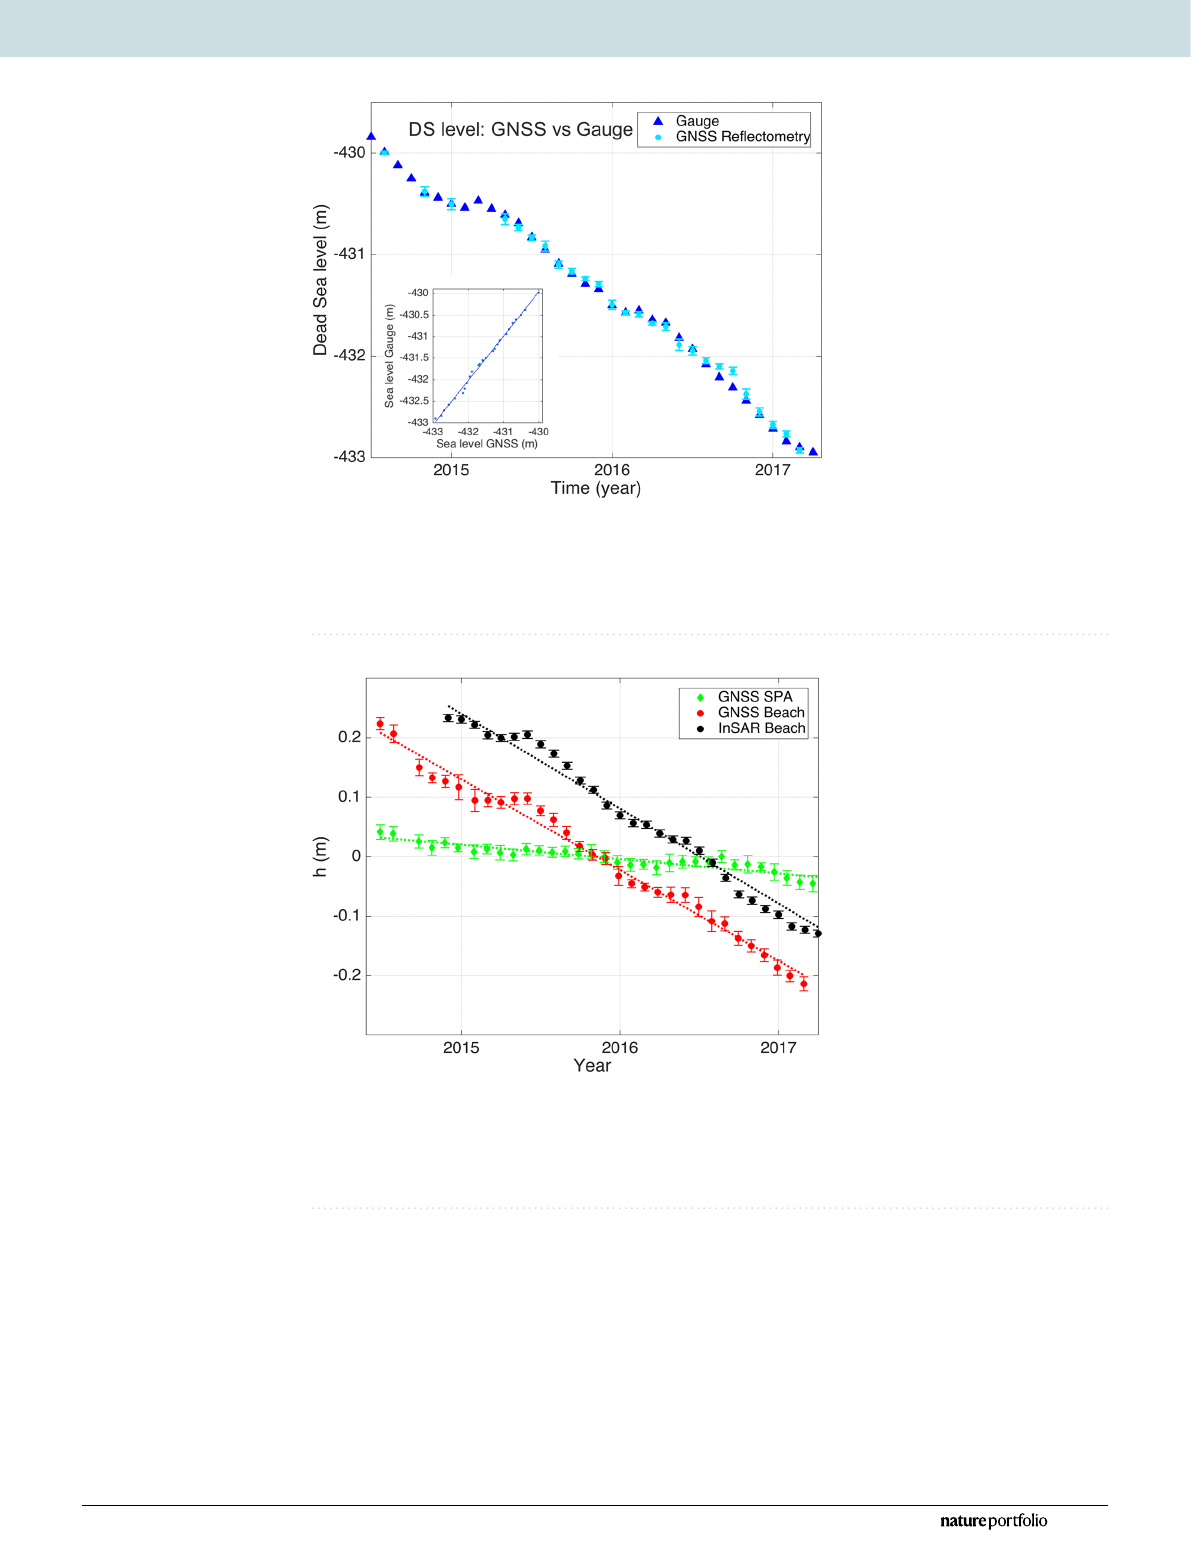
To validate the GNSS reflectometry method, we compare the GNSS derived DS lake level with gauge measure-
ments near Massada (31.32863 N, 35.40299 E) from the Hydrological Service and Water Authority in Israel, for
the 3-year observation period (Fig.2). The mean deviation between the DS lake level from gauge observations and
the lake level derived from GNSS reflectometry is ±2.7cm. The correlation coefficient of 0.99 ± 0.001indicates
an excellent accuracy and robustness of the GNSS method. The linear trend for the 3-year observation period
(2014–2017) of the DS lake is −110 ± 7cm/year.
Figure3 shows the vertical movement of the land surface at the SPA and Beach stations for the whole obser-
vation period. The standard error per month is ± 1.1cm and the average subsidence is −2.4 ± 0.7cm/year and
−15.3 ± 1.2cm/year at the SPA and Beach stations, respectively. The subsidence at the Beach station derived
from InSAR corresponds with −15.9 ± 1.5cm/year very well to the GNSS observations. The spatial distribution
of the subsidence between the Beach and the SPA stations is shown in the supplementary material for InSAR
images (Supplementary Fig.S_4).
Seasonal variation of subsidence
To isolate the seasonal signal of the lake level drop and of beach subsidence from the general trend we remove
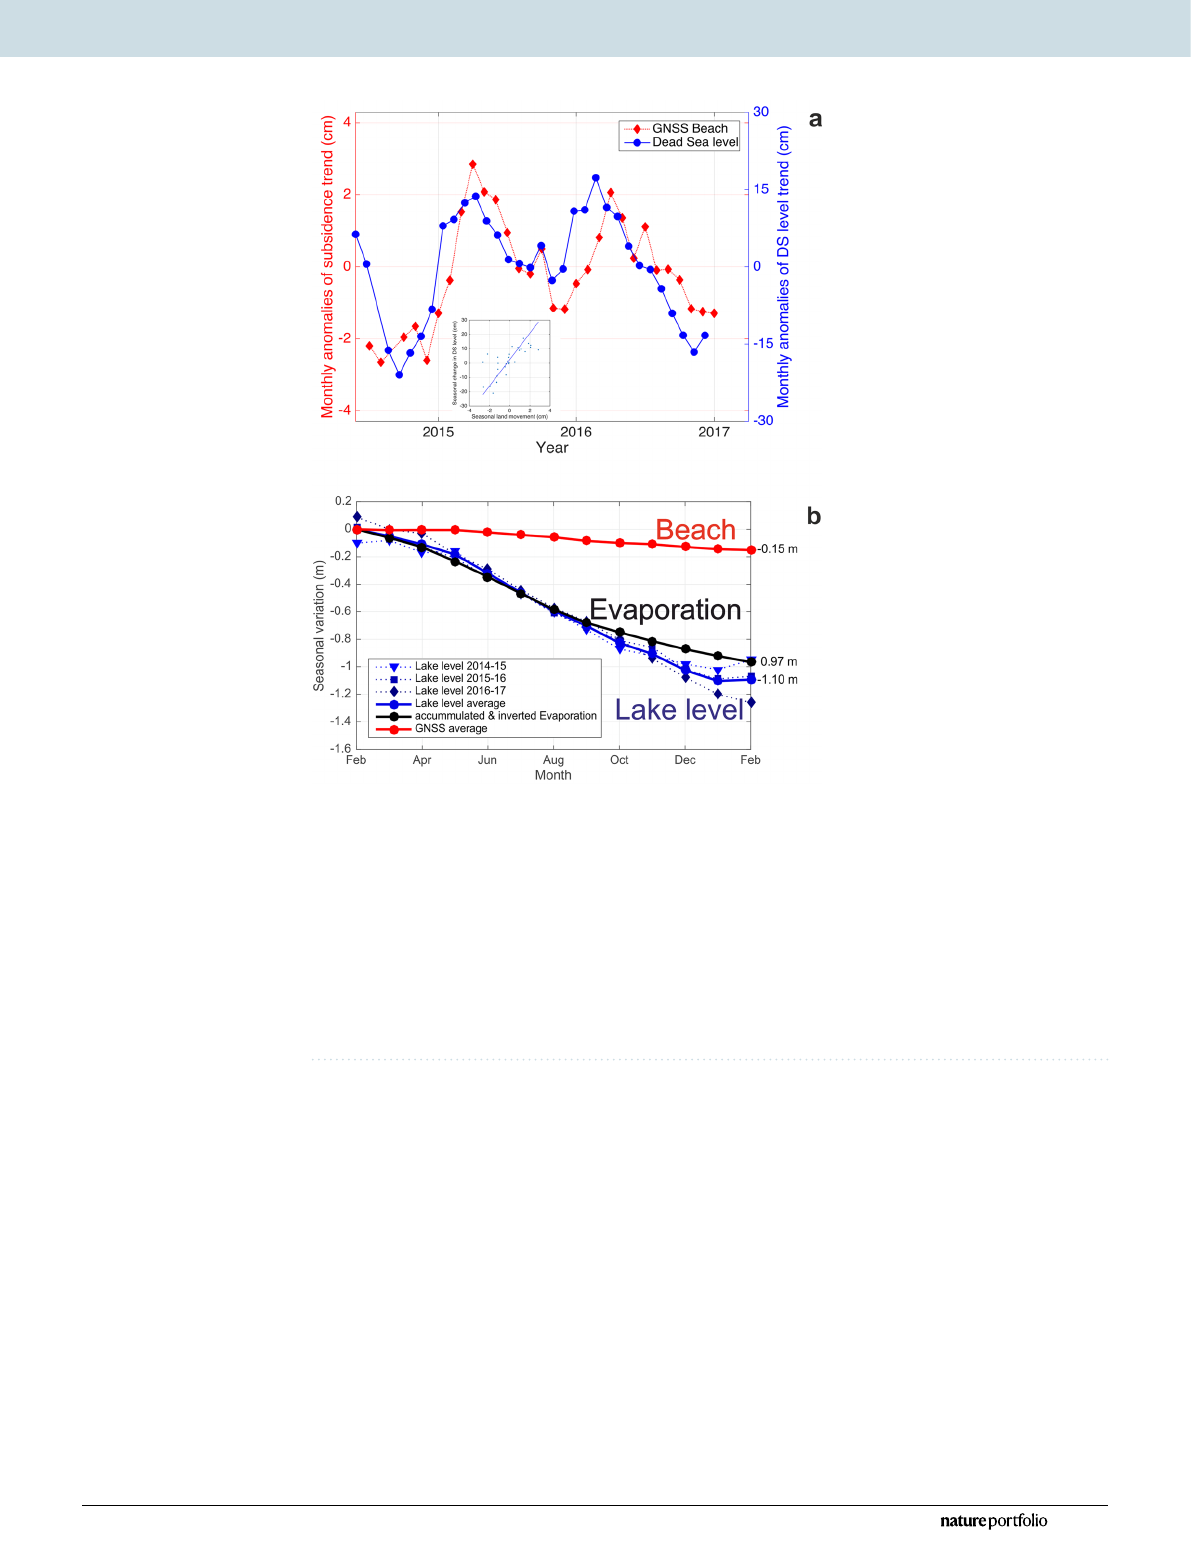
the 3-year trend from the data. The Beach station shows a seasonal signal in the subsidence while the SPA station
does not (Fig.4). Positive anomalies of the overall decreasing DS lake level trend (positive numbers in Fig.4a)
are related to precipitation and less evaporation in the winter months. Anthropogenic water usage also plays
a role and is discussed below. The main subsidence at the Beach site occurs from May to January (given as an
anomaly of −1.3cm/month relative to the long-term subsidence in Fig.4a), whereas it is significantly smaller
from January to May (anomaly of 0.5cm/month). The subsidence at the beach shows the highest correlation
(0.84) with the DS lake level for a delay of two months (see Supplementary Fig.S_3), see also insert in Fig.4a.
Figure4b shows the subsidence of the beach, the lake level and the accumulated evaporation determined
from data recorded at the same meteorological tower on which the GNSS antenna was mounted10. For details see
supplement and Supplementary Fig.S_3. High correlations between evaporation/lake level and subsidence are
expected since the fine-grained sediments cause complete consolidation quickly33,55. The scaling factor between
absolute lake level change and subsidence is 7.2 (Fig.4b). This means that the beach drops—with a time delay
of 2months—with the lake level, but at a 7.2 times smaller rate.
The lake level drop (−110cm/year) is larger than the evaporation observed at this location (97cm/year).
Firstly, this is due to the fact that the inflow of the Jordan river is massively reduced through overuse for con-
sumption and that secondly the brines of the DS are used by industry ~ 30km south of our observation point5,8,11.
3
Vol.:(0123456789)
Scientific Reports | (2021) 11:13518 | https://doi.org/10.1038/s41598-021-91949-y
www.nature.com/scientificreports/
The sum of evaporation losses and of water withdrawals for the potash production, which amount to close to
half of the evaporation losses, cannot be compensated by the surface and subsurface inflow to the DS and cause
the long-term decline of its water table3.
Discussion
Origin of land subsidence. Land subsidence at the Dead Sea region occurs on different spatial and tem-
poral scales7:
(1) Meter to decimeter scale sinkholes are related to subsurface material dissolution and mechani-
cal mobilization30,32 either due to dissolution of a salt edge56,57, structurally controlled groundwater
percolation58,59 or subsurface stream channels36,60,61 Formation rates vary hereby from sudden (e.g.
within seconds) or in the order of mm-cm/month as determined by photogrammetric/InSAR/LiDAR
studies34,36,40,41,44 and morphologies of such sinkholes vary according to mechanical properties of the
overburden66,67.
Figure1. (a) GNSS station in June 2014 (Beach 1). (b) GNSS station in December 2014 (Beach 1). (c) Study
area at the Dead Sea (DS) near Ein Gedi, Israel, with the four GNSS observation sites as green (SPA, with
coordinates) and red (Beach) symbols, respectively. The solid red line shows the profile in Fig.5 (2.4km length).
Note that the Google image is from 2010. In 2014, the DS had sufficiently receded so that the Beach 1 station
was on land. This station had then to be moved twice to be near the lakeshore. WBF Western Boundary Fault
(dashed line), a fault of the Dead Sea Transform (DST) system. (Insert) Study area at the DS (green arrow).
Black arrows indicate the left lateral displacement of 105km at the DST27. Image © 2017 Digital Globe, © 2017
ORION-ME, © 2017 Google.
4
Vol:.(1234567890)
Scientific Reports | (2021) 11:13518 | https://doi.org/10.1038/s41598-021-91949-y
www.nature.com/scientificreports/
(2) Hundred meter scale depressions as common karstic landforms, so called uvalas62, usually with sinkhole
formation in parallel or earlier than the depressions with a strong temporal relation to base-level fall and
structural trends as well as the fresh-salt-water boundary7,58,59.
(3) A large-scale distributed non-linear subsidence with rates between 0.01 and 0.3m/year depending on the
distance towards the shoreline7. The rates agree well with previous InSAR or photogrammetric studies33,41,43,
including the results presented in this study. Effects of subsurface channel or local dissolution related sub-
sidence close to or above active channels can be ruled out for the study site discussed here, as we observe
rather opposite patterns of seasonal subsidence variation compared to42. The nearest visible surface channel
is in a distance of ~ 750m and the nearest sinkholes are reported to occur several hundreds of meters to
the north and west of the Beach station35,63, and also a few hundred meters from the SPA station. Given
the typical size distribution of sinkholes in clayey marl/alluvial sediments36,40, ground subsidence due to
Figure2. Blue triangles represent the DS lake level from 11th June 2014 to 29th March 2017, in meters below
mean sea level, data provided by the Hydrological Service and Water Authority, Israel (Gauge near Massada).
The DS lake level determined from GNSS reflectometry observations (Fig.1, Beach stations) is shown in light
blue (dots), with error bars. The standard error of the GNSS measurements is ± 2.7cm. (Insert) The correlation
coefficient between the two time series is 0.99, indicating the high accuracy of the GNSS observations.
Figure3. Displacement relative to the middle of the observation period is shown for the GNSS station at the
SPA (green symbols) and the Beach stations (red symbols), respectively, between June 2014 and March 2017,
in meters. The average subsidence at the SPA is −2.4 ± 0.7cm/year that at the beach is −15.3 ± 1.2cm/year,
respectively. The standard error of the monthly mean GNSS height measurements is ± 1.1cm. The subsidence at
the beach derived from InSAR is −15.9 ± 1.5cm/year.
5
Vol.:(0123456789)
Scientific Reports | (2021) 11:13518 | https://doi.org/10.1038/s41598-021-91949-y
www.nature.com/scientificreports/
sinkholes would not be observed in the footprint area (Fresnel zones) of the GNSS antenna for our study
sites (see Supplementary Information). Also, uvala formation in either cover material is usually accompa-
nied by large-scale crack formation7, something not observed for the area close to the GNSS stations.
Soil mechanics considerations. The formation of subsidence generally depends also on the rock/soil
mechanical properties, as highlighted in various numerical modelling studies from Refs.39,64–67. A drop in pore
pressure due to the decline of the lake level and, thus, in the fine-grained sediments along the shoreline, causes
the sediments to consolidate33. The main subsurface material in the area is clayey marl and dewatering is a com-
plex process involving kinetic, thermodynamic and electrochemical aspects68. Broad-scale subsidence along the
DS shoreline has been attributed to such compaction of fine-grained formerly water-logged sediments, and was
estimated to several cm/year for marl deposits of the study area by analytical considerations33. The sediments
of the Dead Sea, alluvium, clayey marl deposits and salt, have distinguished mechanical strengths and behavior
ranging from brittle- to ductile failure53,64,68,69, and salt concentration of water-clogged sediments has a signifi-
cant influence on shear strength and Atterberg limits70. In combination with the above-mentioned missing evi-
dence of sinkhole and uvala formation, we therefore consider option (3) from above, the large-scale compaction
of the former Dead Sea lake-bed, as the most probable process that causes the observed subsidence.
We present analytical calculations of ground subsidence and water level fluctuation propagation by apply-
ing simple analytical 1D-soil compaction theory based on Refs.71,72. This assumes, for simplicity, a 20m thick
Figure4. (a) Monthly anomalies of the subsidence of the Beach station (red, from GNSS) and of the drop of
the lake level of the DS (blue, gauge) from June 2014 to March 2017, after removal of their respective 3-year
trends (−15.3cm/year and −110cm/year). The standard error for the subsidence anomalies is ± 1.1cm and for
the lake level anomalies is ± 2.7cm. (Insert) Correlation between the two time series after backward shifting of
the subsidence time series by 2months, with a correlation coefficient of 0.84 (see also Supplementary Fig.S_3).
(b) Absolute values for Beach subsidence (red), lake level drop (blue) and evaporation (black), respectively,
for three 12-month periods from February to February (2014/2015, 2015/2016, 2016/2017). The solid lines
depict the respective average over the three years; the dashed lines are the values for the single years. The winter
2014/2015 was wet (see Supplementary Fig.S_6) and that of 2016/2017 was dry, both visible in higher or lower
lake level values, respectively. The values for the cumulative evaporation are based on Ref.10. The scaling factor
between Beach (land) and the DS lake level is 7.2; i.e. −100cm DS lake level decrease corresponds to −13.9cm
sinking of the beach.
Loading more pages...