
applied
sciences
Article
Beam Profile Characterisation of an Optoelectronic Silicon
Lens-Integrated PIN-PD Emitter between 100 GHz and 1 THz
Jessica Smith 1,2, Mira Naftaly 2,* , Simon Nellen 3and Björn Globisch 3,4
Citation: Smith, J.; Naftaly, M.;
Nellen, S.; Globisch, B. Beam Profile
Characterisation of an Optoelectronic
Silicon Lens-Integrated PIN-PD
Emitter between 100 GHz and 1 THz.
Appl. Sci. 2021,11, 465.
https://doi.org/10.3390/
app11020465
Received: 24 December 2020
Accepted: 30 December 2020
Published: 6 January 2021
Publisher’s Note: MDPI stays neu-
tral with regard to jurisdictional clai-
ms in published maps and institutio-
nal affiliations.
Copyright: © 2021 by the authors. Li-
censee MDPI, Basel, Switzerland.
This article is an open access article
distributed under the terms and con-
ditions of the Creative Commons At-
tribution (CC BY) license (https://
creativecommons.org/licenses/by/
4.0/).
1ATI, University of Surrey, Guildford GU2 7XH, UK; j.f.smith@surrey.ac.uk
2National Physical Laboratory, Teddington TW11 0LW, UK
3
Fraunhofer Institute for Telecommunication, Heinrich Hertz Institute, Einsteinufer 37, 10587 Berlin, Germany;
4Institute of Solid State Physics, Technical University Berlin, Hardenbergstr. 36, 10623 Berlin, Germany
*Correspondence: [email protected]
Featured Application: This paper can be an important starting point for establishing beam profile
measurements as an essential characterization tool for terahertz emitters.
Abstract:
Knowledge of the beam profiles of terahertz emitters is required for the design of tera-
hertz instruments and applications, and in particular for designing terahertz communications links.
We report measurements of beam profiles of an optoelectronic silicon lens-integrated PIN-PD emitter
at frequencies between 100 GHz and 1 THz and observe significant deviations from a Gaussian
beam profile. The beam profiles were found to differ between the H-plane and the E-plane, and to
vary strongly with the emitted frequency. Skewed profiles and irregular side-lobes were observed.
Metrological aspects of beam profile measurements are discussed and addressed.
Keywords: terahertz; emitters; beam profile
1. Introduction
In recent years, continuous-wave (CW) Terahertz (THz) radiation has become a promis-
ing candidate for short range communication links bridging between fibre-optical networks
and wireless transmission, the so-called “THz bridge”. Besides this latest field of applica-
tions, THz technology is employed in a wide range of applications such as: spectroscopy [
1
],
bio-medical imaging [
2
,
3
], reflection imaging [
4
], security [
5
,
6
], non-destructive testing [
7
],
non-contact imaging for art and archaeological conservation [
8
,
9
], and wireless communica-
tion links [
10
,
11
]. CW THz spectroscopy with photomixing emitters and receivers enables
compact sensor heads that cover a broad frequency range of more than 3 THz combined
with high sensitivity [
1
,
12
–
17
]. In particular, photomixers based on indium phosphide
(InP) make it possible to build CW THz systems using off-the-shelf components originally
developed for fibre-based telecommunications [
13
,
18
,
19
]. The mature telecom technology
enables the development of compact and robust THz systems and even photonic integrated
circuits [
14
,
20
]. Wireless communication benefits from fibre-coupled THz transceivers since
they can be integrated seamlessly into optical communication networks, because they use
the same infrastructure, e.g., amplifiers or modulators [10,21,22].
High-speed photodiodes (PD), originally developed as photodetectors for optical
communications [
23
,
24
], serve as an optoelectronic converter in THz emitters [
25
–
31
].
To produce an optical signal modulated at the desired THz frequency f
THz
, two single-
mode laser signals (f
1
,f
2
) are superposed. The envelope frequency of the resulting beat note
is the difference frequency of the laser signals. As long as the PD is capable of following
that envelope frequency, a photocurrent is generated equal to f
THZ
= |f
1−
f
2
|. For efficient
radiation into free space, a broadband antenna is attached to the diode and the diode is
mounted onto a substrate lens [
32
]. In this work, a waveguide-integrated PIN photodiode
Appl. Sci. 2021,11, 465. https://doi.org/10.3390/app11020465 https://www.mdpi.com/journal/applsci

Appl. Sci. 2021,11, 465 2 of 12
with attached bow-tie antenna is employed, which is mounted on a hyper-hemispheric
silicon lens and packaged into a fibre-pigtailed housing. A detailed description of this
emitter and its THz performance can be found elsewhere [33].
While many aspects of PD devices and THz systems as a whole have been inten-
sively studied, the emitter radiation pattern in the THz domain is generally assumed to be
Gaussian. Since mirrors or lenses are commonly employed in spectroscopic and sensing
applications, the beam profile of THz emitters remains widely unknown. However, in THz
communication links, no beam forming elements can be placed in the free space between
the emitter and the receiver. For all applications, but particularly for those involving
medium and long-range free-space propagation such as communications, it is important to
have a good understanding of the spatial profile of the THz beam. Therefore, an investiga-
tion of the beam profile is urgently required to develop transmitters, i.e., antenna structures,
dedicated to THz communication links. In microwave and millimetre wave communication
systems, the characterization of emitter (transmitter) beam profiles has long since been
accepted as an essential tool. In this field, the techniques for antenna characterisation are
extensively developed and well understood [
34
]. Furthermore, specialized facilities are
available to perform the required measurements. None of these as yet exist for THz devices.
THz radiation is often assumed to propagate as a perfect Gaussian beam, which the present
study shows to be inaccurate.
There is very little published literature on measurements of beam profiles of CW THz
emitters, with the vast majority of beam profile data describing pulsed systems
[35–38]
.
This is primarily due to the widespread use of pulsed THz systems for spectroscopy,
where beam profile properties may give rise to errors in spectroscopic data. Moreover,
pulsed THz emitters have peak powers that are 3–4 orders of magnitude higher than CW
devices, facilitating beam characterisation. Of the existing literature on CW beam profiles,
most are for high power laser sources with a narrow tuning range such as quantum cascade
lasers (QCLs) [39,40] and gas lasers [41].
In this study we performed detailed measurements of the beam profile of a commercial
THz emitter based on a PIN photodiode at frequencies between 100 GHz and 1 THz, and for
both E-plane and H-plane.
2. Materials and Methods
The PIN diode emitter was fabricated at Fraunhofer HHI in Germany [
33
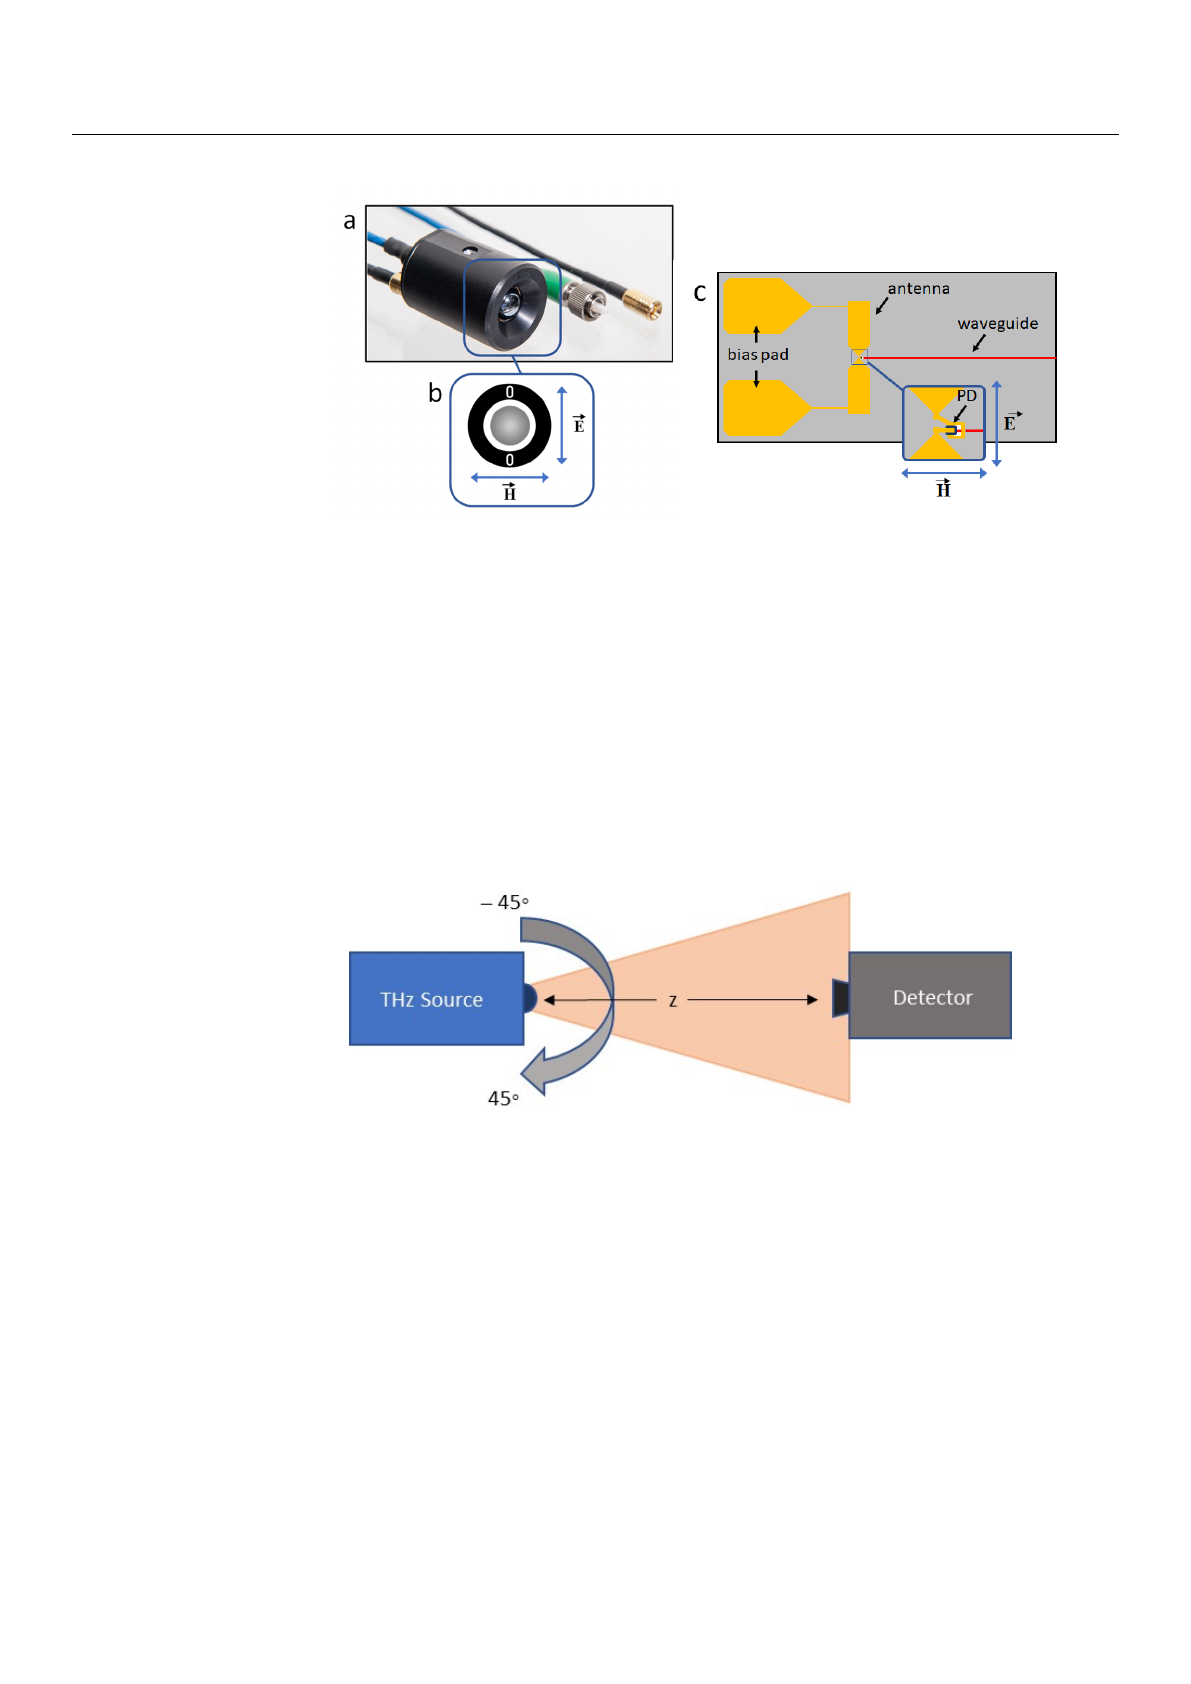
]. A diagram
of the emitter antenna is shown in Figure 1with the E- and H- planes indicated. The emitter
is mounted onto a hyper-hemispherical high-resistivity silicon (Si) lens with a diameter of
10 mm to reduce both beam divergence [
32
] and coupling losses (due to Fresnel reflections)
from the InP substrate to air. The beam profiles were obtained using an angular mapping
method, applied in two orthogonal orientations to yield beam profiles in the E-plane and
H-plane. The frequency of the emitter was tuned from 100 GHz to 1 THz.
The beam profile of an emitter can be described by adopting two different approaches:
(i) lateral displacement or (ii) angular displacement of the emitter with respect to the re-
ceiver. For a collimated beam where lateral dimensions and profile are preserved with
distance from the source, lateral mapping is appropriate to describe the beam profile.
For a divergent source, angular mapping is more appropriate, because angular spread
and variation is preserved with distance from the source. Since the PIN diode emitter
examined here is a divergent source, its beam profiles were measured using an angular
mapping method.
Appl. Sci. 2021,11, 465 3 of 12
Appl.Sci.2021,11,xFORPEERREVIEW3of12
Figure1.(a)Photographofthefibre‐coupledPIN‐PDemittermodule.Opticalfibre(bluecable)
andSMBcable(blackcable)fortheelectricalbiascanbeseen.(b)TheH‐andE‐planeorientations
aremarkedonthehousingofthemodule.(c)SchematicstructureofthePIN‐PDemitterchip.The
waveguideintegratedPDisconnectedtoanextendedbow‐tieantennawithabracket‐like
electronicstructure(inset).H‐andE‐fieldorientationsarehighlighted.
Thebeamprofileofanemittercanbedescribedbyadoptingtwodifferent
approaches:(i)lateraldisplacementor(ii)angulardisplacementoftheemitterwith
respecttothereceiver.Foracollimatedbeamwherelateraldimensionsandprofileare
preservedwithdistancefromthesource,lateralmappingisappropriatetodescribethe
beamprofile.Foradivergentsource,angularmappingismoreappropriate,because
angularspreadandvariationispreservedwithdistancefromthesource.SincethePIN
diodeemitterexaminedhereisadivergentsource,itsbeamprofilesweremeasuredusing
anangularmappingmethod.
Theangularprofilesofbothorientationsoftheemitterweremeasuredusingthe
setupshowninFigure2.Theemitterwasplacedonarotarystageandrotatedwithrespect
tothedetectorfrom−45°to+45°in0.2°steps.ThedetectorwasaTydexGC‐1TGolaycell
withan11‐mmaperture.TheemitterwaspoweredandcontrolledbyaTopticaTeraScan
system.Thebiasmodulationfrequencywassetto11.242Hz,sincethiswastheoptimum
modulationfrequencytomaximisetheresponsivityoftheGolaydetector.Theoutputof
thedetectorwasreadbyalock‐inamplifier(SignalRecovery7265DSP).
Figure2.Experimentalset‐upformappingangularbeamprofiles.Thesource,mountedona
rotarystage,isrotatedbetween−45°and45°withrespecttothedetector.Thedetectorisplacedon
alineartranslationstagetoallowvariationofthedistancebetweentheemitteranddetector.
Figure 1.
(
a
) Photograph of the fibre-coupled PIN-PD emitter module. Optical fibre (blue cable)
and SMB cable (black cable) for the electrical bias can be seen. (
b
) The H- and E-plane orientations
are marked on the housing of the module. (
c
) Schematic structure of the PIN-PD emitter chip.
The waveguide integrated PD is connected to an extended bow-tie antenna with a bracket-like
electronic structure (inset). H- and E-field orientations are highlighted.
The angular profiles of both orientations of the emitter were measured using the setup
shown in Figure 2. The emitter was placed on a rotary stage and rotated with respect to
the detector from
−
45
◦
to +45
◦
in 0.2
◦
steps. The detector was a Tydex GC-1T Golay cell
with an 11-mm aperture. The emitter was powered and controlled by a Toptica TeraScan
system. The bias modulation frequency was set to 11.242 Hz, since this was the optimum
modulation frequency to maximise the responsivity of the Golay detector. The output of
the detector was read by a lock-in amplifier (Signal Recovery 7265 DSP).
Appl.Sci.2021,11,xFORPEERREVIEW3of12
Figure1.(a)Photographofthefibre‐coupledPIN‐PDemittermodule.Opticalfibre(bluecable)
andSMBcable(blackcable)fortheelectricalbiascanbeseen.(b)TheH‐andE‐planeorientations
aremarkedonthehousingofthemodule.(c)SchematicstructureofthePIN‐PDemitterchip.The
waveguideintegratedPDisconnectedtoanextendedbow‐tieantennawithabracket‐like
electronicstructure(inset).H‐andE‐fieldorientationsarehighlighted.
Thebeamprofileofanemittercanbedescribedbyadoptingtwodifferent
approaches:(i)lateraldisplacementor(ii)angulardisplacementoftheemitterwith
respecttothereceiver.Foracollimatedbeamwherelateraldimensionsandprofileare
preservedwithdistancefromthesource,lateralmappingisappropriatetodescribethe
beamprofile.Foradivergentsource,angularmappingismoreappropriate,because
angularspreadandvariationispreservedwithdistancefromthesource.SincethePIN
diodeemitterexaminedhereisadivergentsource,itsbeamprofilesweremeasuredusing
anangularmappingmethod.
Theangularprofilesofbothorientationsoftheemitterweremeasuredusingthe
setupshowninFigure2.Theemitterwasplacedonarotarystageandrotatedwithrespect
tothedetectorfrom−45°to+45°in0.2°steps.ThedetectorwasaTydexGC‐1TGolaycell
withan11‐mmaperture.TheemitterwaspoweredandcontrolledbyaTopticaTeraScan
system.Thebiasmodulationfrequencywassetto11.242Hz,sincethiswastheoptimum
modulationfrequencytomaximisetheresponsivityoftheGolaydetector.Theoutputof
thedetectorwasreadbyalock‐inamplifier(SignalRecovery7265DSP).
Figure2.Experimentalset‐upformappingangularbeamprofiles.Thesource,mountedona
rotarystage,isrotatedbetween−45°and45°withrespecttothedetector.Thedetectorisplacedon
alineartranslationstagetoallowvariationofthedistancebetweentheemitteranddetector.
Figure 2.
Experimental set-up for mapping angular beam profiles. The source, mounted on a rotary
stage, is rotated between
−
45
◦
and 45
◦
with respect to the detector. The detector is placed on a linear
translation stage to allow variation of the distance between the emitter and detector.
3. Results
3.1. Power Measurements
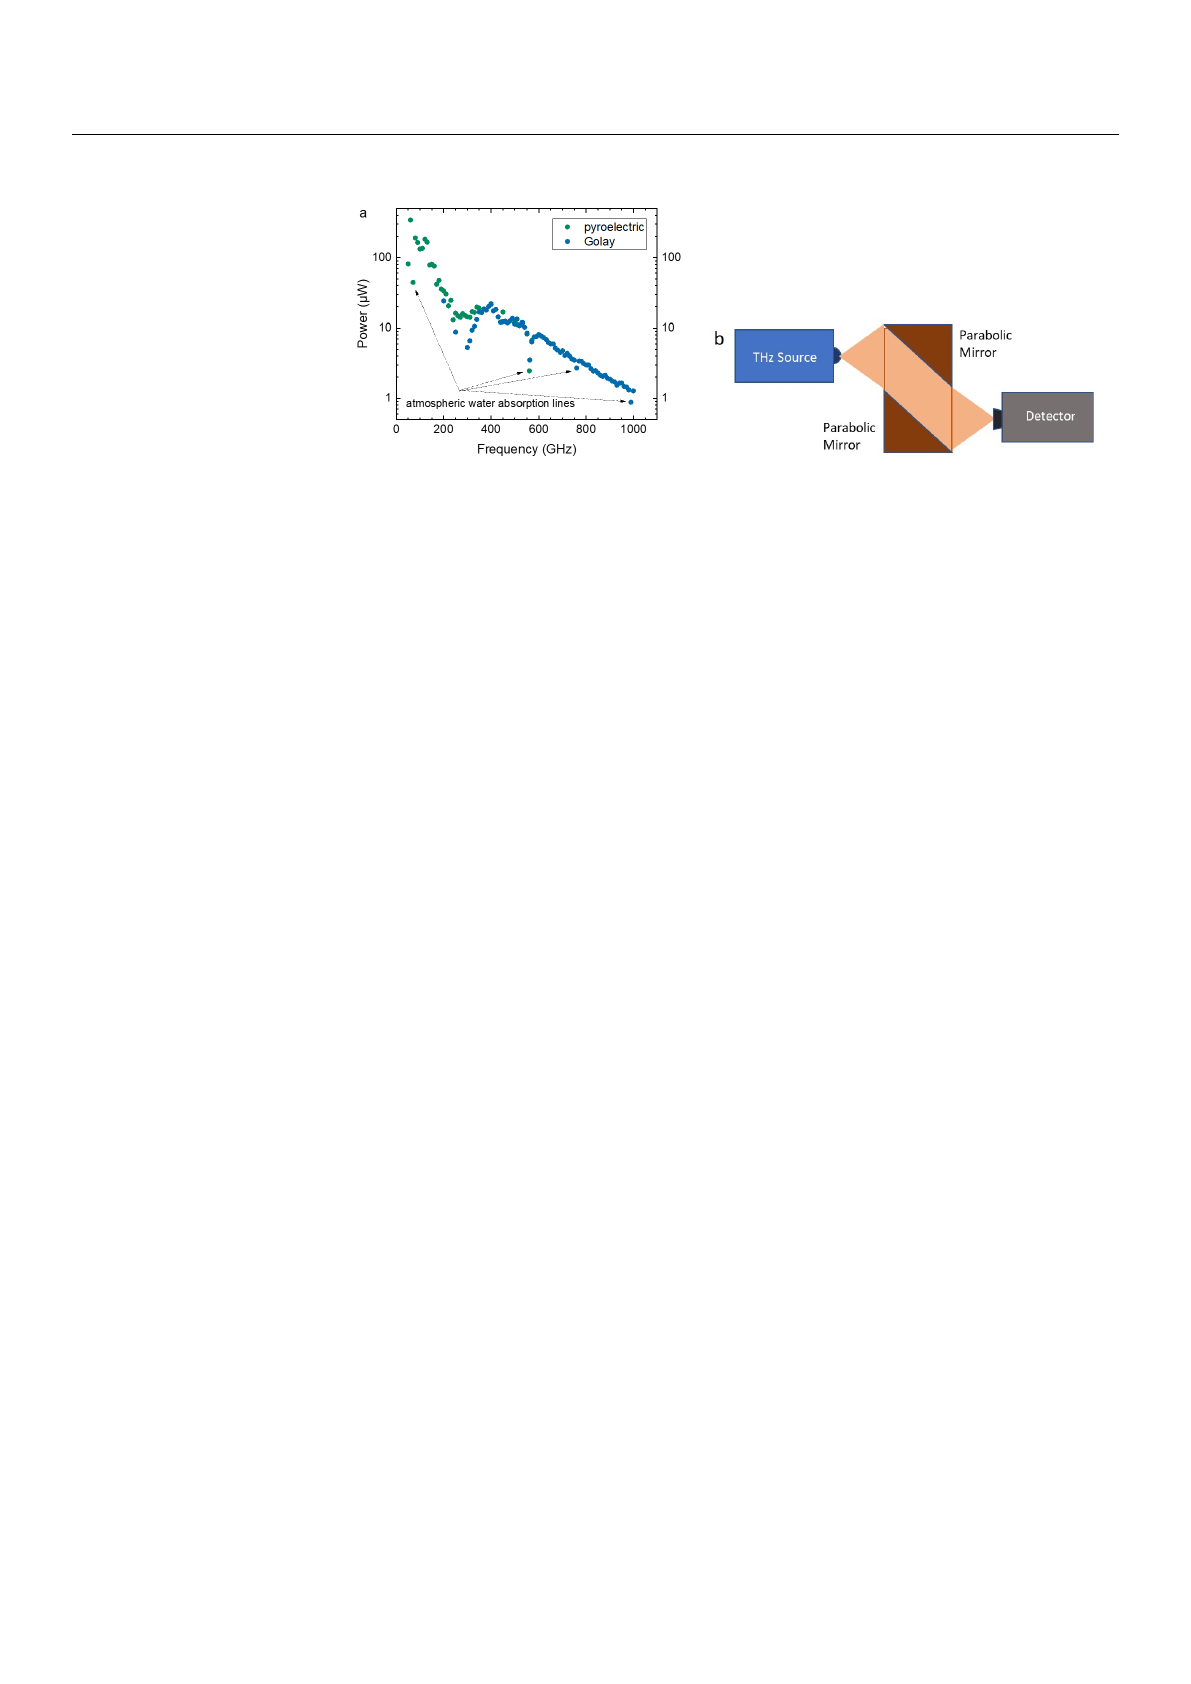
The power output of the emitter, shown in Figure 3a, was measured for frequencies
between 50 GHz and 1000 GHz using both a pyroelectric detector (Sensor- und Lasertechnik
THZ 10) and a Golay cell (Tydex GC-1T). THz radiation from the emitter was collected
and re-focused by two parabolic mirrors, as shown in Figure 3b. The pyroelectric detector
was calibrated by the national institute for metrology of Germany (PTB) and was used
to measure the emitter power at frequencies between 50 GHz and 500 GHz. Frequencies
between 200 GHz and 1000 GHz were measured using the more sensitive Golay cell,
and the overlapping measurements between 200 GHz and 500 GHz were used to calibrate
the Golay cell responsivity. Measurements were taken in 10 GHz steps.
Appl. Sci. 2021,11, 465 4 of 12
Appl.Sci.2021,11,xFORPEERREVIEW4of12
3.Results
3.1.PowerMeasurements
Thepoweroutputoftheemitter,showninFigure3a,wasmeasuredforfrequencies
between50GHzand1000GHzusingbothapyroelectricdetector(Sensor‐ und
LasertechnikTHZ10)andaGolaycell(TydexGC‐1T).THzradiationfromtheemitter
wascollectedandre‐focusedbytwoparabolicmirrors,asshowninFigure3b.The
pyroelectricdetectorwascalibratedbythenationalinstituteformetrologyofGermany
(PTB)andwasusedtomeasuretheemitterpoweratfrequenciesbetween50GHzand500
GHz.Frequenciesbetween200GHzand1000GHzweremeasuredusingthemore
sensitiveGolaycell,andtheoverlappingmeasurementsbetween200GHzand500GHz
wereusedtocalibratetheGolaycellresponsivity.Measurementsweretakenin10GHz
steps.
Figure3.(a)PoweroutputofthePINdiodeasafunctionoffrequency.Powerwasmeasuredwith
acalibratedpyroelectricdetectorforfrequenciesbelow500GHzandwithaGolaycellfor200GHz
to1000GHz.(b)Opticalsetupforpowermeasurement.
3.2.BeamProfiles
AngularbeamprofilemeasurementsforbothorientationsofthePINdiodeemitter
wereperformedwiththeGolaycellforafrequencyrangeof100GHzto1000GHzat50
GHzintervals.TheresultingprofilesareshowninFigure4a,b.Allprofileswere
normalisedtoallowforeaseofcomparison,sincethepowerratiobetweenthelowand
highfrequenciesisovertwoordersofmagnitude(seeFigure3).
TheH‐planeprofilesinFigure4a,whilenotperfectlyGaussian,showasinglepeak
centredaround0°forfrequenciesbelow400GHz.Between400GHzand600GHz,the
singlepeakbecomessignificantlybroaderandshowssignificantsmallfeatures
throughouttheprofile.Above600GHz,thecentreofthepeakskewstothenegative
angles.
InFigure4b,theE‐planeprofilesforfrequenciesbelow250GHzalsoshowapeak
centredat0°;however,unliketheH‐planeprofiles,therearealsosignificantsidelobes
eithersideofthecentre.Above300GHz,thesesidelobesdisappear,butthemainpeak
becomesheavilyskewedtothepositiveanglesandhighlyasymmetrical.
Whilethebow‐tieantennaitselfissymmetric,thefeedinglinesandtheInPsubstrate
arenot.Whenthewavelengthisofasimilarorderasthedimensionsofthefeedingpoint
structuresorthesubstrate,thosestructuresstarttoradiateorcauserefraction.The
influenceofthefeedingpointgeometryonthebeamprofileisstudiedinaseparate
publication.
Figure 3.
(
a
) Power output of the PIN diode as a function of frequency. Power was measured with a
calibrated pyroelectric detector for frequencies below 500 GHz and with a Golay cell for 200 GHz to
1000 GHz. (b) Optical setup for power measurement.
3.2. Beam Profiles
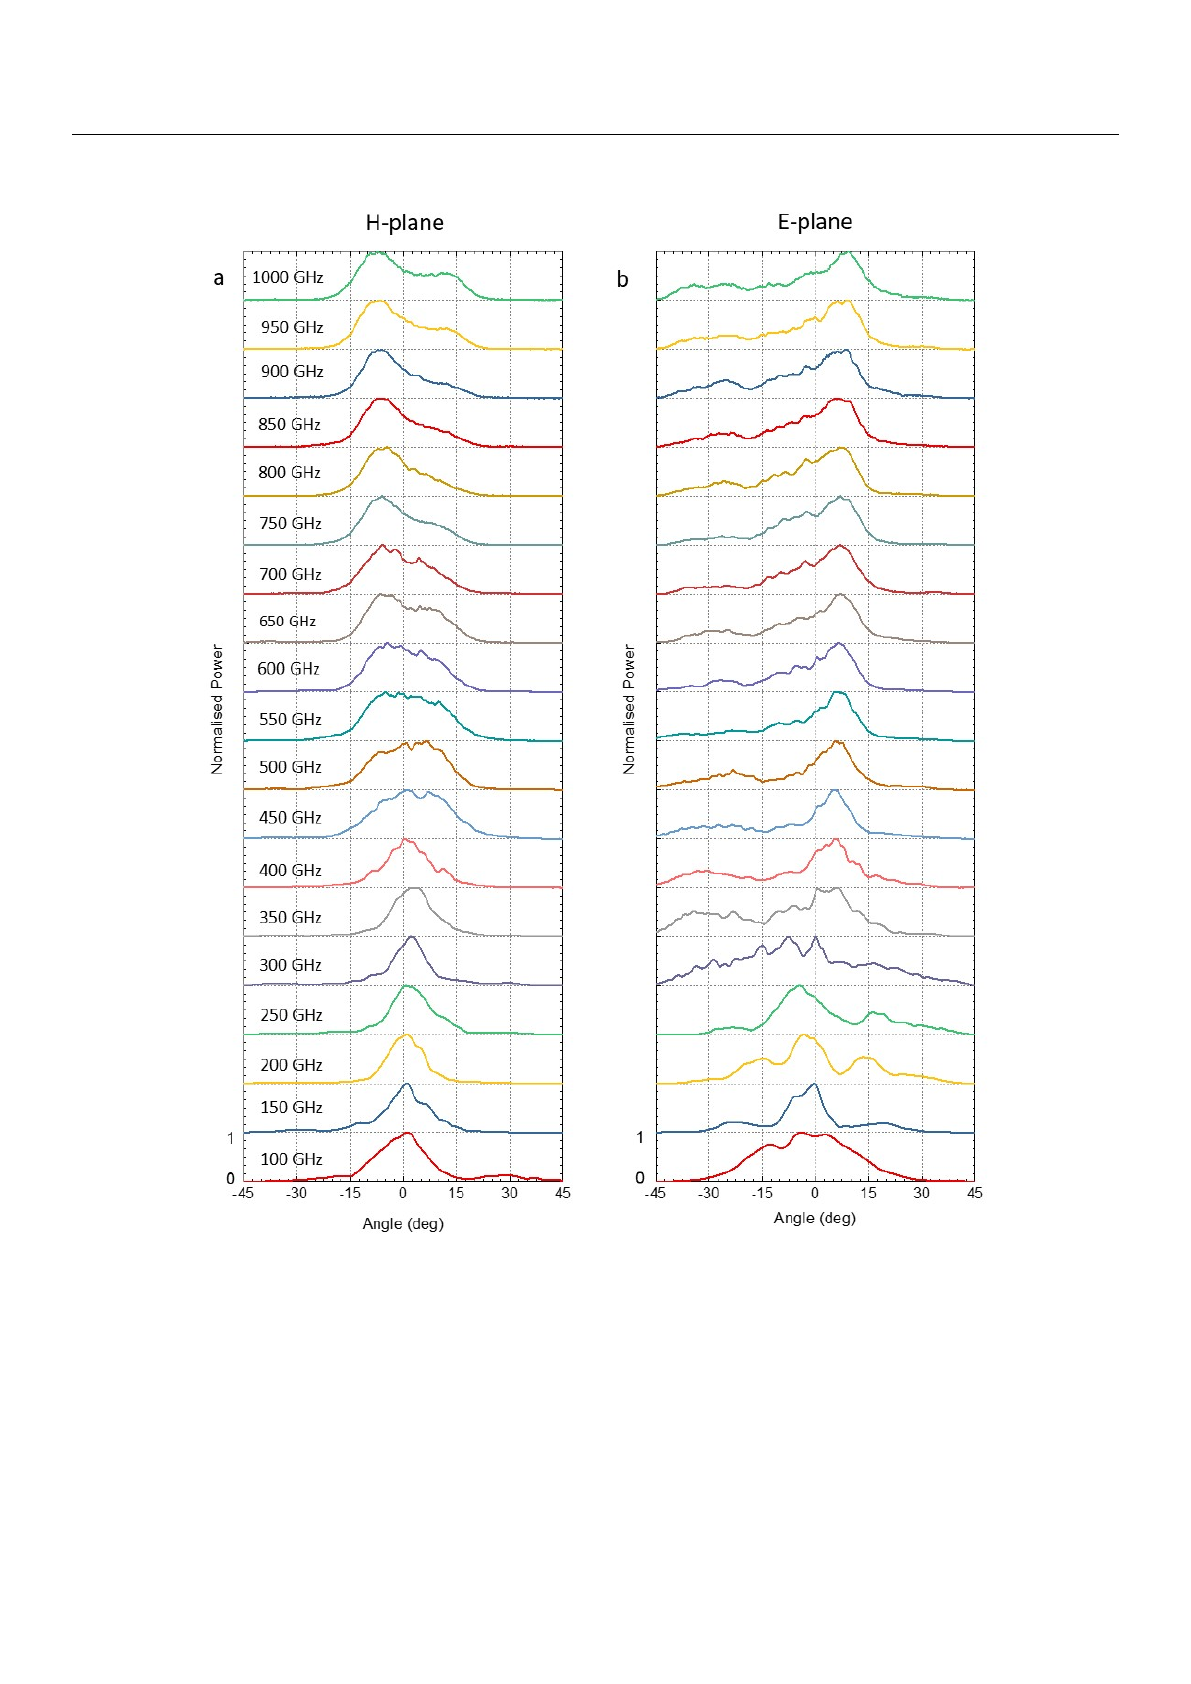
Angular beam profile measurements for both orientations of the PIN diode emitter
were performed with the Golay cell for a frequency range of 100 GHz to 1000 GHz at 50 GHz
intervals. The resulting profiles are shown in Figure 4a,b. All profiles were normalised to
allow for ease of comparison, since the power ratio between the low and high frequencies
is over two orders of magnitude (see Figure 3).
The H-plane profiles in Figure 4a, while not perfectly Gaussian, show a single peak
centred around 0
◦
for frequencies below 400 GHz. Between 400 GHz and 600 GHz, the sin-
gle peak becomes significantly broader and shows significant small features throughout
the profile. Above 600 GHz, the centre of the peak skews to the negative angles.
In Figure 4b, the E-plane profiles for frequencies below 250 GHz also show a peak
centred at 0
◦
; however, unlike the H-plane profiles, there are also significant side lobes
either side of the centre. Above 300 GHz, these side lobes disappear, but the main peak
becomes heavily skewed to the positive angles and highly asymmetrical.
While the bow-tie antenna itself is symmetric, the feeding lines and the InP substrate
are not. When the wavelength is of a similar order as the dimensions of the feeding point
structures or the substrate, those structures start to radiate or cause refraction. The influence
of the feeding point geometry on the beam profile is studied in a separate publication.
Appl. Sci. 2021,11, 465 5 of 12
Appl.Sci.2021,11,xFORPEERREVIEW5of12
Figure4.NormalizedangularbeamprofilesofthePINdiodeemitterforfrequenciesbetween100GHzand1THzat50
GHzintervals,measuredatadistanceof60mmfromtheemitterfor:(a)H‐planeorientationand(b)E‐planeorientation.
Allprofilesarenormalisedforeaseofcomparison.
3.3.ExperimentalConsiderations
3.3.1.NearFieldvs.FarField
Theelectromagneticfieldofanantennaiscommonlydescribedasevolvingfromthe
nearfieldregion,wheretheangulardistributionofthefieldvarieswithdistancefromthe
antenna,tothefarfieldregion,wheretheangulardistributionisdistance‐independent.
Thenear‐fieldregionmaybefurtherdividedintothereactiveandradiativeregions.The
reactivenearfieldregiondecaysrapidlywithdistancefromtheantenna,andbecomes
negligiblecomparedwiththeradiativecomponentwithinonewavelengthdistancefrom
Figure 4.
Normalized angular beam profiles of the PIN diode emitter for frequencies between 100 GHz and 1 THz at
50 GHz intervals, measured at a distance of 60 mm from the emitter for: (
a
) H-plane orientation and (
b
) E-plane orientation.
All profiles are normalised for ease of comparison.
3.3. Experimental Considerations
3.3.1. Near Field vs. Far Field
The electromagnetic field of an antenna is commonly described as evolving from
the near field region, where the angular distribution of the field varies with distance from
the antenna, to the far field region, where the angular distribution is distance-independent.
The near-field region may be further divided into the reactive and radiative regions. The re-
active near field region decays rapidly with distance from the antenna, and becomes
negligible compared with the radiative component within one wavelength distance from
Loading more pages...