Mechanochemical Synthesis and Magnetic Characterization of
Nanosized Cubic Spinel FeCr2S4Particles
Anna-Lena Hansen, Reinhard K. Kremer,*Eva M. Heppke, Martin Lerch, and Wolfgang Bensch*
Cite This: ACS Omega 2021, 6, 13375−13383
Read Online
ACCESS Metrics & More Article Recommendations
ABSTRACT: Nanosized samples of the cubic thiospinel FeCr2S4were synthesized by
ball milling of FeS and Cr2S3precursors followed by a distinct temperature treatment
between 500 and 800 °C. Depending on the applied temperature, volume weighted mean
(Lvol) particle sizes of 56 nm (500 °C), 86 nm (600 °C), and 123 nm (800 °C) were
obtained. All samples show a transition into the ferrimagnetic state at a Curie
temperature TCof ∼167 K only slightly depending on the annealing temperature. Above
TC, ferromagnetic spin clusters survive and Curie−Weiss behavior is observed only at T
≫TC, with Tdepending on the heat treatments and the external magnetic field applied.
Zero-field-cooled and field-cooled magnetic susceptibilities diverge significantly below TC
in contrast to what is observed for conventionally solid-state-prepared polycrystalline
samples. In the low-temperature region, all samples show a transition into the orbital
ordered state at about 9 K, which is more pronounced for the samples heated to higher
temperatures. This observation is a clear indication that the cation disorder is very low
because a pronounced disorder would suppress this magnetic transition. The unusual magnetic properties of the samples at low
temperatures and different external magnetic fields can be clearly related to different factors like structural microstrain and
magnetocrystalline anisotropy.
■INTRODUCTION
Binary and ternary chromium chalcogenides exhibit a large
variety of chemical and physical properties explaining the
intense research of these materials. Examples for the diversity
of properties are a large linear negative thermal expansion,
1
the
tuneable thermoelectric properties,
2−5
a large magnetocaloric
effect,
6
the photocatalytic properties in dye degradation,
7
the
tuning of magnetic properties by Li intercalation,
8
ferrimag-
netic properties in nanosheets,
9
the application as stable
electrode material in sodium-ion batteries,
10
or the generation
of nanoscale networks.
11
One of the most intensely
investigated ternary chromium chalcogenides is the iron
chromium thiospinel FeCr2S4, which crystallizes in the normal
cubic spinel structure with the general formula AB2X4(space
group: Fd3m, no. 227). The S2−anions are arranged in a close-
packed face-centered cubic (fcc) lattice, creating tetrahedral
(A) and octahedral (B) voids, which are partially occupied by
the Fe and Cr cations. The Fe2+ cations occupy 1/8 of the
tetrahedral voids and the Cr3+ cation 1/2 of the octahedral
positions. The d-orbitals of the Fe2+ cations are split into an
energetically lower edoublet and an upper t2triplet. The 3d6
electrons are distributed over the orbitals according to Hund’s
rule, yielding a high-spin configuration with S= 2, and these
cations are Jahn−Teller active. The 3d3electrons of the Cr3+
cations occupy the t2g level with S= 3/2. The magnetic and
especially the magnetoelectric properties of FeCr2S4attracted
particular attention.
12−14
Three main exchange couplings affect
the magnetic behavior of FeCr2S4: nearest-neighbor ferromag-
netic B−B (Cr−Cr) interactions, the more distant neighbor
antiferromagnetic B−B interactions, and the 120°A−B
superexchange interaction that is antiferromagnetic. By
neutron powder diffraction, FeCr2S4has been shown to
order ferrimagnetically below ∼180 K with Fe and Cr
moments aligned collinear antiparallel.
15
Already early on
unusual physical properties like a complex behavior of the Hall
resistivity,
16
anisotropic resistivity and magnetoresistance
effects due to spin disorder were reported.
17
Mossbauer
spectroscopic investigations on polycrystalline FeCr2S4dem-
onstrated an unusual behavior of the electric field gradient at
the Fe2+ site at about 10 K.
18,19
Further, low-temperature
Mossbauer spectroscopy studies indicated a static cooperative
Jahn−Teller (JT) distortion (c/a< 1) on the tetrahedral site,
stabilizing the 5Egground state of the Fe2+ cations.
20−22
Heat
capacity measurements at low temperatures exhibited a λ-like
anomaly around this temperature but the particular shape of
this anomaly depends on the stoichiometry of the sample.
23,24
Received: March 16, 2021
Accepted: April 20, 2021
Published: May 10, 2021
Article
http://pubs.acs.org/journal/acsodf
© 2021 The Authors. Published by
American Chemical Society 13375
https://doi.org/10.1021/acsomega.1c01412
ACS Omega 2021, 6, 13375−13383
Downloaded via 83.236.27.156 on October 27, 2021 at 07:51:19 (UTC).
See https://pubs.acs.org/sharingguidelines for options on how to legitimately share published articles.

Colossal magnetoresistance (CMR) behavior was observed
with a magnitude comparable to that found in manganites.
25
However, adverse to the manganites, the CMR is not caused
by double exchange or a JT distortion.
26,27
It was proposed
that by increasing the temperature, long-range magnetic order
gradually breaks down by approaching TCaccompanied by the
formation of nanosized spin clusters, which survive well above
TC. In an external magnetic field above TC, the rapidly
fluctuating spin clusters coalesce and generate bulk-like
ferromagnetism, which leads to the lowering of electrical
resistivity. Evidence for superexchange interactions between
Fe2+ and Cr3+ cations in FeCr2S4was obtained using resonant
inelastic X-ray scattering (RIXS) investigations.
28
Below the Curie temperature TC, which varies between
177
29
and 167 K,
30−32
several unusual features were observed
in the temperature-dependent magnetization curves: A cusp-
like anomaly occurs at Tm∼60 K as well as a splitting of the
zfc−fc susceptibility data below this temperature.
30,33−35
The
divergence of the zfc−fc susceptibilities resembles a glassy
behavior, which is exceptional for a stoichiometric and ordered
system. Spin-glass-like states were also postulated to exist
below 60 K due to fluctuating competing exchange interactions
in conjunction with high magnetocrystalline anisotropy for the
Fe2+ moments at the tetrahedral site being strongly
antiferromagnetically coupled with Cr3+ cations.
33
This
unusual magnetic behavior was attributed to changes in the
domain structure
30
and the appearance of noncubic magneto-
crystalline anisotropy.
36
The latter was proposed to be the
result of the structure transformation, generating pinning
centers for magnetic domain walls. But neutron scattering
investigations demonstrated that the magnetic structure is of
simple Neel type well down to 4 K with μ(Cr) = 2.9 μBand
μ(Fe) = 4.2 μB, giving a total magnetic moment μ= 1.6 μB(TC
= 180 K).
37
In other neutron diffraction studies, the values
1.92 μB/fu (fu = formula unit)
38
and 1.59 μB/fu were
determined.
12
A broadening of Bragg reflections in X-ray
powder diffraction patterns below TCwas attributed to
inhomogeneous lattice distortions.
39
Low-temperature high-
resolution transmission electron microscopy on oriented single
crystals of FeCr2S4showed a cubic to triclinic structural phase
transition within crystallographic domains and an overall
symmetry reduction from Fd3mto F43m.
40
The proposed
structural transformation at Tm≈60 K could be revealed with
ultrasonic measurements on single crystals.
41
An anomaly in
the magnetization versus field curve was observed for μ0H=
5.5 T, which was attributed to the development of a new
magnetic phase, most probably from the incommensurate
noncollinear spin structure
42
to the commensurate collinear
spin structure.
43
Spin reorientation at 60 K was also reported
from ultrasound studies on dense polycrystalline samples.
44
ac
magnetic susceptibility measurements performed on oriented
single crystals showed a pronounced frequency dependence
between 90 and 20 K for both the real and imaginary parts of
the ac susceptibility. The observations made for the field and
temperature dependence were explained by domain wall
pinning. Below 60 K, changes in the domain structure and
appearance of pinning centers caused by structural changes
were suggested to lead to spin-glass-like magnetic anomalies
below 60 K.
30
A second anomaly in the magnetic susceptibility data was
observed at around 9 K and attributed to orbital order-
ing.
18,19,38,45−47
It was argued that this anomaly occurs due to a
unit cell volume contraction and that a cooperative JT effect
and spin−orbit coupling of the Fe2+ ion compete, leading to
spin reorientation at about 60 K, which gives rise to the onset
of short-range orbital ordering at this temperature.
48
It is
noteworthy that the anomaly at T∼9 K can be suppressed in
polycrystalline specimens by applying large magnetic fields.
49
For single crystals, experimental evidence was presented that
an orbital glass phase is formed at TOO ∼9K.
32,33,35,42,43,47
The Curie temperature and the anomaly at 9 K are only weakly
shifted at high external fields up to 9 T. At lower magnetic
fields, the magnetic moments of Fe2+ and Cr3+ are lower than
the spin-only values, and only for μ0Hext = 5.5 T, the expected
spin-only values are reached. The dielectric permeability shows
a linear correlation with the magnetization of the sample,
which is consistent with the existence of ferroelectric
polarization and a multiferroic ground state below 10 K.
12,13
The critical exponents, β,γ, and δ, for the paramagnetic to
ferrimagnetic phase transition were determined using different
approaches. βand γare found close to the mean field theory
values, whereas δis higher than expected, which has been
attributed to incomplete ferrimagnetic transition and the
presence of short-range ordering above TC.
31
A perpetual problem with FeCr2S4samples, crystals and
polycrystalline material, is that often the physical properties
depend essentially on the detailed synthesis conditions, causing
hardly controllable minute compositional mismatch and/or
positional disorder of the cations. Consequently, samples
synthesized by conventional high-temperature techniques
often showed differences in the magnetization and zfc−fc
curves compared to, e.g., a material obtained by the field-
activated sintering technique (FAST). However, for the FAST
sample, the magnetic anomaly at TOO ∼9 K was found absent
and the anomaly normally occurring at Tm∼60 K is shifted to
a lower temperature. In addition, the transition from
paramagnetic to the ferrimagnetic state is less sharp for the
FAST sample. All observations have been attributed to residual
structural disorder in the samples prepared with FAST.
50
To
summarize, the magnetic characteristics of single-crystalline
and polycrystalline FeCr2S4samples are as follows: (i) a
transition from paramagnetic to the ferrimagnetic state occurs
at TC∼170 K; (ii) below the Curie temperature, structural
changes or lattice distortions as well as spin reorientation set
in, leading to magnetic anomalies at about 60 K; and (iii)
orbital ordering is observed at TOO ≈9K.
In the past, all investigations were performed on well-
crystallized polycrystalline samples of FeCr2S4or on single
crystals, which were prepared by chemical vapor deposition.
The only exception is the study of FAST samples reported in
ref 50, which showed a different magnetic behavior compared
to single crystals or microcrystalline samples. A systematic
study of the changes of the magnetic behavior as a function of
sizes of coherently scattering domains was not performed until
now on FeCr2S4. For the preparation of nanoparticles, several
synthetic approaches were well established. Very often solvent-
mediated methods are applied, which have the disadvantage
that the surfaces of the crystallites are covered by capping
molecules. To avoid such impurities, mechanochemistry is a
promising approach. While this synthetic approach is applied
in many areas of inorganic and organic chemistry, it has rarely
been utilized for the preparation of ternary sulfides. Hence, we
decided using the mechanochemical technique for the first
time for the generation of nanosized FeCr2S4materials. The
main aim of the present study is to get better insights into the
variation of the magnetic properties in the nanoregime and
ACS Omega http://pubs.acs.org/journal/acsodf Article
https://doi.org/10.1021/acsomega.1c01412
ACS Omega 2021, 6, 13375−13383
13376
thereforeweintentionallysynthesized nanosized FeCr2S4
polycrystalline samples with particle size distributions ranging
between 10 and 50 nm by reacting ball-milled mixtures of FeS
and Cr2S3at temperatures between 500 and 800 °C. With
increasing annealing temperature, we find a continuous
increase of the particle size, a moderate increase of saturation
magnetic moment, and a variation of magnetocrystalline
anisotropy. We attribute these observations to the variation
of the defect structure with the annealing temperature
modifying the approach to magnetic saturation.
■RESULTS AND DISCUSSION
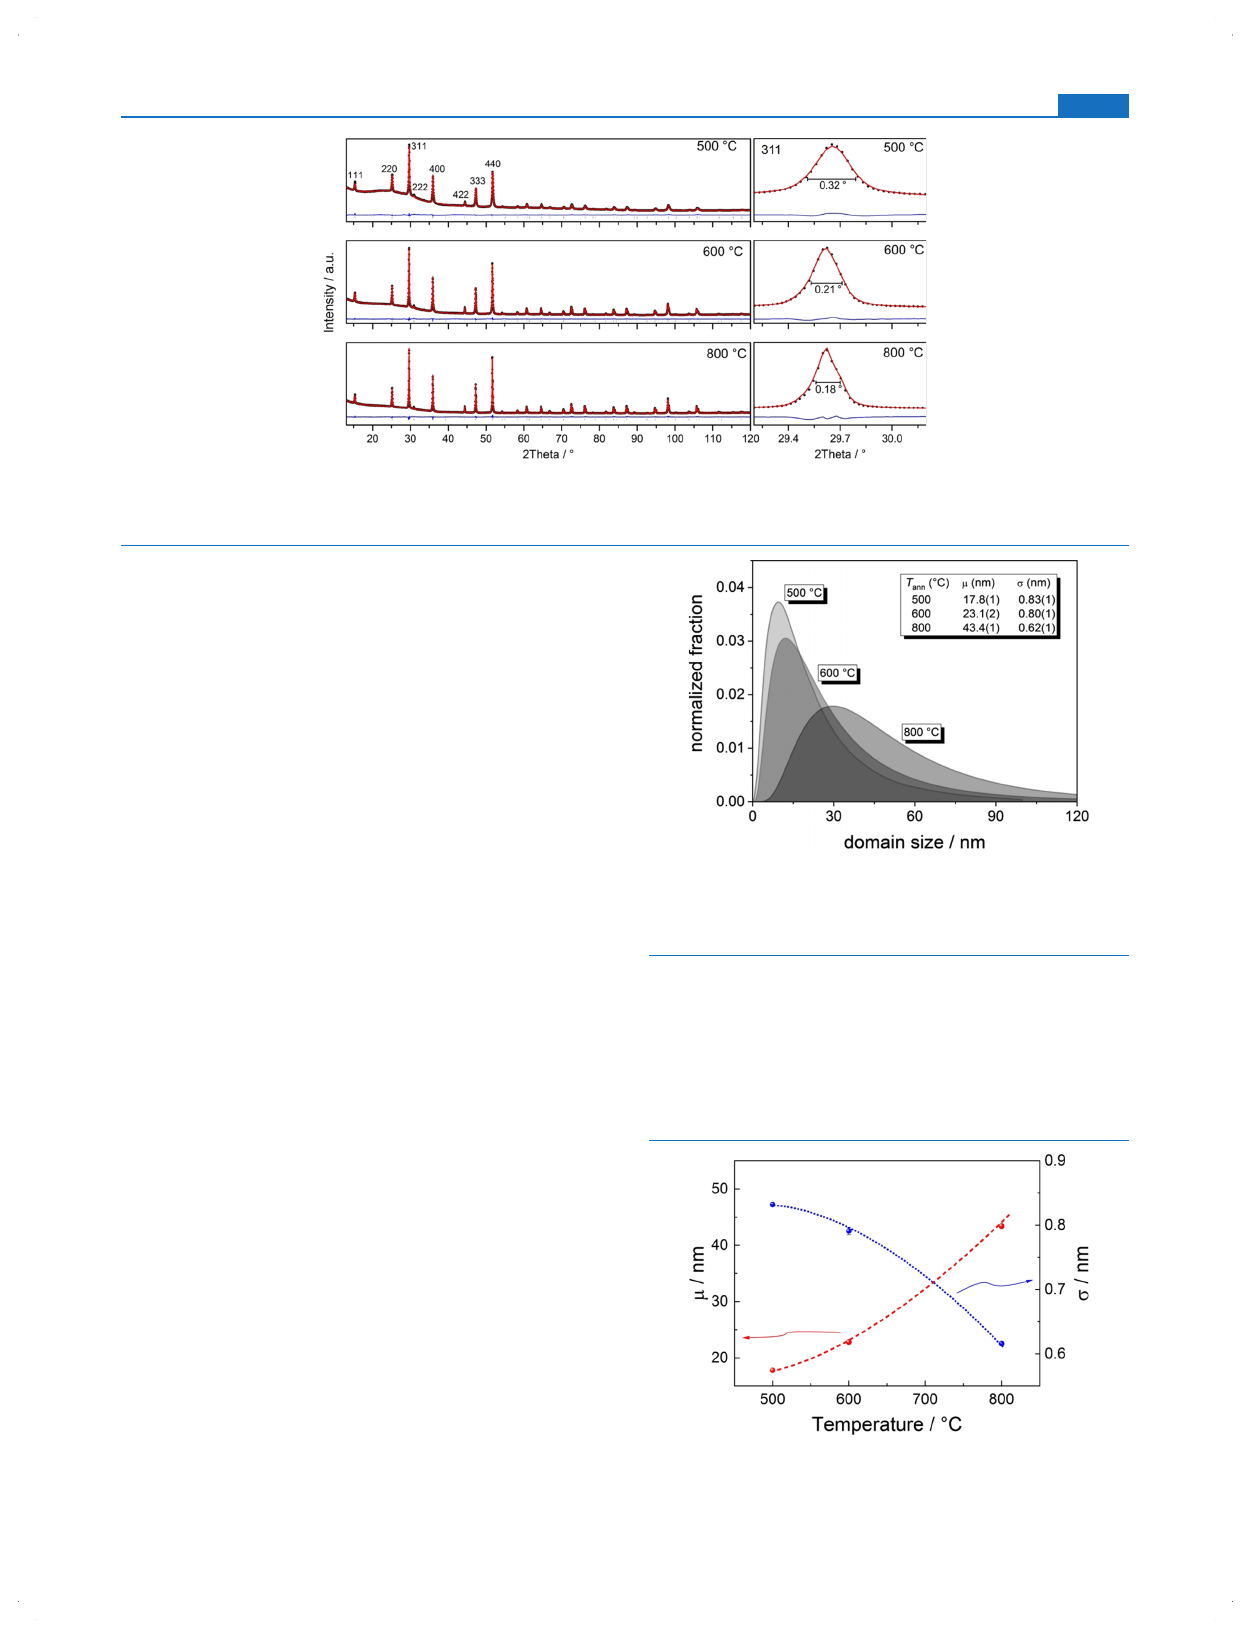
Particle Size. The XRPD patterns of the three samples and
the results of the Rietveld refinements assuming the space
group Fd3m(no. 227) (Fe: 8a; Cr: 16d; S: 32e, 0.383) are
displayed in Figure 1. All samples are phase pure and the cubic
lattice parameters were refined to 9.9832(1) Å (500 °C),
9.9922(1) Å (600 °C), and 9.9923(1) Å (800 °C). The cubic
lattice parameter aof the 500 °C sample is significantly smaller
than values reported in the literature. There data scattering in a
very narrow band around 10 Å
13,50−55
can be found, while in
ref 33, the authors obtained a= 9.983 Å for one sample,
mentioning that the lattice parameter depends on the
stoichiometry, but unfortunately the exact composition was
not reported. Even for a sample with crystallite sizes between
40 and 45 nm, awas determined to 10.008(1) Å.
50
We note
that the cubic lattice parameter ais significantly reduced at low
temperatures, from 9.9894(3) Å at 180 K to 9.9808(3) Å at 5
K.
48
In a further study, a decrease from 9.9813(3) Å (175 K)
to 9.9756(3) Å (10 K) was reported.
38
Increasing the annealing temperature of our samples has two
effects revealed by the XRPD patterns:
1.Thebroadbulgebelow∼30°in 2θdecreases
significantly in intensity and almost vanishes for the
800 °C sample, which is assigned to a reduction of
incoherently scattering defects.
2. As demonstrated for the 311 Bragg reflections (the right
side of Figure 1), increasing the annealing temperature
leads to a linewidth reduction, indicating an increase in
the sizes of coherently scattering domains.
This effect is also clearly seen in the parameters of fitted log-
normal distribution of the coherently scattering domains
(Figure 2). The mean particle size value μand the variance σ
vary continuously with the annealing temperature. Whereas μ
increases by more than a factor of 2, σdecreases as shown in
Figure 3. The volume weighted mean (Lvol) increases from 56
nm (500 °C) to 86 nm (600 °C) ending at 123 nm for the
sample heated at 800 °C.
The strain values ε0obtained from the Rietveld refinements
decrease with the annealing temperature from 7.4 ×10⁻⁴(500
Figure 1. Results of the Rietveld refinements of the powder patterns of the three samples. Bragg indices of some prominent reflections are given.
Black: collected data; red: refined data; and blue: difference curves. The vertical bars indicate the positions of Bragg reflections used to calculate the
patterns. The insets show an enlarged view of the 311 reflection.
Figure 2. Size distribution of the coherently scattering domains
analyzed from the XRPD patterns according to eq 3 as a function of
annealing temperature, as indicated. The shaded areas indicate log-
normal distributions with parameters given in the inset.
Figure 3. Mean value μand variance σof the log-normal distributions
(eq 3) of the coherently scattering domains as a function of annealing
temperature.
ACS Omega http://pubs.acs.org/journal/acsodf Article
https://doi.org/10.1021/acsomega.1c01412
ACS Omega 2021, 6, 13375−13383
13377
°C) to 1.8 ×10⁻⁴(600 °C) to finally reach 9 ×10⁻⁵for the
samples annealed at 800 °C. The smaller value for the lattice
parameter of the sample prepared at 500 °C may be caused by
thelargernumberofnanocrystallitescomparedtothe
materials heated at higher temperatures. In the literature,
mainly a lattice expansion was reported for oxides even for
particles larger than 100 nm,
56
while a lattice contraction was
observed for metallic nanoparticles.
57
However, there are also
observations that the lattice contracts with decreasing particle
size, e.g., for α-Fe2O3.
58
This phenomenon was explained by an
increased covalency of the Fe−O bond on the nanoscale.
Because the Cr−S and Fe−S bonds are much more covalent
than in oxides, we assume that the unit cell contraction is
based on a similar phenomenon.
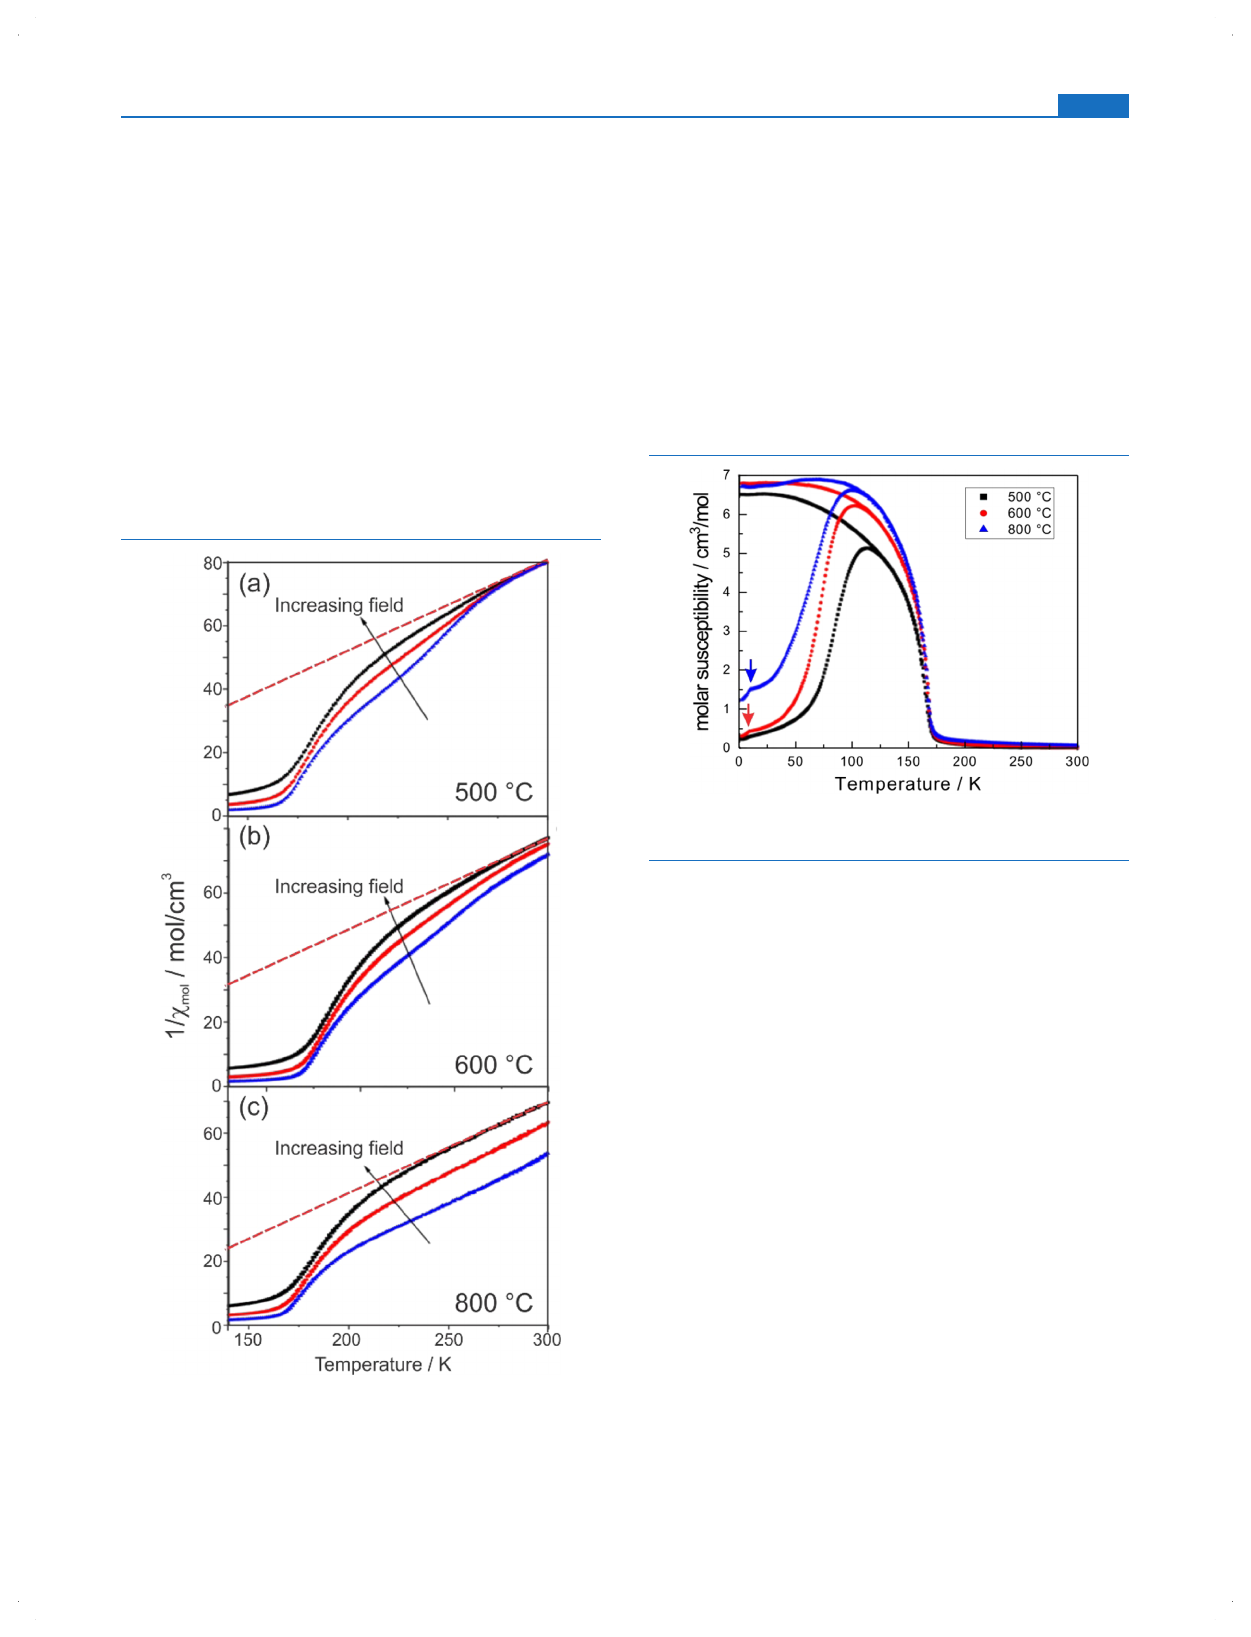
Magnetic Properties. Figure 4 displays the inverse
magnetic susceptibilities collected at 1, 2, and 4 T. At
sufficiently high temperatures and significantly above the Curie
temperature, the inverse susceptibilities converge to Curie−
Weiss behavior with the same slope for all three samples
similar to that observed by Gibart et al.
29
On approaching the
ferrimagnetic Curie temperature, the susceptibilities become
field-dependent with the largest field splitting seen for the 800
°C sample. We attribute this splitting to ferrimagnetic spin
clusters, which can be saturated with increasing field, leading to
an increase of the inverse susceptibilities with larger measuring
fields.
For all samples, a transition to the ferrimagnetic state is
determined at TC∼167 K, in agreement with the literature
where values between 177
29
and 167 K were reported.
30−32
Bifurcation of the zfc−fc data occurs at 120, 110, and 100 K
(Figure 5) for the samples prepared at 500, 600, and 800 °C,
respectively. Below the bifurcation, the zfc curves continuously
decrease and settle into a plateau below ∼25 K. A clear step-
like drop of the magnetic susceptibility occurs at ∼9 K for the
800 and 600 °C samples, which is caused by the long-range
orbital ordering as discussed in the literature. This anomaly is
less well developed for the sample prepared at 500 °C. The
decrease of the zfc susceptibility with decreasing temperature
can be attributed to microscopic modifications in the long-
range ordered magnetic structure and/or different magneto-
crystalline anisotropy due to varying amounts of structural
defects, affecting the temperature dependence of the domain
dynamics. Notable is the different behavior of the samples.
Whereas for the 800 °C sample, “melting”of the domain
structure on approaching from low temperatures starts at about
50 K, a sizeable increase of the zfc susceptibility of the 500 °C
sample begins only at about 75 K, indicating more effective
domain pinning. Below the bifurcation and before settling into
saturation, the fc susceptibilities pass through shallow maxima,
most pronounced for the 800 °C sample.
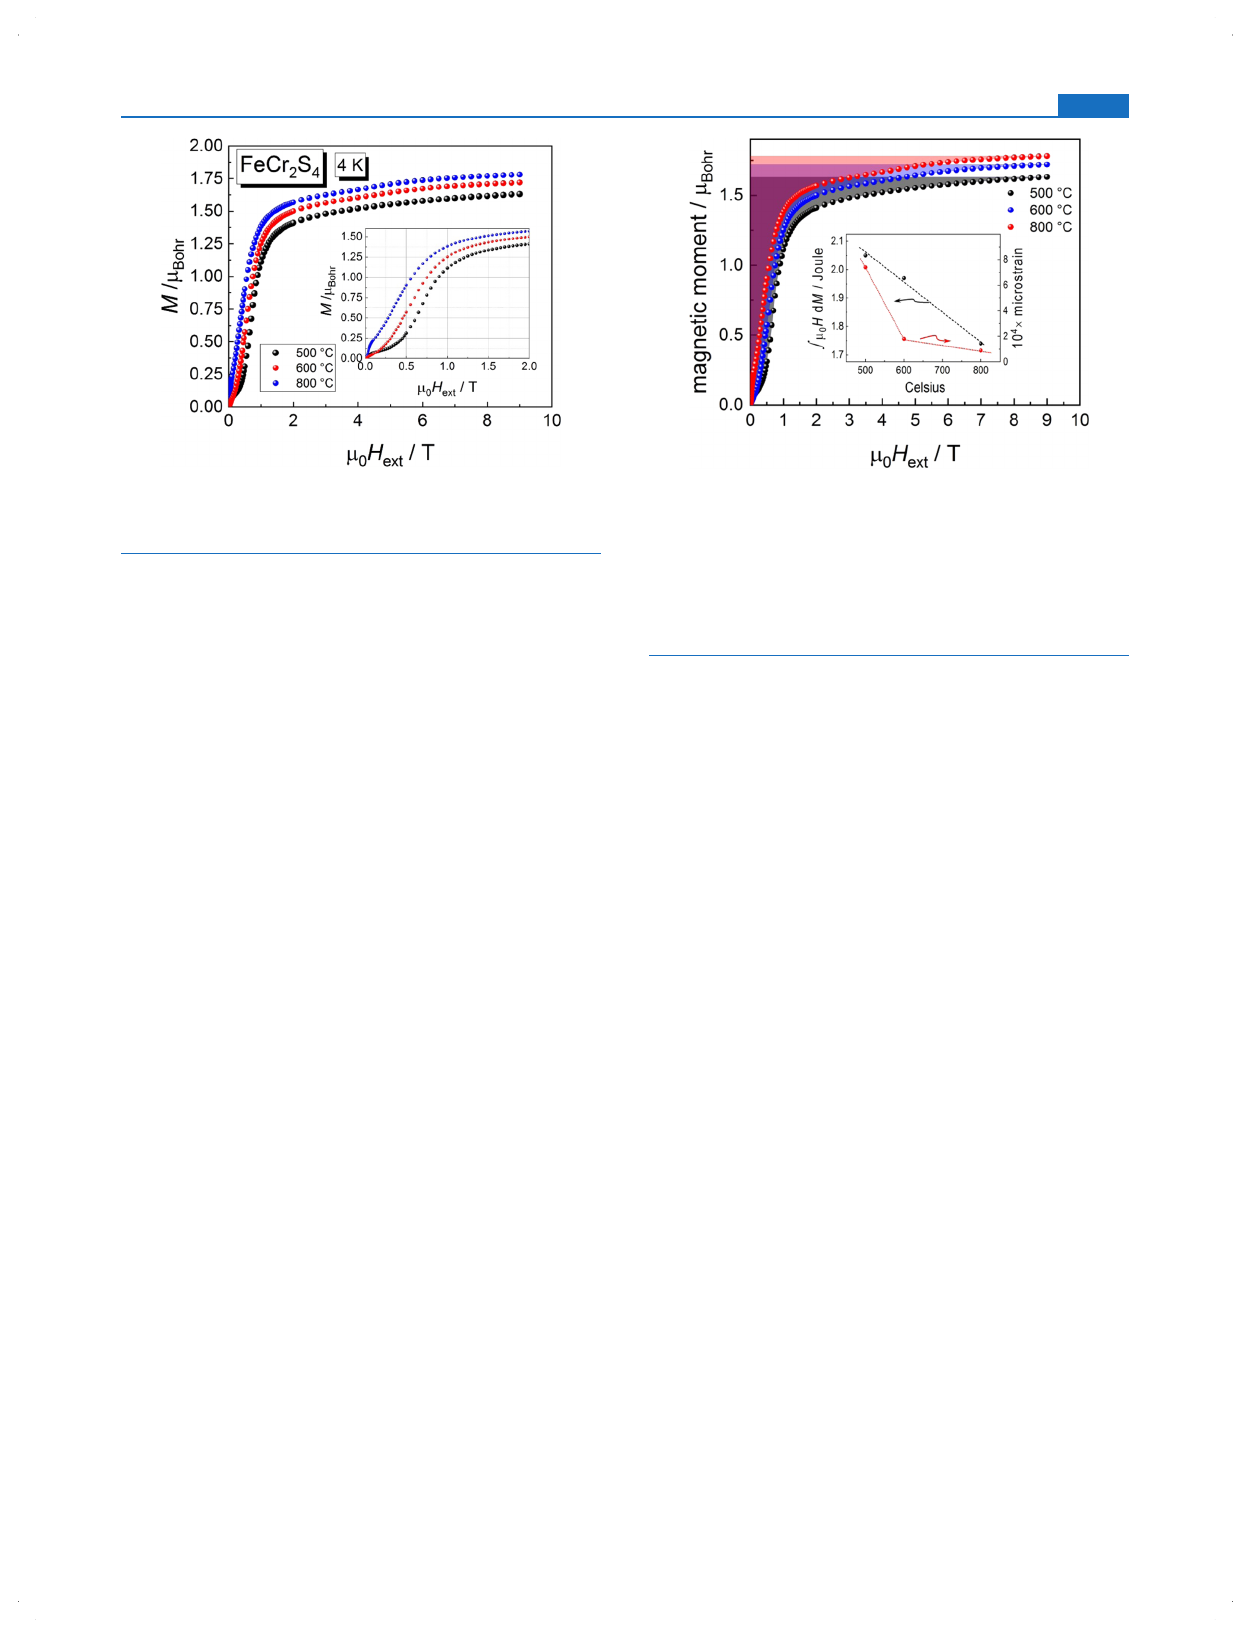
Figure 6 displays magnetization curves collected at 4 K in
external fields up to 9 T. The saturated moment increases with
the preparation temperature from 1.76 μB, 1.80 μB, to 1.83 μB
at 9 T for the 500, 600, and 800 °C samples, respectively. For
the collinear ferrimagnetic structure, a saturated magnetic
moment of 1.6 μBwas reported from high-magnetic-field
experiments.
43
DFT-based calculations predicted saturation
values of 2.0 μB
59
and 1.92 μB.
60
For polycrystalline
compounds, the data reported in the literature are, e.g., 1.55
μBgiven in ref 60 or ∼1.6 μBreported in refs 12,37. For the
Figure 4. Inverse molar magnetic susceptibilities of the three FeCr2S4
samples prepared at different temperatures: (a) 500 °C, (b) 600 °C,
and (c) 800 °C. Blue, red, and black colored traces refer to data
collected at 1, 2, and 4 T, respectively. The dashed lines indicate
Curie−Weiss laws approaching the high-temperature behavior of the
data collected at 4 T.
Figure 5. zfc−fc magnetic susceptibilities measured at 0.1 T. The
arrows mark the transition into the orbital ordered state at ∼9K.
ACS Omega http://pubs.acs.org/journal/acsodf Article
https://doi.org/10.1021/acsomega.1c01412
ACS Omega 2021, 6, 13375−13383
13378
samples investigated here, the values are noticeably larger but
do not fully reach the theoretically predicted values. The
increase of the magnetic moment with the annealing
temperature may be explained by reduced surface spin canting,
a smaller magnetic dead-layer and/or a reduced number of
defects on the Cr and Fe sublattices. One may speculate that
the larger values obtained here are caused by an imperfect
collinear magnetic structure, which may be due to microstrain
that is significantly reduced with increasing annealing temper-
ature (see above). We note that the saturation value of the
sample annealed at 800 °C matches that measured on a single
crystal for the <111> direction (1.84 μB), which is the hard
magnetic axis.
33
Also apparent from the magnetization curves is the
difference in the behavior at small fields where domain wall
motions are the prevailing process of magnetization. For the
800 °C sample, magnetization grows rapidly, whereas for the
500 °C sample, after a pedestal at low fields, the magnetization
increases with about the same slope as for the other samples.
The magnetization behavior reflecting domain wall motion at
low fields correlates with the magnitude of the microstrain
derived from the XRPD measurements. The different magnet-
ization versus field behavior at low temperatures can be
attributed to varying crystalline anisotropy energies for the
different samples.
The work W(M) done when magnetizing to a certain field
μ0His given by the area between the M−Hcurve and the
magnetization axis. It can be obtained by integration according
to
61
WM HM M() ( )d
M
0
∫
=′
′
(1)
For cubic crystals, the anisotropy energy is usually described
by the three anisotropy coefficients Ki(i= 0, 1, 2), which
weighs the products of even powers of the directional cosines
measured with respect to the distinguished magnetization axes
system. For a polycrystalline sample with a random orientation
of the crystallites with respect to the external field, the
anisotropy work Wcan only be taken as a qualitative measure
of the anisotropy energy. Integration of the area of the 4 K
magnetization curves, as indicated by the shaded areas in
Figure 7, indicates that the anisotropy energy (see the inset of
Figure 7) decreases with increasing preparation temperature by
about 15%, paralleling the decrease of the microstrain for
higher preparation temperatures. In addition, higher prepara-
tion temperatures appear to reduce imperfections in the
samples and the crystal anisotropy.
The magnetization of the samples was recorded at different
temperatures up to T= 175 K somewhat higher than TC
(Figure 8). As expected, the magnetic moment obtained at the
highest magnetic field decreases with increasing temperature.
But even at 175 K, the magnetization is not linear as expected
for a paramagnetic material, and a magnetic moment of ≈0.75
μBis observed for all samples, which is again an indication for
the presence of spin clusters, which survived at T>TC.
At sufficiently high fields (see Figure 8) in the regime where
magnetization processes by domain rotation (μ0H≳2T)
prevail, it has been found that the field dependence of the
magnetization provides information about the type of defects
in the sample (“law of approach”).
61−65
Generally, the
approach to saturation is expanded in a polynomial of powers
of the inverse magnetic field according to
M
HM a Ha H
aH
() (1 /( ) /( ) )
sat 1 020
2
00
μμ
μ
= − − − ···
+(2)
The coefficient a1is interpreted to describe inclusions and/
or microstress and a2is due to crystal anisotropy. At
temperatures well below the Curie temperature, the term
a0μ0H, which represents the field-induced increase in the
spontaneous magnetization of the domains or forced magnet-
ization, is usually very small and neglected. A plot of the
magnetization of the three FeCr2S4samples as a function of
inverse external field (Figure 8), 1/μ0H, shows that the
magnetizations at 4 K for very high fields follow very well
straight lines with no significant slope change. Considering the
field range from 0.5 to 9 T and fitting the experimental data to
eq 2 reveals that the deviations toward lower fields can be
favorably taken care of by additionally considering the term ∝
1/(μ0H)2, as displayed in Figure 9.
Figure 6. Magnetization at 4 K of the three samples prepared at 500,
600, and 800 °C, as indicated. The inset displays an enlarged view of
the low-field regime.
Figure 7. Magnetic moment per fu as a function of external magnetic
field at 4 K. The shaded areas highlight the integral ∫μ0HdM′. The
inset displays the integral ∫0
Msatμ0H(M′)dM′(black dots) correspond-
ing to the color shaded areas in the main frame and the microstrain
(red dots, see the text above) as a function of preparation
temperatures of the three samples prepared at the temperatures, as
indicated. The dashed and dotted lines in the inset are guides to the
eye.
ACS Omega http://pubs.acs.org/journal/acsodf Article
https://doi.org/10.1021/acsomega.1c01412
ACS Omega 2021, 6, 13375−13383
13379
Loading more pages...