
crystals
Article
Investigation of Elastic Properties of the Single-Crystal
Nickel-Base Superalloy CMSX-4 in the Temperature Interval
between Room Temperature and 1300 ◦C
Alexander Epishin 1,*, Bernard Fedelich 2,*, Monika Finn 2, Georgia Künecke 2, Birgit Rehmer 2, Gert Nolze 2,
Claudia Leistner 3, Nikolay Petrushin 4and Igor Svetlov 4
Citation: Epishin, A.; Fedelich, B.;
Finn, M.; Künecke, G.; Rehmer, B.;
Nolze, G.; Leistner, C.; Petrushin, N.;
Svetlov, I. Investigation of Elastic
Properties of the Single-Crystal
Nickel-Base Superalloy CMSX-4 in
the Temperature Interval between
Room Temperature and 1300 ◦C.
Crystals 2021,11, 152. https://
doi.org/10.3390/cryst11020152
Academic Editors: Ronald
W. Armstrong and Dmitry Lisovenko
Received: 26 December 2020
Accepted: 26 January 2021
Published: 2 February 2021
Publisher’s Note: MDPI stays neutral
with regard to jurisdictional claims in
published maps and institutional affil-
iations.
Copyright: © 2021 by the authors.
Licensee MDPI, Basel, Switzerland.
This article is an open access article
distributed under the terms and
conditions of the Creative Commons
Attribution (CC BY) license (https://
creativecommons.org/licenses/by/
4.0/).
1Faculty III Process Sciences, Institute of Material Sciences and Technology, Chair of Metallic Materials,
Technische Universität Berlin, Sekr. BH18, Ernst-Reuter-Platz 1, 10587 Berlin, Germany
2
Department of Materials Engineering, Federal Institute for Materials Research and Testing (BAM), Unter den
3Institute Applied Materials, Helmholtz-Zentrum Berlin, for Materials and Energy, Hahn-Meitner-Platz 1,
4All-Russian Institute of Aviation Materials (VIAM), Radio Str. 17, 105005 Moscow, Russia;
*Correspondence: [email protected] (A.E.); [email protected] (B.F.);
Tel.: +49-(0)30-314-78981 (A.E.); +49-(0)30-8104-3104 (B.F.)
Abstract: The elastic properties of the single-crystal nickel-base superalloy CMSX-4 used as a blade
material in gas turbines were investigated by the sonic resonance method in the temperature interval
between room temperature and 1300
◦
C. Elastic constants at such high temperatures are needed to
model the mechanical behavior of blade material during manufacturing (hot isostatic pressing) as
well as during technical accidents which may happen in service (overheating). High reliability of
the results was achieved using specimens of different crystallographic orientations, exciting various
vibration modes as well as precise measurement of the material density and thermal expansion
required for modeling the resonance frequencies by finite element method. Combining the results
measured in this work and literature data the elastic constants of the
γ
- and
γ0
-phases were predicted.
This prediction was supported by measurement of the temperature dependence of the
γ0
-fraction.
All data obtained in this work are given in numerical or analytical forms and can be easily used for
different scientific and engineering calculations.
Keywords: nickel-base superalloys; single-crystals; characterization; elastic constants
1. Introduction
Blades of the hot section of gas turbines operate under severe service conditions
including high temperatures, different mechanical loads, and an aggressive environment.
In order to achieve the required service properties, the blades are solidified as single-
crystals of nickel-base superalloys [
1
,
2
]. The excellent mechanical properties of nickel-base
superalloys at high temperatures are provided by their two phase microstructure: The
γ
-solid solution of nickel strengthened by the
γ0
-precipitates, a phase on the base of the
intermetallic compound Ni
3
Al. Single-crystal blades are critical structural components of a
gas turbine which determine the efficiency and reliability of the whole assembly. Therefore,
the lifetime of turbine blades has to be reliably predicted by rigorous engineering calcula-
tions, which includes modeling the mechanical behavior of a blade material. Two types of
mechanical models can be applied for this purpose: The models treating a blade material
as a homogeneous continuum [
3
–
5
] and the advanced physically-based models explicitly
considering the two phase
γ
/
γ0
-microstructure of nickel-base superalloys [
6
–
10
]. In partic-
ular, models of the last type have been developed to predict microstructural evolutions at
Crystals 2021,11, 152. https://doi.org/10.3390/cryst11020152 https://www.mdpi.com/journal/crystals

Crystals 2021,11, 152 2 of 18
high temperatures like rafting [6,7,9,10]. Both types of models require numerous material
parameters, the first models at a macroscopic level, that is the parameters of a material as
a whole, and the second models at a microscopic level, that is separately the parameters
of the constituent
γ
- and
γ0
-phases. This set of mechanical parameters also includes the
characteristics of elasticity, which in the case of cubic crystals of nickel-base superalloys is
described by three elastic constants, usually by the elastic stiffnesses c11,c12, and c44.
It is important to adequately characterize the elastic properties of nickel-base superal-
loys because they are highly anisotropic. For example, in [
11
] the elastic properties of the
single-crystal superalloy GS6F were reported. It was found that at room temperature (RT),
the Zener factor of anisotropy
A=
2
c44/(c11 −c12)
is equal to about 2.5, while Young’s
modulus
Ex
and shear modulus
Gxy
change by a factor of about 2.2 depending on x- and y-
directions with minimum for
Eh001i
and
Gh011ih011i
, and maximum for
Eh111i
and
Gh001ihhk0i
,
(Gh001ihhk0i, is independent of hhk0i). The most anisotropic characteristic is Poisson’s ratio
νxy
, which even inverts its sign changing from the maximum value
νh011ih100i
= +0.65 to the
minimum value
νh011ih011i
=
−
0.06 [
12
]. A detailed analysis of the extreme values of the
Poisson ratio of cubic crystals can be found in [13].
Under normal service conditions, the maximum operating temperature of blade ma-
terial does not exceed 1150
◦
C, therefore the elastic constants of nickel-base superalloys
are usually measured at temperatures up to this limit [
13
–
17
]. However, in some specific
cases, the elastic constants at higher temperatures are needed. One such case is modeling
technical accidents when the blade material can experience a short
γ0
-solvus overheat-
ing [
18
]. Another case is modeling hot isostatic pressing (HIP) [
19
,
20
] which is performed
in a temperature window between the
γ0
-solvus and solidus where the strengthening
γ0
-phase is totally dissolved and therefore the superalloy is very soft [
21
]. Such modeling
activities need elastic constants at temperatures up to about 1300
◦
C. Therefore, the first
objective of our work was measuring the macroscopic elastic constants of the single-crystal
nickel-base superalloy CMSX-4 in a temperature interval between RT and 1300 ◦C.
As mentioned above, the advanced physically-based models for the mechanical behav-
ior of single-crystal nickel-base superalloys require microscopic elastic constants separately
for the
γ
- and
γ0
-phases. Knowledge of these microscopic parameters is also of academic
interest, namely for understanding the phenomenon of rafting the initially cuboidal
γ0
-
precipitates that occurs in superalloy under high temperature creep conditions. This
phenomenon was first considered by Tien and Copley [
22
] and then investigated in many
publications, e.g., analytically by Pineau [
23
] or by means of transmission electron mi-
croscopy (TEM) by Svetlov et al. [
24
]. Nabarro [
25
] reviewed available publications on
rafting and proposed the “elastic concept for rafting”, which predicts the direction of
γ0
-rafting depending on the sign of the product
m×δ
, where
δ
is the misfit of
γ
- and
γ0
-lattice spacing and
m
is the misfit of the elastic moduli of the
γ
- and
γ0
-phases. Nabarro
defined mas:
m=(Mp−Mm)
0.5 (Mp+Mm)(1)
where
M=c11 −c12
. From here and below we will use the superscripts “m” and “p”
respectively for the
γ
-matrix and
γ0
-precipitates. According to this elastic concept for
rafting during creep under uniaxial
h
001
i
tensile loading the
γ0
-phase forms rafts normal
to load axis (N-rafting) if
m×δ
< 0 and rafts parallel to load axis (P-rafting) if
m×δ
> 0.
N-rafting is usually observed in Ni-base alloys where
δ
< 0 [
26
,
27
], while P-rafting is often
observed in Co-base alloys where
δ
>0[
28
,
29
]. Many experimental efforts were made to
clarify the sign of
m
for nickel-base superalloys [
16
,
30
–
34
]. However, until now there is
no full agreement about this point in the literature. Therefore, the second objective of this
work is the prediction of the elastic properties of the
γ
- and
γ0
-phases of CMSX-4 as well as
sign(m).
The determination of the macroscopic and microscopic elastic constants requires
certain material parameters, such as the density and temperature dependencies of thermal

Crystals 2021,11, 152 3 of 18
expansion and volume fraction of
γ0
-phase. Therefore, the third objective of this work was
the precise measurements of these characteristics for superalloy CMSX-4.
2. Materials and Methods
2.1. Investigated Specimens
The investigated material was the single-crystal nickel-base superalloy CMSX-4 [
35
]
developed by Cannon-Muskegon, Muskegon, USA and is widely used as blade material
for aircraft jet engines and land-based gas turbines. The single-crystals of different crystal-
lographic orientations were solidified by Doncasters Precision Castings (DPC), Bochum,
Germany, and were fully heat treated and used for different experiments performed in this
work. For measurement of the elastic constants, 3 plate-shaped, rectangular specimens
were cut by spark erosion. The plate-shaped beams were 3 mm thick, 8 mm wide, and 80
mm long, and had the following orientations: 1st beam-axial [001] with side faces (100) and
(010); 2nd beam-axial [011] with wide and narrow side faces respectively (100) and (01
1
);
and 3rd beam-axial [111] with wide and narrow side faces respectively (
2
11) and (01
1
). The
exact crystallographic orientations (Euler angles) of the specimens were measured by two
methods: X-ray diffraction (XRD), the Laue method, and by a metallographic method, as
described in ([
2
] chapter 4.4). The metallographic method is based on an analysis of the
orientation of dendritic structure visualized on the specimen surface by macro etching. An
advantage of this method is that the orientation can be examined across the entire surface
of the specimen. As was shown in [21], the difference between the results of XRD and the
metallographic method is within 1–3
◦
, which is comparable with the misorientation of
subgrains in “technical single-crystals” of nickel-base superalloys, see e.g., [36,37].
2.2. Measurement of Elastic Constants
The elastic constants of heat treated CMSX-4 have been determined by the sonic
resonance (SR) method developed by Förster [38]. The principle of the SR method and its
application to isotropic materials is described in detail in the ASTM E1875 standard [
39
].
The SR-measurements have been performed under vacuum in a testing device Elastotron
2000 HTM, Reetz, Berlin, Germany at temperatures between 24
◦
C and 1300
◦
C. The holding
times varied from 5 min to 20 min depending on the temperature. A special measurement
temperature was 1280
◦
C because it is the
γ0
-solvus temperature of CMSX-4. Therefore, at
1280 ◦C and 1300 ◦C the elastic constants of the γ-matrix of CMSX-4 were measured.
The frequency spectra of different flexural and torsional vibration modes were reg-
istered in the range between 1 kHz and 70 kHz. Harmonics of the orders between 4th
and 7th were excited depending on the vibration mode, the specimen orientation, and
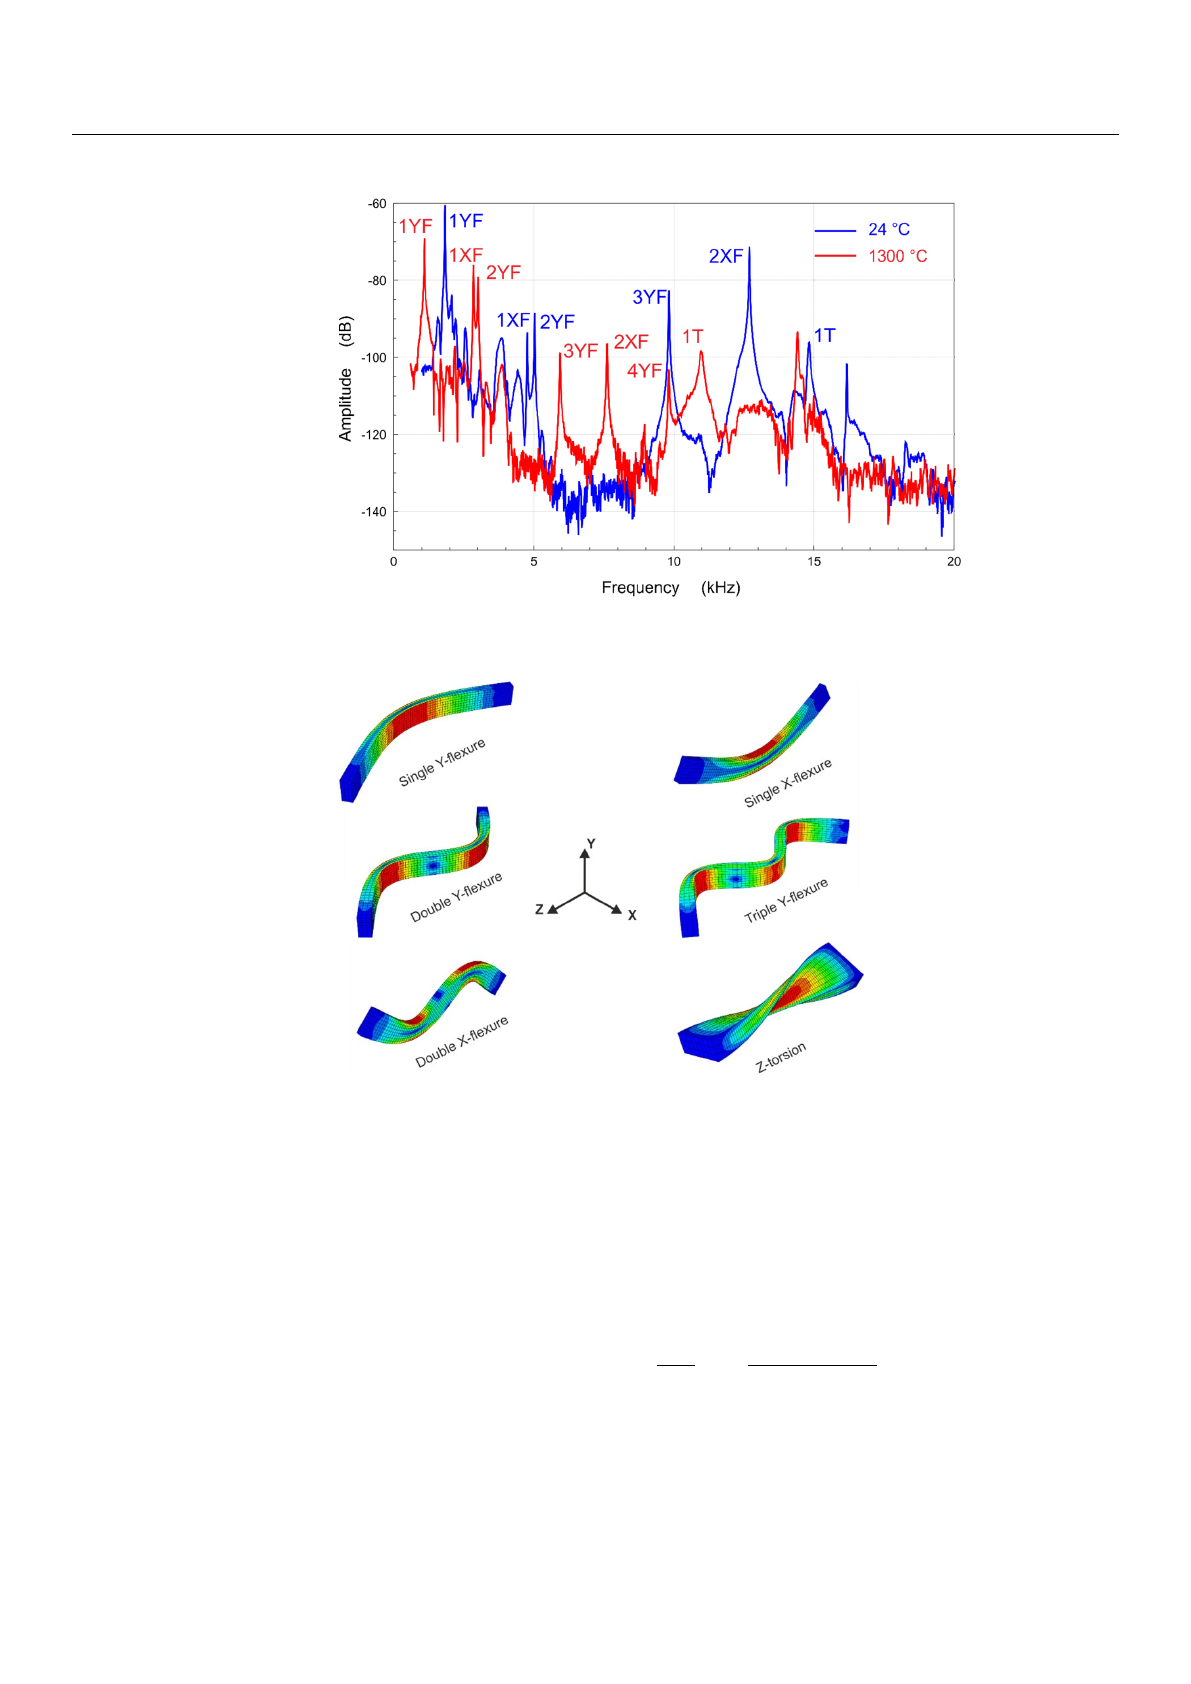
temperature. Figure 1shows an example of the lower parts (1–20 kHz) of the frequency
spectra measured for the [001] beam of CMSX-4 at 24 and 1300 ◦C.
An interpretation of the resonance frequency peaks is possible by solving the eigen-
value problem for free dynamic vibrations with given elastic constants. For example, the
computed resonance modes for the [001] specimen at 24
◦
C are shown in Figure 2. Note
that at 24
◦
C, the 6th resonance peak is due to the first torsional mode, while at 1300
◦
C the
first torsional mode corresponds to the 7th peak (see Figure 1).
In the case of isotropic materials, closed-form solutions for the eigenfrequencies can
be applied to estimate the elastic constants from the resonance peaks (see e.g., [
39
]). Since
shear and bending modes are generally coupled for anisotropic materials, sufficiently
accurate analytical estimates of the eigenfrequencies are not available for arbitrary oriented
crystals. Therefore, in this work the eigenfrequencies have been calculated by finite element
analysis (FEA, see, e.g., [40]) and with the Abaqus FE code [41].
Crystals 2021,11, 152 4 of 18
Crystals 2021, 11, x FOR PEER REVIEW 4 of 19
Figure 1. Lower parts (1–20 kHz) of frequency spectra measured from the [001] beam of CMSX-4
at 24 and 1300 °C. T-torsional peaks, and Y- and X-flexural peaks.
Figure 2. The first six resonance modes of the [001] beam at 24 °C.
The Lanczos solver of Abaqus has been applied to compute the eigenfrequencies of
the freely oscillating beams. A mesh made of 3 × 8 × 80 = 1920 quadratic elements (20 nodes,
Abaqus type C3D20) was found to ensure a relative accuracy better than 5 × 10
–4
for the
computed eigenfrequencies. The mesh can be also seen in Figure 2. The unknown elastic
constants 𝑝=𝑐,𝑐,𝑐 were determined by minimizing the sum 𝑅(𝑝) of the
squares of the deviations between measured and calculated peak frequencies (Least Square
Method), that is,
𝑅(𝑝)=1
2 𝑁
𝑓
(𝑝)−
𝑓
𝑓
(2)
Figure 1. Lower parts (1–20 kHz) of frequency spectra measured from the [001] beam of CMSX-4 at
24 and 1300 ◦C. T-torsional peaks, and Y- and X-flexural peaks.
Crystals 2021, 11, x FOR PEER REVIEW 4 of 19
Figure 1. Lower parts (1–20 kHz) of frequency spectra measured from the [001] beam of CMSX-4
at 24 and 1300 °C. T-torsional peaks, and Y- and X-flexural peaks.
Figure 2. The first six resonance modes of the [001] beam at 24 °C.
The Lanczos solver of Abaqus has been applied to compute the eigenfrequencies of
the freely oscillating beams. A mesh made of 3 × 8 × 80 = 1920 quadratic elements (20 nodes,
Abaqus type C3D20) was found to ensure a relative accuracy better than 5 × 10
–4
for the
computed eigenfrequencies. The mesh can be also seen in Figure 2. The unknown elastic
constants 𝑝=𝑐,𝑐,𝑐 were determined by minimizing the sum 𝑅(𝑝) of the
squares of the deviations between measured and calculated peak frequencies (Least Square
Method), that is,
𝑅(𝑝)=1
2 𝑁
𝑓
(𝑝)−
𝑓
𝑓
(2)
Figure 2. The first six resonance modes of the [001] beam at 24 ◦C.
The Lanczos solver of Abaqus has been applied to compute the eigenfrequencies of
the freely oscillating beams. A mesh made of 3
×
8
×
80 = 1920 quadratic elements (20
nodes, Abaqus type C3D20) was found to ensure a relative accuracy better than 5
×
10
–4
for the computed eigenfrequencies. The mesh can be also seen in Figure 2. The unknown
elastic constants
{pi}={c11,c12,c44 }
were determined by minimizing the sum
R(pi)
of
the squares of the deviations between measured and calculated peak frequencies (Least
Square Method), that is,
R(pi)=
3
∑
s=1
1
2Ns
Ns
∑
n=1 fFE
sn (pi)−fExp
sn
fExp
sn !2
(2)
where
Ns
is the number of considered resonance modes for the specimen
s
,
fExp
sn
the
nth
measured resonance frequency of the same specimen, and
fFE
sn (pi)
is the corresponding
computed eigenfrequency. It should be stressed that the three tested specimens are con-
sidered in the sum of the deviations in Equation (2). The use of specimens of different
orientations as well as a large number of vibration modes is necessary to improve the
reliability of the results. However, with increasing order and temperature the identification
Crystals 2021,11, 152 5 of 18
of the resonance peaks becomes increasingly uncertain, which in practice limits the number
of available experimental resonance frequencies. As a rule, all resonance peaks up to
the first torsional mode have been taken into account in the objective function R(p
i
). In
accordance, the first 6 or 7 modes and the first 4 modes have been considered in the case of
the [001] specimen, respectively in the case of the [011] and [111] specimens. An exception
was the [011] specimen at 1300
◦
C, for which the 4th resonance peak could not be identified
with certainty.
To assess the reliability of these results, the influence of imprecisions concerning
the specimen orientations was investigated by applying perturbations to the specimen
orientations. More specifically, additional rotations of 2
◦
around a random axis were
applied to each specimen. It was found that such perturbations induced an average relative
error equal to 0.5% for c44, 2% for c11, and 4% for c12.
2.3. Measurement of Material Density and Thermal Expansion
The calculation of the resonance frequencies needs the material density
ρ(T)
at in-
vestigated temperatures. Therefore, the density of CMSX-4 at RT and the linear thermal
expansion (LTE)
εT(T)
were carefully measured. The density
ρ(RT)
was measured by
the Archimedes method, i.e., weighting the specimen in air and water. The specimens
for density measurement were machined in cylindrical shape with a diameter of 18 mm,
length of 45 mm, and a mass of about 100 g. Such massive specimens with a small ratio
surface/volume are preferable for density measurements. To avoid gas bubbles attach-
ing to the specimen surface during measurements in liquid, the corners of the cylinders
were rounded and the surface polished very carefully. During the measurements, the
temperature of air and water varied within
±
0.1
◦
C. The precision balance used, a Sartorius
R160D, has an accuracy of 0.01 mg. The measurements gave the following density value
ρ(23 ◦C) = 8.72 ±0.01 g/cm3.
The LTE of CMSX-4 was measured under vacuum in a dilatometer DL 1500, Ul-
vac Sinku-Riko, Japan in the temperature range between 20 and 1310
◦
C. The measured
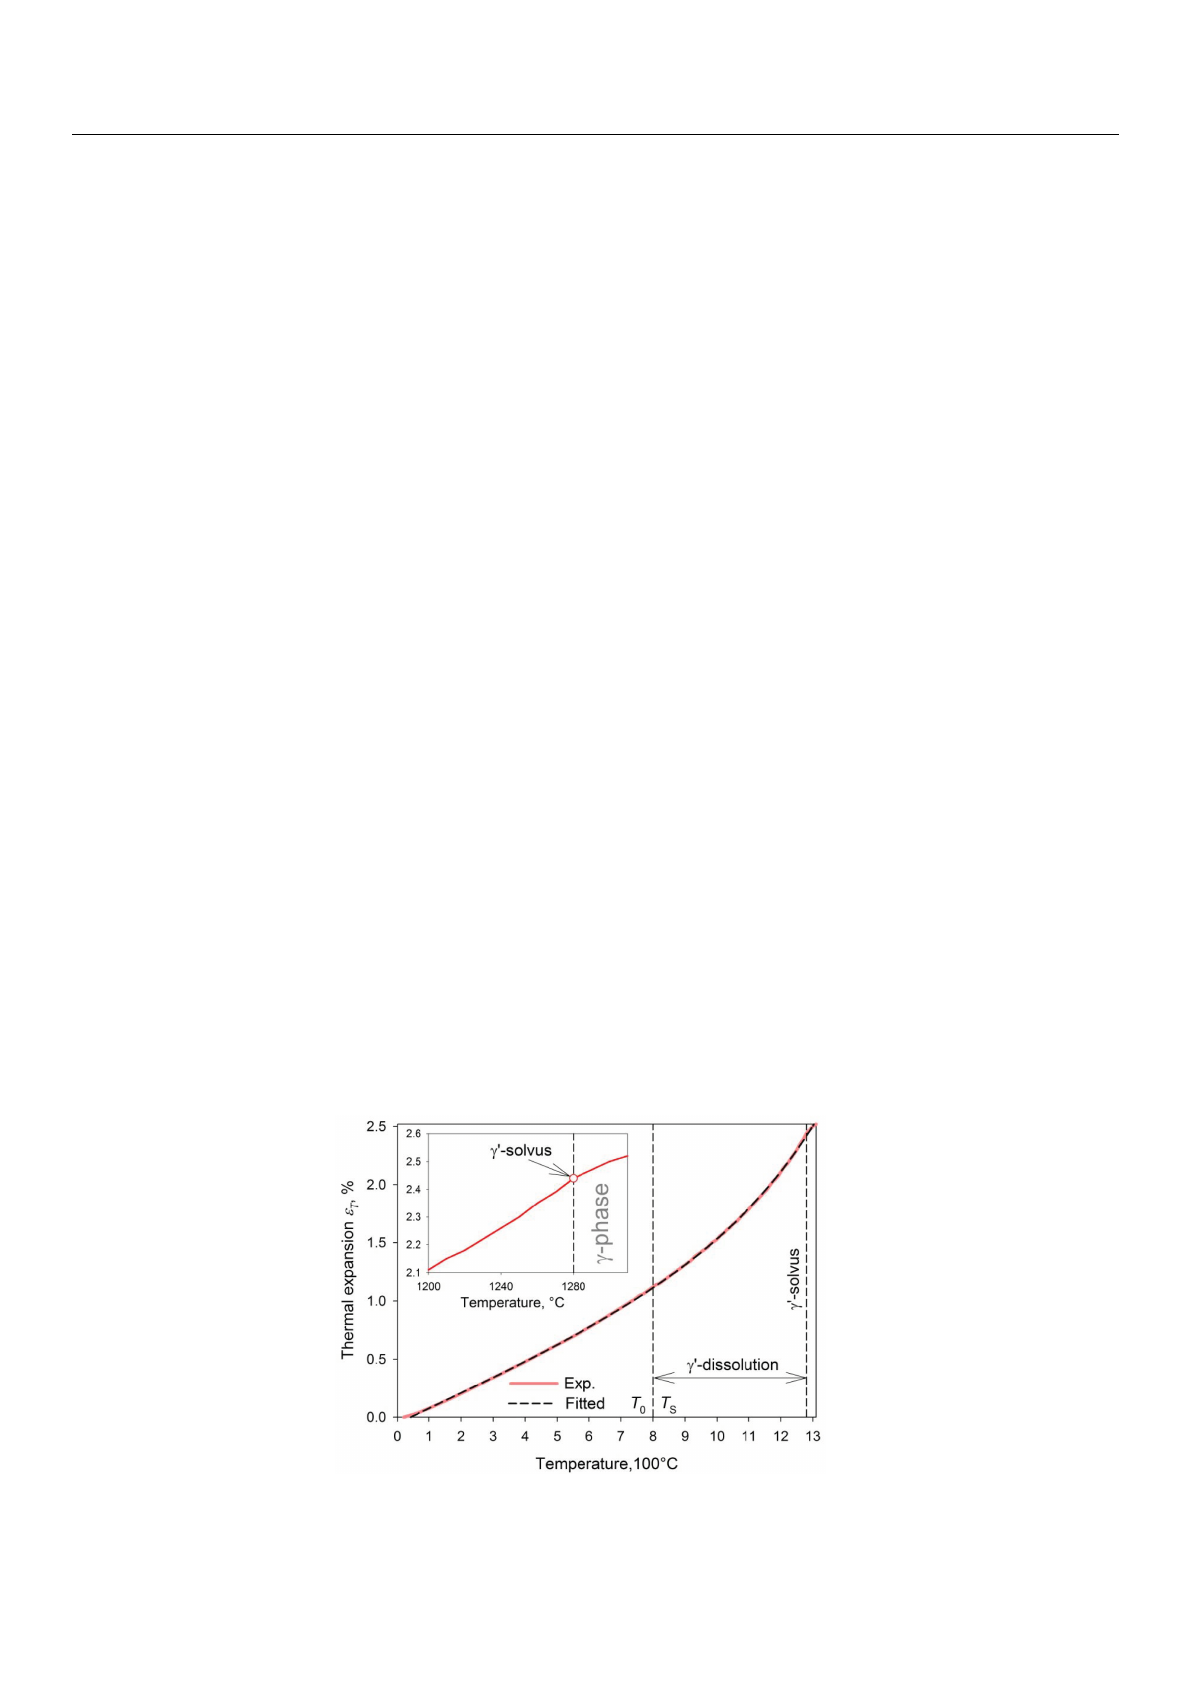
dependence εT(T)shown in Figure 3is well approximated by Equation (3):
εT(T)=a+b T +cexp(d T), (3)
where a=
−
6.66
×
10
−4
;b = 1.24
×
10
−5
,
◦
C
−1
;c = 1.34
×
10
−4
, and d = 3.28
×
10
−3
,
◦
C
−1
.
The γ0-solvus temperature of CMSX-4 determined by a kink point in the curve εT(T)was
found to be
TS
= 1280
±
2
◦
C, see insert in Figure 3. The temperature change of density was
calculated as ρ(T)=ρ(RT)/[1+εT(T)]3. Raw data for εT(T)are given in Appendix A.
Figure 3.
Thermal expansion of CMSX-4. The red solid line is the measured dilatometric curve and
the black dashed line is the approximation with Equation (3). Kink of the dilatometric curve shown
in the insert indicates the γ0-solvus temperature of CMSX-4 equal to 1280 ◦C.
Loading more pages...