
Investigation on Process Stability and Part Positioning
Influence on the Relative Density of Designed Materials
via Laser-Based Powder Bed Fusion of Metals on a Multi-
Laser Machine
Johannes Albert,* Oliver Hermann, Simon Purschke, David Rule, and Claudia Fleck
1. Introduction
Large gas turbines (LGTs) play an impor-
tant role in a challenging energy market,
which is going through a transition from
using mostly fossil fuels to sustainable
and renewable resources.
[1,2]
From one
side, LGT’s main advantage is based on
the high efficiencies of up to 65% in a com-
bined cycle.
[2]
The hot exhausts of the gas
turbine run an additional steam turbine.
[2]
As result, significantly lower carbon emis-
sions in the exhausts are achieved, if com-
pared with other fossil technologies such as
coal-fired power plants.
[2]
As the LGT effi-
ciency is directly connected to the highest
temperature in the thermodynamic cycle,
the combustion performance has to be
improved.
[3]
In contrast, hydrogen is estab-
lished as an alternative fuel for LGTs
because there is an increasing demand
for a more sustainable and fast-reacting
energy supply.
[1]
Introducing hydrogen as
a fuel leads to rising combustion temperatures.
[1]
In both cases
—enhancing efficiency and using hydrogen as an alternative
fuel—the resulting highest temperature within the LGT is dramat-
ically affected.
[1,3]
Current developments point out that the combustion chamber
and its components are submitted to temperatures up to
2000 K.
[4,5]
This highlights the substantial necessity of effective
cooling concepts and designs.
[4,5]
One of the most efficient ways
is via transpiration cooling.
[5,6]
The main characteristic of this
cooling method is a porous wall through which a coolant agent
flows—compressed air in case of LGTs.
[5,6]
By streaming air
from the cold to the hot gas side, a protective film cooling the
hot component surface is generated.
[5,6]
Additive manufacturing (AM) and especially laser-based pow-
der bed fusion of metals (PBF-LB/M) can generate complex
geometries out of high temperature alloys.
[1]
This makes it
suitable for manufacturing components in high temperature
applications.
[1]
Next to geometrical defined drillings or lattice
structures, process adaptions form an approach for producing
open-porous media by PBF-LB/M.
[7–18]
The concept of designed materials (DMs) is based on manip-
ulating the standard PBF-LB/M process to create open-porous
J. Albert, O. Hermann, D. Rule
Additive Manufacturing Materials and Technology
Siemens Energy
Huttenstr. 12, 10553 Berlin, Germany
E-mail: albert.johannes@siemens-energy.com
S. Purschke
Design for Additive Manufacturing
Siemens Energy
Huttenstr. 12, 10553 Berlin, Germany
C. Fleck
Materials Science & Engineering
Institute of Technology Berlin
Straße des 17. Juni 135 –Sekr. EB 13, 10623 Berlin, Germany
The ORCID identification number(s) for the author(s) of this article
can be found under https://doi.org/10.1002/adem.202100635.
© 2021 The Authors. Advanced Engineering Materials published by Wiley-
VCH GmbH. This is an open access article under the terms of the Creative
Commons Attribution-NonCommercial-NoDerivs License, which permits
use and distribution in any medium, provided the original work is properly
cited, the use is non-commercial and no modifications or adaptations are
made.
DOI: 10.1002/adem.202100635
Component production via laser-based powder bed fusion of metals (PBF-LB/M)
is becoming reality for multiple applications. Especially for sophisticated parts, as
in case of gas turbines, assurance of repeatable properties involves control of
process and machine parameters. PBF-LB/M is used to build configurable open-
porous structures—designed materials (DMs)—out of the high temperature
superalloy Haynes 282 with relative densities from 35% to 65%. The objective is
investigating positioning influence and process stability based on their relative
densities in discrete scan fields and build jobs. As DMs made from Haynes 282
are not yet scientifically investigated, first the process boundaries are identified.
The used PBF-LB/M machine—EOS M 400-4—works with four lasers in four
quadrants—a quadrant benchmarking is carried out. The experiment is repeated
in a second build job. Scatter is identified in quadrant and build job benchmarking.
A further aspect under investigation is positioning within laser quadrants.
However, keeping laser and parameter combinations constant, sample locations
are assessed. A relative density dependency on the laser deflection angle—as a
positional measure—is observed. The results of positioning influence and scatter
are used to formulate a tolerance equation for relative densities of DMs.
RESEARCH ARTICLE
www.aem-journal.com
Adv. Eng. Mater. 2022,24, 2100635 2100635 (1 of 11) © 2021 The Authors. Advanced Engineering Materials published by Wiley-VCH GmbH

structures.
[7–18]
This can be achieved by either adapting powder
stock or process parameters.
[7–18]
Additives can be used to estab-
lish open-porous structures in the PBF-LB/M process.
[15,16]
Chemical compounds use the applied laser energy in the process
for a gas-generating reaction within the melt pool and therein
produce pores.
[15]
Another option are salts that act as place
holders.
[16]
After printing, they can be removed in a subsequently
leach-out step—pores remain.
[16]
Other approaches focus on
standard PBF-LB/M process parameters, which can be set
individually.
[7–14,17,18]
They generate adjustable open-porous
structures by decreasing the introduced line and volume
energy.
[7–14,17,18]
For this purpose, decreasing the laser power,
or increasing the scan speed, hatch distance, or layer thickness
are setting options.
[7–14,17,18]
Some authors report the additional
use of pulsed lasers or changes in scan strategies for achieving
similar results.
[7,11]
The described methods for introducing pores
into the PBF-LB/M components have been showed for different
materials. Titanium alloys, tool steels, stainless steels, and
nickel-based superalloys—IN625, IN718, EP648, and Hastelloy
X—have been analyzed.
[7–14,17,18]
The nickel-based superalloy Haynes 282—UNS N07208
(Ni-20Cr-10Co-8.5Mo-1.5Al-2.1Ti)—is a material with high tem-
perature strength and good processability.
[19]
It is an ideal can-
didate for static components in aircrafts and land-based gas
turbines.
[19]
With precipitation strengthening from 24%
gamma prime, it is considered the successor of choice of the
solid solution strengthened materials used today.
[20]
Bulk
PBF-LB/M processes for Haynes 282 have showed that the
material is additively manufacturable and has promising process
stability.
[21,22]
Haynes 282 as a material for open-porous
structures–intended pores by PBF-LB/M process parameter
adaptions-have not been scientifically investigated, yet.
Therefore, the process parameter boundaries and the process sta-
bility were not examined, as well.
In addition to the manufacturing challenges in processing
highly porous materials, their functional behavior for applica-
tions like transpiration cooling has been investigated by flow
tests.
[7]
It has been stated that the morphological properties have
a major influence on the flow behavior.
[7,8,18,23]
In terms of LGT application, DMs are of increasing interest due
to the possibility to manufacture open-porous structures and bulk
material simultaneously.
[7]
They offer the perspective to increase
the efficiency and lower the emissions by introducing transpira-
tion cooling.
[7]
For the implementation into commercial products,
however, some essential aspects need to be investigated. Possible
shortcomings, such as the repeatability of morphological proper-
ties, must be mitigated. The necessity for such assessment is
underlined by investigations which have showed positioning influ-
ences-in build layer dimension-on surface roughness and the melt
pool geometry.
[24,25]
Furthermore, nonadjustable parameters such
as the shielding gas flow or plume generation might influence the
repeatability of parts built with lower energy parameter sets.
[26,27]
As analyzed for different materials in various studies, morpho-
logical DM properties can be manipulated by varying settings for
layer thickness, laser power, scan speed and hatch distance. DM
process development has not yet been carried out for Haynes 282.
An initial experiment provides a range of feasible process param-
eter settings for an EOS M 400-4 PBF-LB/M machine (EOS
GmbH, Krailling/Munich, Germany). For the research standard,
powder feedstock was utilized. The system used for the investiga-
tion is not capable of operating in pulse modus for the four laser
beams, hence this variable has been excluded. Instead, feasible
ranges of laser power, scan speed, hatch distance, and layer thick-
ness are in focus. The aim of this study is to assess the repeatability
of DMs regarding relative density. For this, an influence study of
part positioning and a benchmarking of the laser quadrants have
been conducted. The laser deflection angle (LDA) as a positional
measure might generate an understanding if mechanisms which
affect the melt pool geometry are present for DMs, as well. The
results have shown a dependence of the relative density on the
LDA and non-negligible scatter, which both have been used to for-
mulate a relative density tolerance equation.
2. Experimental Section
2.1. Materials
Commercial Haynes 282 inert gas atomized metal powder
TruForm (Praxair Surface Technologies, Inc., Indianapolis,
USA) has been used as feedstock. Sieve analysis per ASTM
B214 revealed that none of the analyzed powder particles were
bigger than 53 μm in size. The powder particle size distribution
was determined by laser diffraction analysis per ASTM B822.
This investigation revealed that the powder had a D10 of
22.2 μm, D50 of 31.0 μm, and D90 of 45.6 μm.
2.2. Process
2.2.1. Multi-laser PBF-LB/M Process
An EOS M 400-4 multi-laser PBF-LB/M machine (EOS GmbH,
Krailling/Munich, Germany) was utilized for this work. It oper-
ated with four identical laser units (1) in four separate quadrants
(Q1–Q4) with overlapping side areas.
[28,29]
Figure 1 shows a
detailed scheme of its process chamber. The four independent
scan units (2) defined the positions of the laser spots in focal
plane by tilted mirrors.
[28,29]
Four f-θlenses (3) provided a planar
focal level.
[28,30]
For each quadrant, a focused laser beam in an
area of 250 250 mm
2
(X–Yplane) can be guaranteed.
[29]
The
laser beam focus was measured for each quadrant by the original
equipment manufacturer as per standard service according to its
specification. With a build platform (9) of 400 400 mm
2
(X–Y
plane), each laser will then operate in a quadrant of 200 200 mm
2
(X–Yplane).
[29]
A sideward intersection of 50 mm to the neighbor
quadrants was utilizable.
[29]
The overlap area and the use of multi-
ple lasers on a single specimen were not considered for this inves-
tigation. Also the restricted area for build platform fixation (4),
located in each corner, was not utilized.
[29]
The focal points of
the four f-θlenses where the laser beams have no deflection
(7, 8) were located at 75 mm in X-direction and 75 mm Y-direc-
tion from the build platform center.
[29]
For the operation in all other
locations (5), a deflected laser beam (6) was needed. Figure 1
furthermore shows the shielding gas flow in the EOS M 400-4
PBF-LB/M machine. The shielding gas streamed out of a nozzle
in the middle of the build platform on top of the process cham-
ber.
[29]
On the right and the left sides in build layer height, the
shielding gas was sucked off by in Y-direction elongated exhaust
www.advancedsciencenews.com www.aem-journal.com
Adv. Eng. Mater. 2022,24, 2100635 2100635 (2 of 11) © 2021 The Authors. Advanced Engineering Materials published by Wiley-VCH GmbH
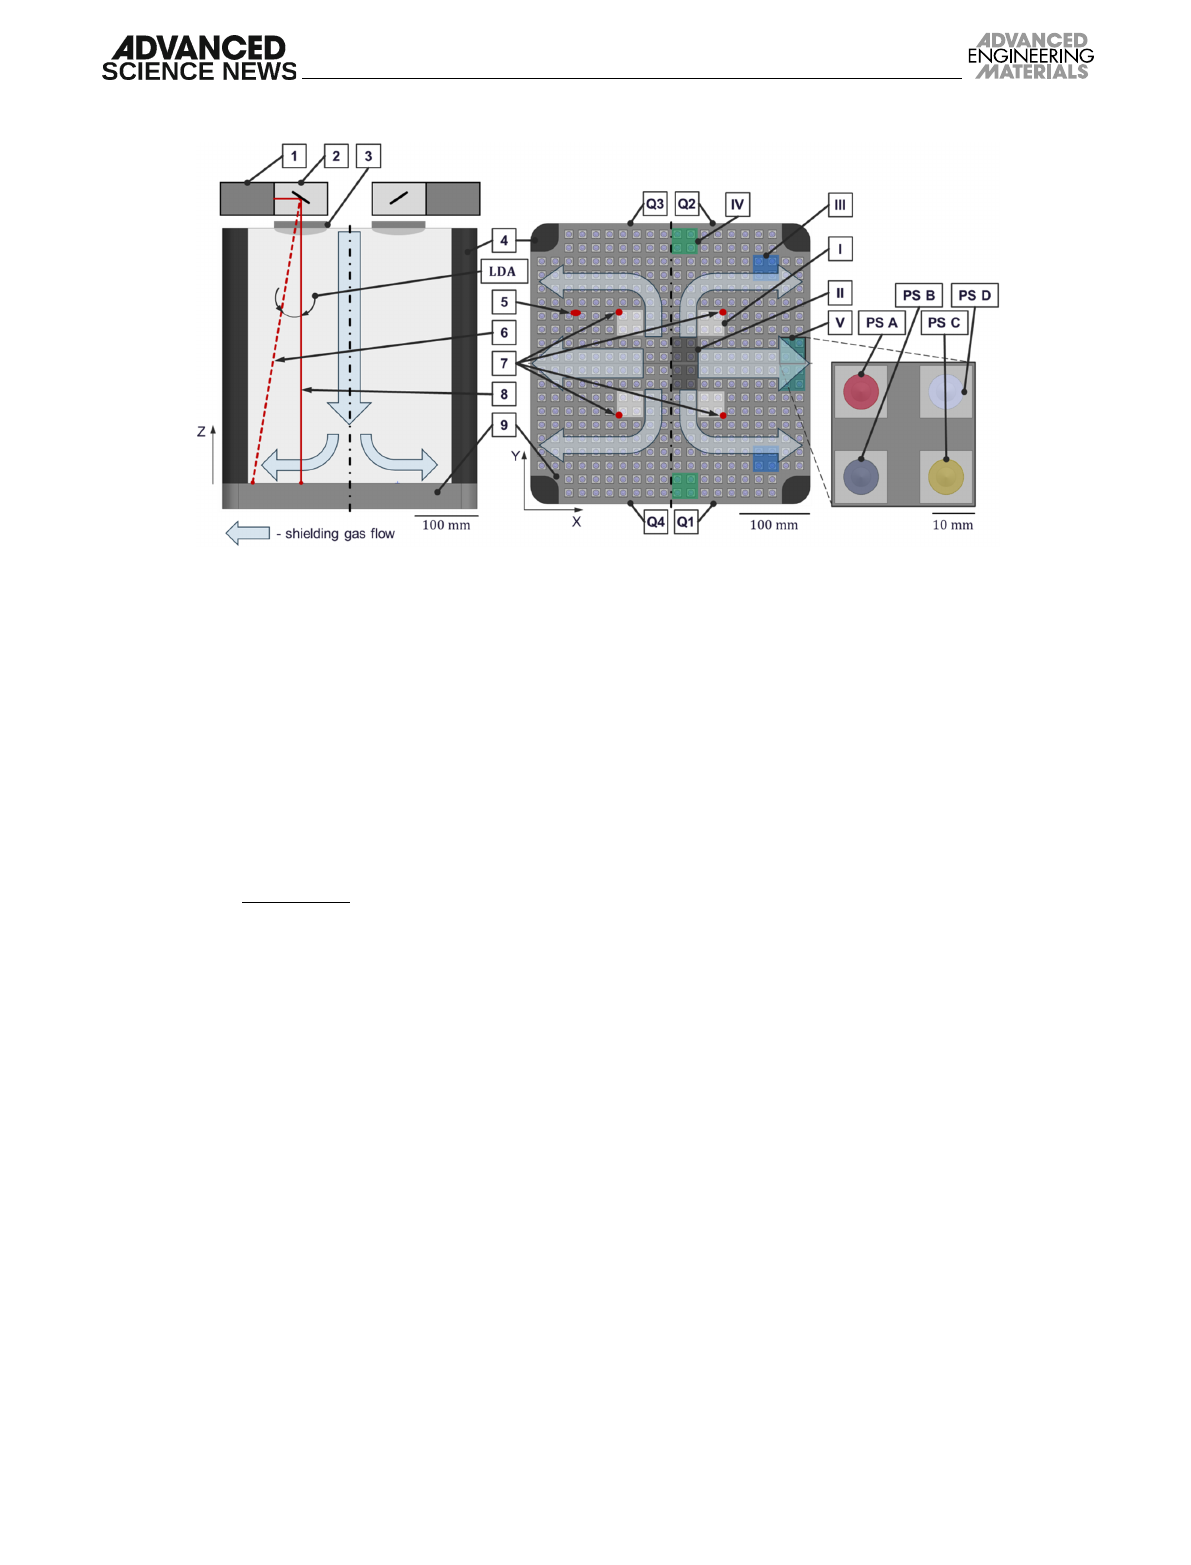
slots.
[29]
Therefore, symmetrical shielding gas conditions were
achieved in the combinations of Q1 þQ2 and Q3 þQ4.
[29]
As mentioned, the positioning on the build platform could
have an influence on the morphological properties of DMs.
The LDA can be used as a value which makes the different posi-
tions in build plane dimension comparable. It can be calculated
by Equation (1), where xLDA and yLDA are, respectively, the
X-and Y-distances from the nondeflected laser beam spot and
zLDA is the Z-height of the deflection device.
LDA ½°¼ arctan ffiffiffiffiffiffiffiffiffiffiffiffiffiffiffiffiffiffiffiffiffiffiffiffiffi
x2
LDA þy2
LDA
pzLDA
! (1)
The constant zLDA distance was defined by the span between
the deflection device and the build platform, and this then gave a
value of 490 mm for the EOS M 400-4. The combination of this
distance with the sample-specificxLDA and yLDA offsets can be
used to calculate an individual LDA for each specimen. A range
of values between 1.24° and 14.58° was covered for the four
parameter combinations, which are placed equally in the five
position blocks. Position block I was in the range from 1.24°
to 4.52°. The second position block II was in the center of the
build platform—7.57° to 10.78°. Symmetrically arranged in the
quadrants the positions III and IV ranged from 11.46° to
14.58°. The fifth position block V had LDAs from 8.18° to 11.38°.
For the layerwise powder spreading, the EOS soft recoating
system for the M400 series with a natural rubber lip (EOS
GmbH, Krailling/Munich, Germany) was used. The part expo-
sure was selected to be against the shielding gas flow by the
according EOS standard setting.
2.2.2. Sample Depowdering
Following manufacturing, samples were submitted to a two
stage depowdering program for ensuring complete removal of
remaining unbound powder. The first step, carried out with a
vacuum cleaner, ensured powder removal from larger cavities.
The second one included vibration, rotation, and inversion of
the build platform. It was carried out with a SFM AT800 depow-
dering machine (Solukon Maschinenbau GmbH, Augsburg,
Germany) to guarantee full powder removal even for smallest
cavities.
2.3. Methods
2.3.1. Sample Design
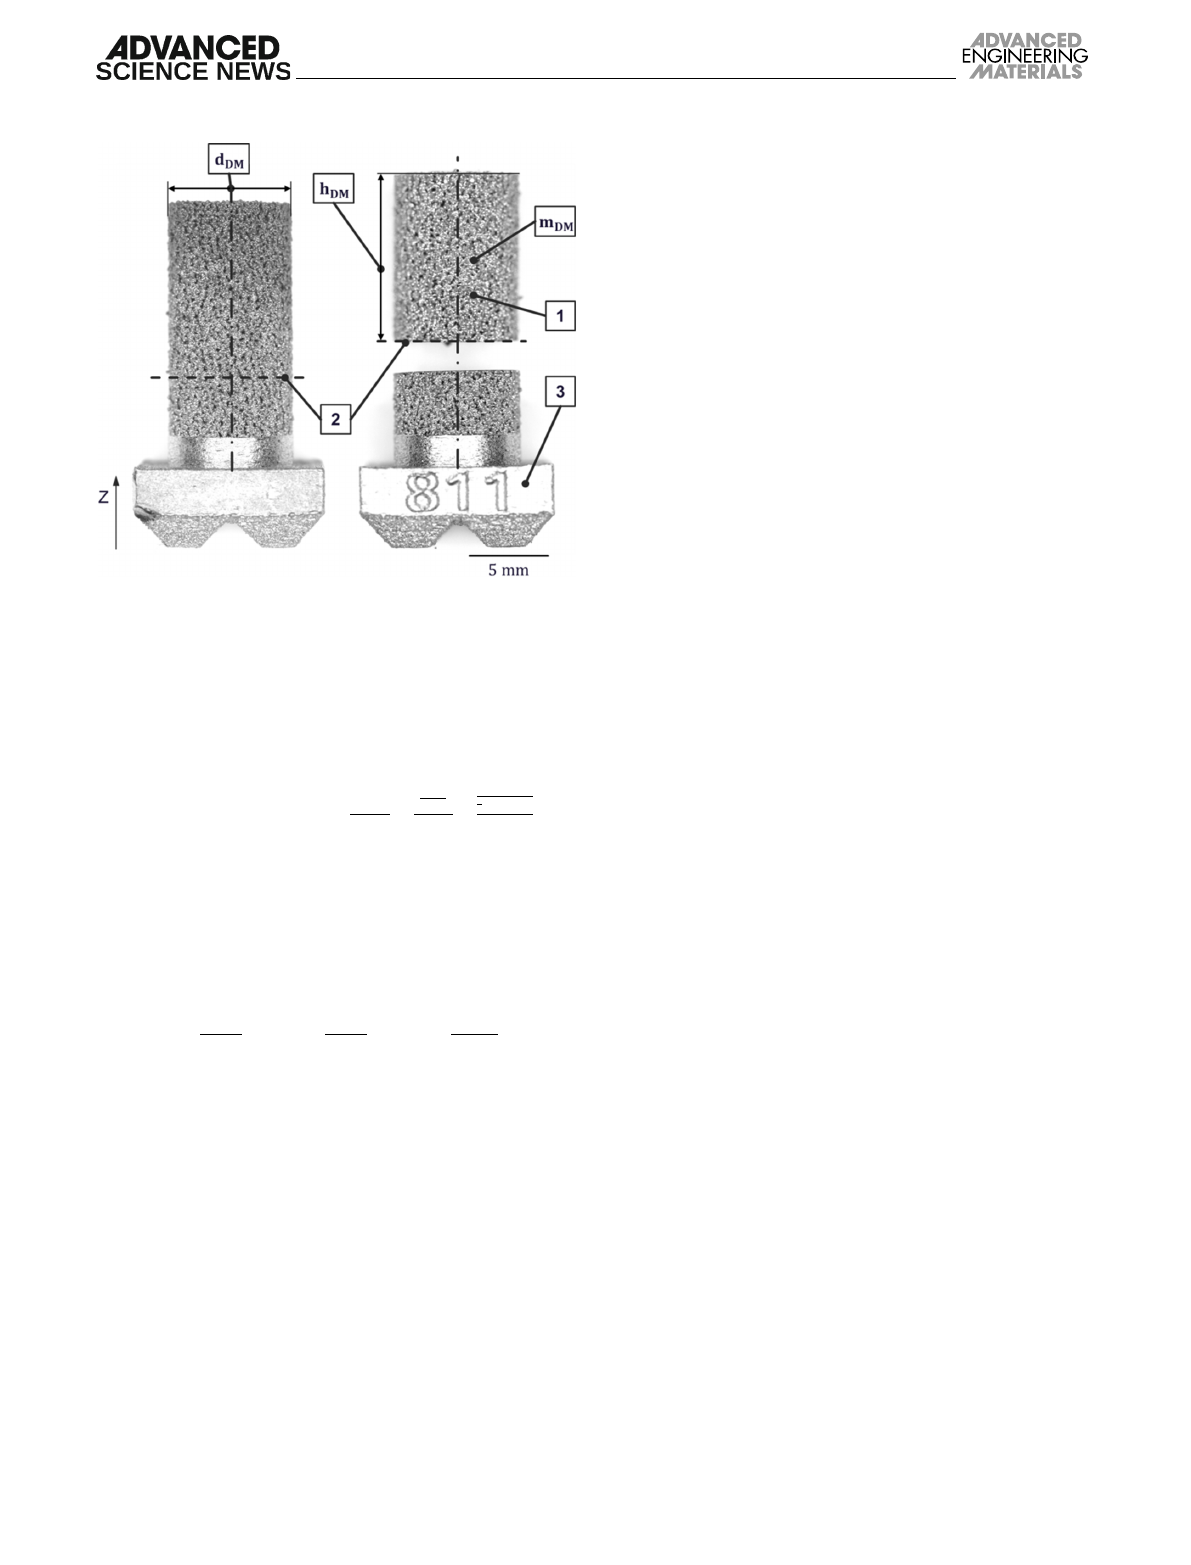
For determination of the relative density, a dedicated sample
design, shown in Figure 2, was developed. It consists of a base
block (3) on which a cylindrical DM specimen (1) with an as-build
diameter dDM of 8 mm is built. The specimen height hDM was
between 9.0 and 12.7 mm depending on the manually set cut-
off plane (2). The base block (3) was used for easier disassembly
off the build platform and for sample identification.
2.3.2. Relative Density Measurements and Determination of
Uncertainty Propagation
For determination of relative densities, the specimen height hDM
and diameter dDM were measured manually with a Mitutoyo 293-
661-10 digital dial micrometer (Mitutoyo Corporation, Kawasaki,
Japan). Final values were an average of ten measurements for
each specimen. The specimen mass mDM was measured using
a Sartorius BA 210 S high-resolution balance (Sartorius AG,
Goettingen, Germany).
For simplification purposes, it was assumed that the melted
material had a density of 100%. The relative density function
fRD is defined in Equation (2), where the relative density RD
is dependent on dDM as the specimen diameter, hDM as its height,
Figure 1. Schematic side view of the process chamber of an EOS M 400-4 with its shielding gas flow (left), the corresponding top view on its build
platform (middle), and the sample distribution at each position (I–V) with the according parameter sets (PS A–PS D) (right). 1—laser unit; 2—scan unit;
3—f-θlens; 4—restricted fixation area; 5—laser spot (deflected); 6—laser beam (deflected); 7—laser spots (not deflected); 8—laser beam (not
deflected); 9—build platform; Q1–Q4—quadrants Q1–Q4; I–V—positions I–V; PS A–PS D—parameter sets PS A–PS D; LDA—laser deflection angle.
www.advancedsciencenews.com www.aem-journal.com
Adv. Eng. Mater. 2022,24, 2100635 2100635 (3 of 11) © 2021 The Authors. Advanced Engineering Materials published by Wiley-VCH GmbH
and mDM as its mass. These parameters constituted a specific
DM density ρDM, which results from the ratio of the specimen
mass mDM and the specimen volume VDM. The theoretical bulk
density for Haynes 282 ρH282 was considered as 8.27 g cm3.
[19]
fRDðdDM,hDM,mDMÞ¼RD ½%¼ ρDM
ρH282
¼
mDM
VDM
ρH282
¼
mDM
π
4⋅d2
DM⋅hDM
ρH282
(2)
The uncertainty calculation was carried out according to DIN
1319-4.
[31]
The relative density uncertainty sRD is given by
Equation (3), where the relative density function fRD is derived
by its variables, specimen diameter dDM, height hDM, and mass
mDM. Another part of this calculation are the measurement accu-
racies sd,sh,smof each variable.
sRD½%¼ ffiffiffiffiffiffiffiffiffiffiffiffiffiffiffiffiffiffiffiffiffiffiffiffiffiffiffiffiffiffiffiffiffiffiffiffiffiffiffiffiffiffiffiffiffiffiffiffiffiffiffiffiffiffiffiffiffiffiffiffiffiffiffiffiffiffiffiffiffiffiffiffiffiffiffiffiffiffiffiffiffiffiffiffiffiffiffiffiffiffiffiffiffiffiffiffiffi
∂
fRD
∂
dDM
⋅sd
2
þ
∂
fRD
∂
hDM
⋅sh
2
þ
∂
fRD
∂
mDM
⋅sm
2
s
(3)
For this equation, the measurement accuracies of the single
terms are needed. The accuracy of the specimen diameter mea-
surement sdis a combination of the statistical part, which was
determined for each specimen and the device accuracy. The uti-
lized digital dial micrometer, Mitutoyo 293-661-10 (Mitutoyo
Corporation, Kawasaki, Japan), had a device accuracy of
0.01 mm. In average, the cumulated diameter measurement
accuracy sdwas calculated as being 0.026 mm. As the specimen
height hDM was measured also manually with the same tool, the
device accuracy was kept constant. An average height measure-
ment accuracy shof 0.068 mm was present. The measurement
accuracy of the used balance for determination of the specimen
mass mDM is defined with sm¼0.0002 g.
The average relative density uncertainties sRD for the parame-
ter set PS A was about 0.52%. In an equal range parameter set,
PS B is set with 0.42%. For parameter set PS C, an average
relative density uncertainty of 0.31% was calculated.
Parameter set PS D was also comparable with 0.50%. This
resulted in an average relative density uncertainty sRD of about
0.44% for all parameter sets combined.
2.3.3. Microcomputed Tomography Measurements
The DM morphology was analyzed via microcomputed tomogra-
phy (μCT) with a Yxlon FF85CT inspection system (Comet
Technologies USA, Inc., Hudson, USA). Micro focus was used.
Segmentation of the data was done with the software VGStudio
Max 3.3 (Volume Graphics GmbH, Heidelberg, Germany). The
gray value for the surface determination was selected so that the
digitally and physically measured relative density were equivalent.
2.4. Experimental Procedure
The experimental procedure of this study was separated into two
parts: first, a preliminary investigation of feasible process
parameter settings and second, the primary analysis of DM
repeatability.
Haynes 282 as material for open-porous PBF-LB/M structures
was not yet scientifically investigated. Therefore, the process
boundaries were identified with a grid scanning approach.
It assessed 250 different process parameter settings by visual
inspection. The criterion for the process boundaries was how
good the outer shape of the samples was represented. The visual
assessment was based on four categories—not buildable, build-
able with very poor quality, poor quality, or good quality. This
investigation built the baseline for the parameter selection for
the further analyses.
Out of the feasible parameter range four representative and
widely different process parameter combinations were selected
for the repeatability evaluation. For the main objective of this
study, assessing the relative density repeatability, two subap-
proaches for laser zone benchmarking and part positioning were
pursued. As the used PBF-LB/M machine—EOS M 400-4—works
with four lasers in four quadrants, a benchmarking of these zones
at position I was carried out. This process stability experiment was
repeated in a second build job. The following aspect under inves-
tigation was the positioning of DMs in build layer dimension.
However, keeping laser and process parameter combinations
constant, the sample location was assessed. For this investigation,
the differing LDAs were used as measure.
The identified scatter and positioning influence were used to
build a tolerance equation for the relative density of DMs made
from Haynes 282. An untested parameter set within the analyzed
ranged was checked against the formulation.
3. Preliminary Investigation of Feasible Process
Parameter Settings
3.1. Design of Experiment for Identification of the Process
Boundary
On one side, processing Haynes 282 as bulk material via PBF-
LB/M was broadly investigated.
[21,22]
On the other side, the
Figure 2. DM sample and its main features after manufacturing (left) and
after specimen separation (right). 1—DM specimen; 2—cut-off plane;
3—base block; hDM—DM height; dDM—DM diameter; mDM—DM mass.
www.advancedsciencenews.com www.aem-journal.com
Adv. Eng. Mater. 2022,24, 2100635 2100635 (4 of 11) © 2021 The Authors. Advanced Engineering Materials published by Wiley-VCH GmbH

feasibility of the open-porous DM process for Haynes 282 was
not addressed. In this case, there was the need to find parameter
sets between the process boundaries—highly dense and not
consistently buildable at all. For this purpose, a variation of the
process parameters layer thickness tL, hatch distance HD, laser
power LP, and scan speed LShas been carried out and the build-
ability of each combination has been visually investigated.
All parameters are denoted as reference to a standard param-
eter set. Experiments were carried out using both a standard layer
thickness (tStd
L) and twice that standard layer thickness (2 ⋅tStd
L).
Previous studies on such open-porous structures have shown a
high influence of the layer thickness on the resulting relative
density.
[9,11,17,18]
It was assumed that consistently buildable
DMs of higher layer thicknesses require higher line energies.
Therefore, different settings for laser power and scan speed
depending on the layer thickness were selected. In Table 1,
the multiples of the standard laser power (LStd
P), the standard scan
speed (LStd
S), and standard hatch distance (HStd
D) for the planned
design of experiment (DoE) are given. Furthermore, the volume
energy density EVis provided.
For all varied parameter factors—except layer thickness, five
levels were used. Two 5·5·5 matrices resulted, one for the stan-
dard layer thickness (tStd
L) and an additional one for the double
standard layer thickness (2 ⋅tStd
L).
The hatch rotation angle (Hrot) has a large influence on the
resulting morphology including the periodicity, connectiveness,
and the distribution of shapes of porous areas.
[7]
For the study, a
constant value of 67° for the hatch rotation was kept.
3.2. Determination of Process Boundaries
The DoE based on the parameters from Table 1 resulted in a grid
scanning of 250 process parameter combinations (that is, param-
eter sets). The large quantity was required to ensure that enough
data points would be available to examine the factors’contribu-
tions to the key response in this evaluation—buildability.
Figure 3 shows the two grids of the investigated DoE.
Furthermore, the buildability is indicated. Many samples did
not build up (red cross). A further quality assessment was if build
samples showed poor quality indications. Samples built up very
poorly (orange cross) or poorly (yellow cross) showed broken out
parts or rough contours. Exemplary images of samples with such
indications are shown in the lower part of Figure 3. Points that
are not marked with crosses are buildable in a satisfying quality
in order of representing the intended outer geometry.
4. Selection of Process Parameter Combinations
for the Repeatability Study
The use of multiple buildable parameter combinations with dif-
ferent volume energy densities might allow a more general con-
clusion for the investigated range. This should avoid that
findings can only be stated for a single parameter set. In addition,
this provides information on whether the parameter combina-
tion itself will have an impact on the repeatability. Table 2 shows
the four parameter sets PS A–PS D with widely different volume
energy density levels. As shown in Figure 3, they were chosen
from the standard layer thickness tStd
Lparameter combinations,
as by doubling the layer thickness the printability decreased.
Furthermore, Table 2 shows morphology illustrations taken
via segmented μCT volume data for a representative sample
of each parameter combination. These cross sections show
material (black) and pores (white) in two dimensions of the
DMs—one in build direction (Y–Zplane) and one in build layer
(X–Yplane).
5. Results and Discussion
To investigate the repeatability of DMs, the influences of part
positioning and process stability through different laser zones
on the relative density were analyzed. First, the part positioning
within the laser zones was investigated. These results were
used to establish two computed positioning compensation
approaches—global compensation approach (GCA) and param-
eter set compensation approach (PSCA). Subsequently, the
repeatability between the laser zones of the PBF-LB/M machine
was assessed for scatter with minimized positioning influence.
Afterward, the results for scatter and positioning influence were
combined to formulate tolerance equations, that were checked
against the measurement results.
5.1. Influence of Part Positioning on the Relative Density
Table 3 shows the influence of the LDA on the relative density of
the investigated DMs for quadrants Q1 þQ2 (that is, the combi-
nation of the quadrants Q1 and Q2) in positions I–V (compare
Figure 1). The quadrat-specific points and regressions are shown,
as well. These two quadrants have been assessed to underline the
validity of the findings even if different laser and scan units are
used. It is assumed that the transferability is also given for
quadrants Q3 and Q4. The elaborated measurement accuracies
of Section 2.3.2.—individual for each parameter set—are indi-
cated in the graphs.
An increase in the LDA results in a linear decrease in the
relative density for all four parameter sets, in both quadrants.
Even if some of the regression have lower coefficients of deter-
mination, the general trends are comparable. The suggested scat-
ter of the data motivates the elaboration of tolerance equations.
Table 3 combines the results of quadrants Q1 þQ2 to gain sta-
tistically more valid linear regression gradients. These then show
that denser DMs show a tendency toward a stronger influence of
the LDA on the relative density. For an assessment of this state-
ment, the theoretical relative densities at a LDA of 0° for the four
Table 1. Set of parameters used for the five-level DoE for the process
boundary investigation.
tStd
L2⋅tStd
L
Maximum EVMinimum EVMaximum EVMinimum EV
HD3.33 ⋅HStd
D7.78 ⋅HStd
D3.33 ⋅HStd
D7.78 ⋅HStd
D
LP1.06 ⋅LStd
P0.83 ⋅LStd
P1.20 ⋅LStd
P0.94 ⋅LStd
P
LS0.94 ⋅LStd
S1.20 ⋅LStd
S0.83 ⋅LStd
S1.06 ⋅LStd
S
EV19.32 J mm35.05 J mm312.40 J mm33.24 J mm3
www.advancedsciencenews.com www.aem-journal.com
Adv. Eng. Mater. 2022,24, 2100635 2100635 (5 of 11) © 2021 The Authors. Advanced Engineering Materials published by Wiley-VCH GmbH
Loading more pages...