1
Vol.:(0123456789)
Scientific Reports | (2021) 11:13205 | https://doi.org/10.1038/s41598-021-92475-7
www.nature.com/scientificreports
Predicting lethal courses
in critically ill COVID‑19 patients
using a machine learning
model trained on patients
with non‑COVID‑19 viral
pneumonia
Gregor Lichtner1,2, Felix Balzer1,2,3, Stefan Haufe4,6,7, Niklas Giesa2,
Fridtjof Schiefenhövel1,2,3, Malte Schmieding1,2,3, Carlo Jurth1, Wolfgang Kopp5,
Altuna Akalin5, Stefan J. Schaller1, Steffen Weber‑Carstens1, Claudia Spies1,3 &
Falk von Dincklage1,2*
In a pandemic with a novel disease, disease‑specific prognosis models are available only with a
delay. To bridge the critical early phase, models built for similar diseases might be applied. To test
the accuracy of such a knowledge transfer, we investigated how precise lethal courses in critically ill
COVID‑19 patients can be predicted by a model trained on critically ill non‑COVID‑19 viral pneumonia
patients. We trained gradient boosted decision tree models on 718 (245 deceased) non‑COVID‑19
viral pneumonia patients to predict individual ICU mortality and applied it to 1054 (369 deceased)
COVID‑19 patients. Our model showed a significantly better predictive performance (AUROC 0.86
[95% CI 0.86–0.87]) than the clinical scores APACHE2 (0.63 [95% CI 0.61–0.65]), SAPS2 (0.72 [95% CI
0.71–0.74]) and SOFA (0.76 [95% CI 0.75–0.77]), the COVID‑19‑specific mortality prediction models
of Zhou (0.76 [95% CI 0.73–0.78]) and Wang (laboratory: 0.62 [95% CI 0.59–0.65]; clinical: 0.56 [95%
CI 0.55–0.58]) and the 4C COVID‑19 Mortality score (0.71 [95% CI 0.70–0.72]). We conclude that lethal
courses in critically ill COVID‑19 patients can be predicted by a machine learning model trained on
non‑COVID‑19 patients. Our results suggest that in a pandemic with a novel disease, prognosis models
built for similar diseases can be applied, even when the diseases differ in time courses and in rates of
critical and lethal courses.
The coronavirus disease 2019 (COVID-19) pandemic poses a major threat to global health. Despite all efforts to
slow the spreading and contain the disease, healthcare systems in countries all over the world have been over-
whelmed with high demands for critical care resources. To manage these demands in the best possible way and
to enable an effective and efficient allocation of critical care resources, prognosis models for individual disease
courses and outcomes are essential. Accordingly, several prognosis models for critical and lethal courses in criti-
cally ill COVID-19 patients have been published over the course of the year1–8.
OPEN
1Charité – Universitätsmedizin Berlin, corporate member of Freie Universität Berlin, Humboldt-Universität zu Berlin, and
Berlin Institute of Health, Department of Anesthesiology and Operative Intensive Care Medicine (CCM, CVK), Charitéplatz
1, 10117 Berlin, Germany. 2Charité – Universitätsmedizin Berlin, corporate member of Freie Universität Berlin,
Humboldt-Universität zu Berlin, and Berlin Institute of Health, Institute of Medical Informatics, Berlin, Germany. 3Einstein
Center Digital Future, Berlin, Germany. 4Charité – Universitätsmedizin Berlin, corporate member of Freie Universität
Berlin, Humboldt-Universität zu Berlin, and Berlin Institute of Health, Klinik für Neurologie mit Experimenteller
Neurologie, Berlin, Germany. 5Max‐Delbrück‐Center for Molecular Medicine in the Helmholtz Association (MDC), Berlin
Institute for Medical Systems Biology (BIMSB), Berlin, Germany. 6Physikalisch-Technische Bundesanstalt Braunschweig
und Berlin, Department of Mathematical Modelling and Data Analysis, Berlin, Germany. 7Technische Universität Berlin,
Uncertainty, Inverse Modeling and Machine Learning Group, Berlin, Germany. *email: falk.[email protected]
2
Vol:.(1234567890)
Scientific Reports | (2021) 11:13205 | https://doi.org/10.1038/s41598-021-92475-7
www.nature.com/scientificreports/
The reported predictors for lethal courses in COVID-19 patients can be divided into seven groups, including
(1) demographic features like age and gender, (2) comorbidities like COPD, obesity, hypertension and diabetes,
(3) radiological signs of disease severity like multi-lobular infiltration, (4) blood infection markers and infection
associated blood count parameters like C-reactive protein, procalcitonin and lymphocyte counts, (5) other labora-
tory blood markers associated with organ distress like lactate dehydrogenase, bilirubin or blood urea nitrogen, (6)
direct clinical signs of organ failure like respiratory rate, blood oxygenation or blood pressure and (7) intensive
care treatment measures as indirect markers of organ failure like catecholamine doses or ventilation parameters.
Interestingly, the predictors that were identified to indicate critical and lethal courses in COVID-19 patients
are very similar to those applied in models for the prediction of lethal courses in critically ill non-COVID-19
viral pneumonia patients9–13. This similarity is not entirely surprising, as the fundamental pathophysiological
mechanisms of organ failure in those patients developing a critical or lethal course appear relatively similar
between COVID-19 and other types of viral pneumonia, even though the rate of patients developing a critical
or lethal course and the time frame of such courses may differ profoundly.
Such pathophysiological similarities of critical and lethal courses between intensive care patients with different
types of viral pneumonia might allow to transfer knowledge obtained on one type of viral pneumonia to other types,
even though they differ in mortality rates and time courses. Especially in a pandemic situation with a new type of
disease, such knowledge transfer might be highly beneficial, as it would bridge the critical early phase by allowing the
use of prediction models built for similar diseases until first models based on data of the actual disease are available.
To test our hypothesis that models developed to predict lethal courses for one type of viral pneumonia also
allow to predict lethal courses for another type of viral pneumonia, even when the specific diseases differ in
lethality rate and time courses, we performed this study. To specifically address the pandemic scenario, we
investigated how well lethal courses in critically ill COVID-19 patients can be predicted by a machine learning
model trained on data of critically ill patients with non-COVID-19 viral pneumonia.
Results
Patient sample. Of the 749 critically ill non-COVID-19 viral pneumonia patients for which we extracted
data, 31 patients were excluded as their ICU treatment was shorter than 24h or as they were also tested positive
for SARS-CoV-19, leaving 718 patients (473 survivor/245 non-survivor) with a median ICU length of stay of 13
d (IQR 5–28 d) for a total of 16,180 time bins of 24h duration for model training (Fig.1, Table1).
For the COVID-19 dataset, we extracted the data of 1176 critically ill patients with completed cases. Of these,
122 were excluded as their ICU treatment was shorter than 24h or as they were also tested positive for another
virus possibly causing pneumonia, leaving 1054 patients (685 survivor/369 non-survivor) with a median ICU
length of stay of 9 d (IQR 4–22 d) for a total of 18,521 time bins of 24h duration for model testing (Fig.1, Table1).
Prediction model performance. The multivariate non-COVID-19 viral pneumonia gradient boosted
tree model using the full feature set as well as the reduced model that only included the 20 features with the high-
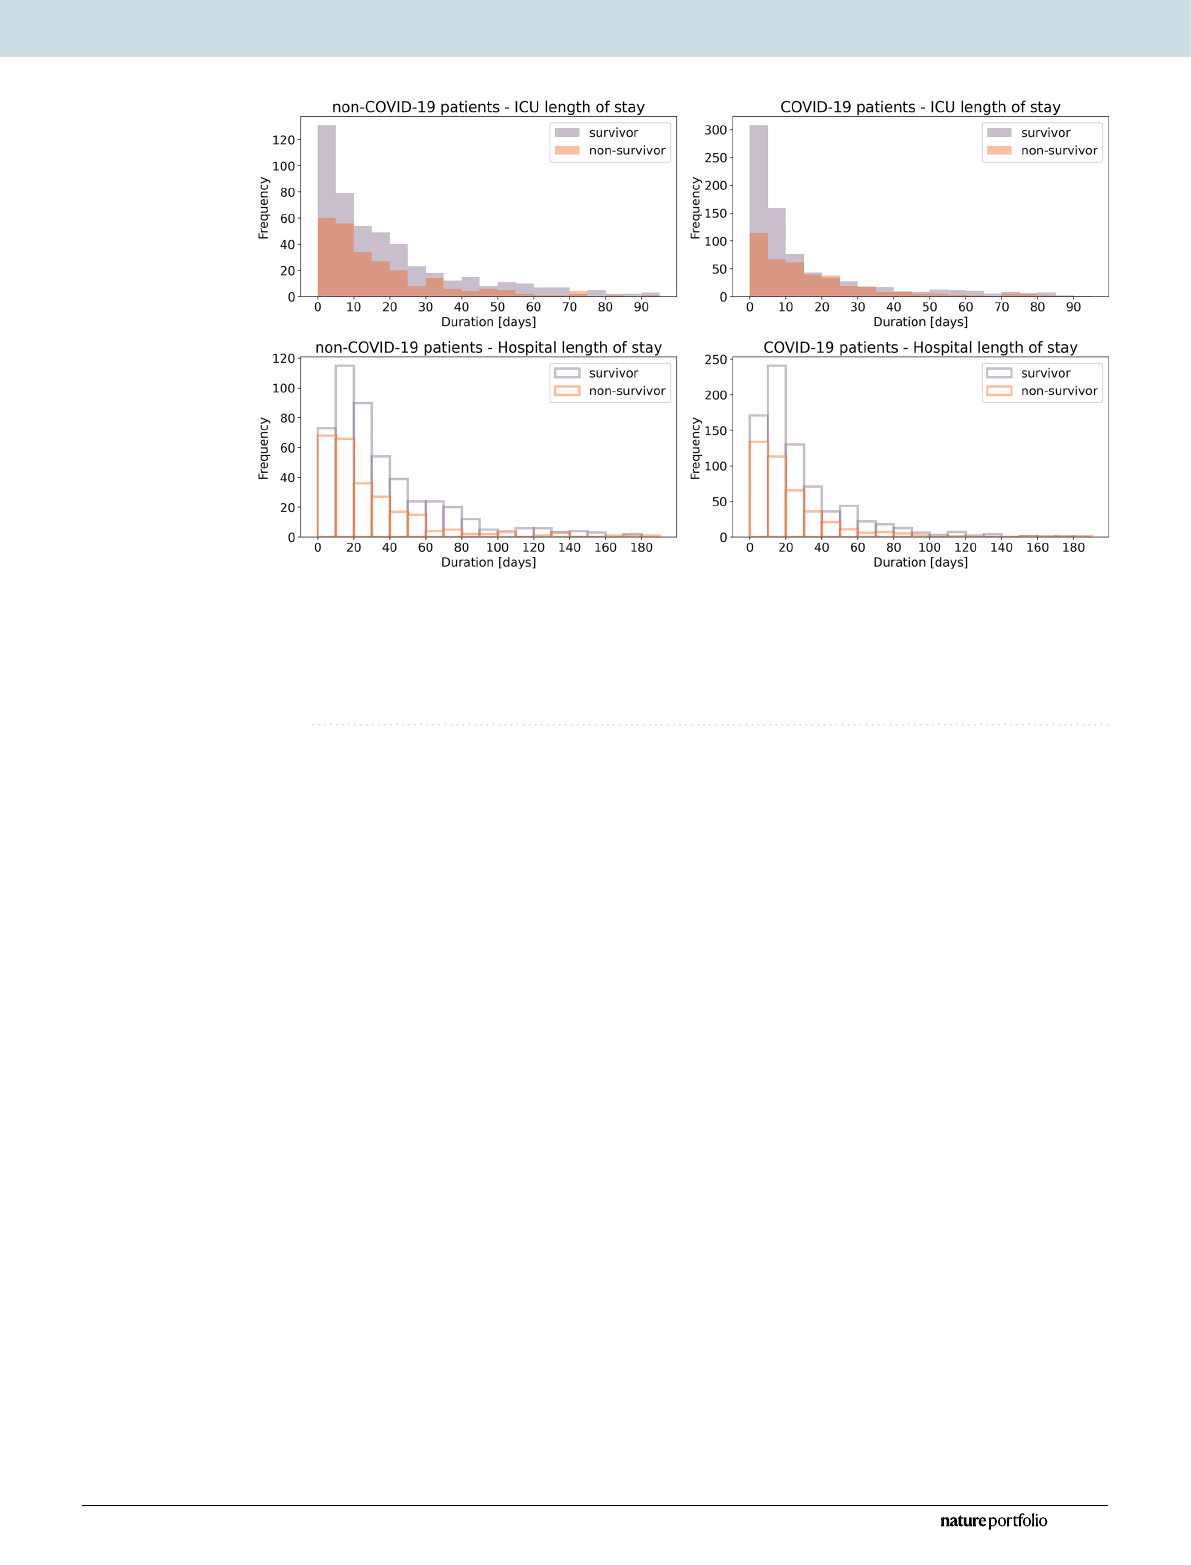
Figure1. Durations of ICU treatment and hospitalization of all formerly treated patients. Shown are the
histograms of length of stay in intensive care units (top) and total length of stay in the hospital (bottom) for
critically ill non-COVID-19 patients (left) and critically ill COVID-19 patients (right), separately for survivors
(purple) and non-survivors (orange). 7 (1) non-COVID-19 (COVID-19) patients with more than 200days
in the hospital and 20 (11) non-COVID-19 (COVID-19) patients with more than 100days in an ICU are not
shown in this illustration as they are out of the depicted axis range.
3
Vol.:(0123456789)
Scientific Reports | (2021) 11:13205 | https://doi.org/10.1038/s41598-021-92475-7
www.nature.com/scientificreports/
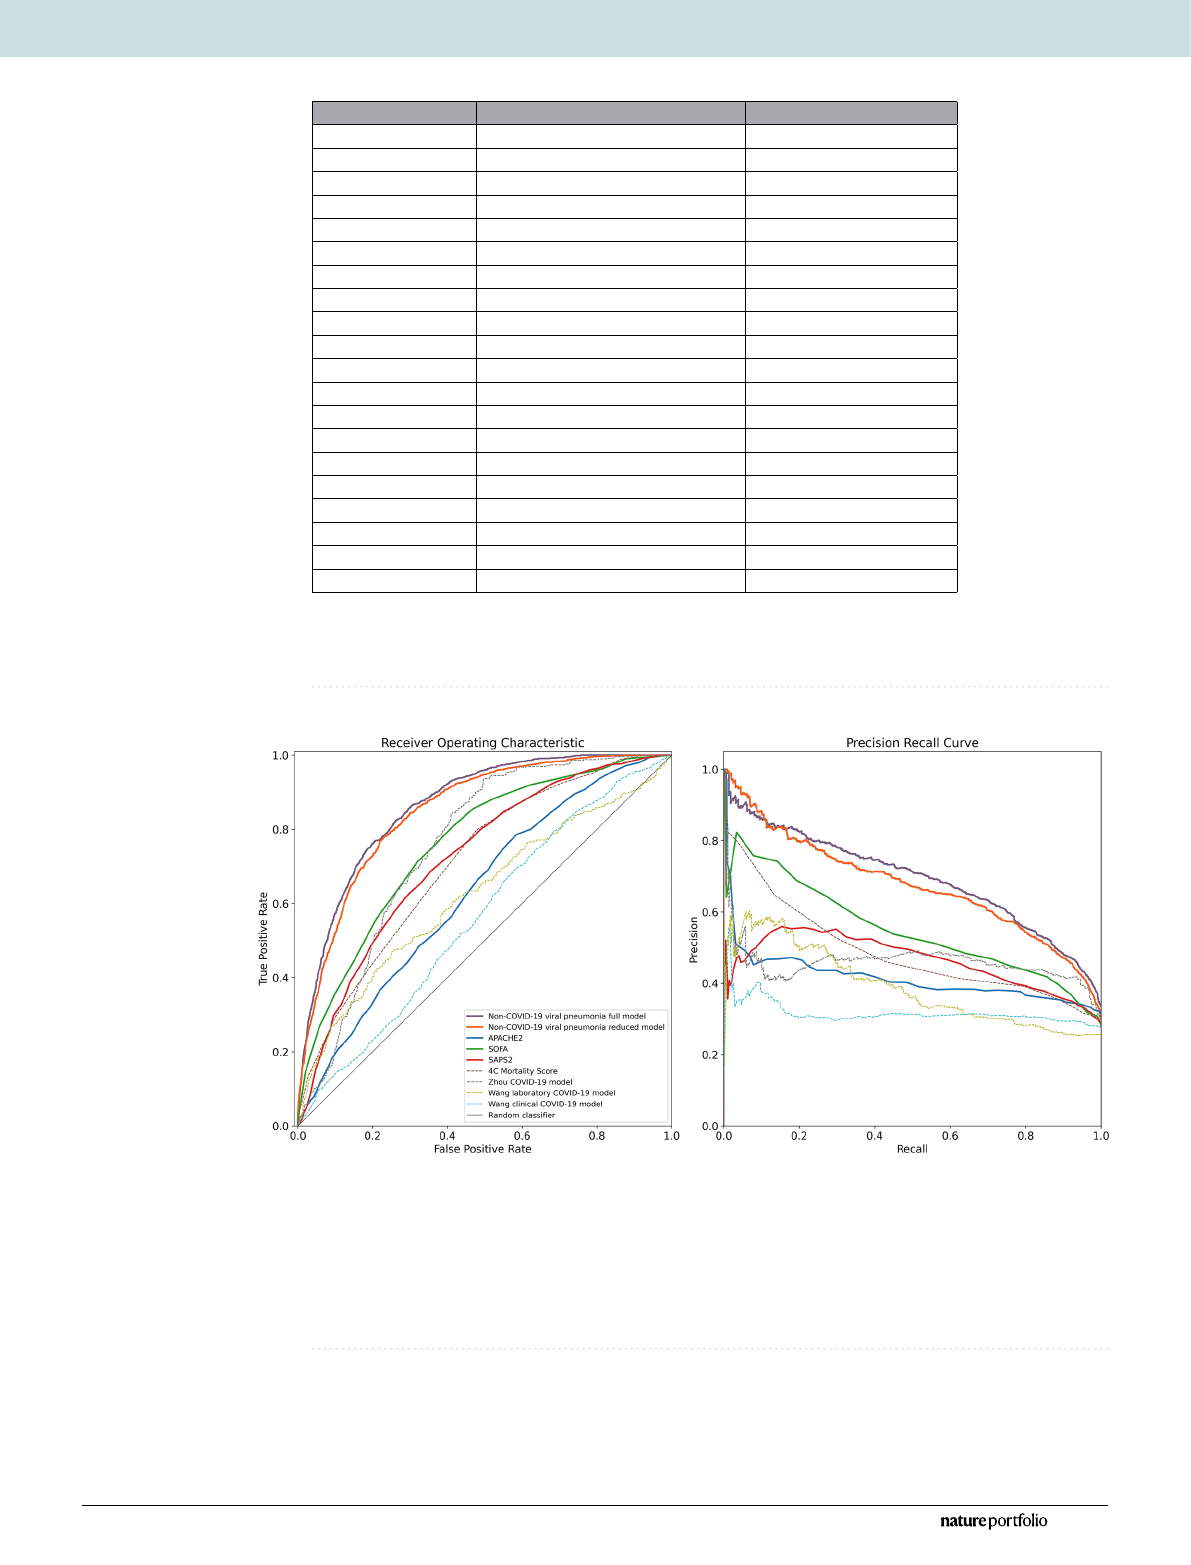
est importance on the training dataset both showed a significantly better predictive performance than any of the
clinical scores APACHE2, SAPS2 and SOFA, and the previously published prediction models (Fig.2, Table2).
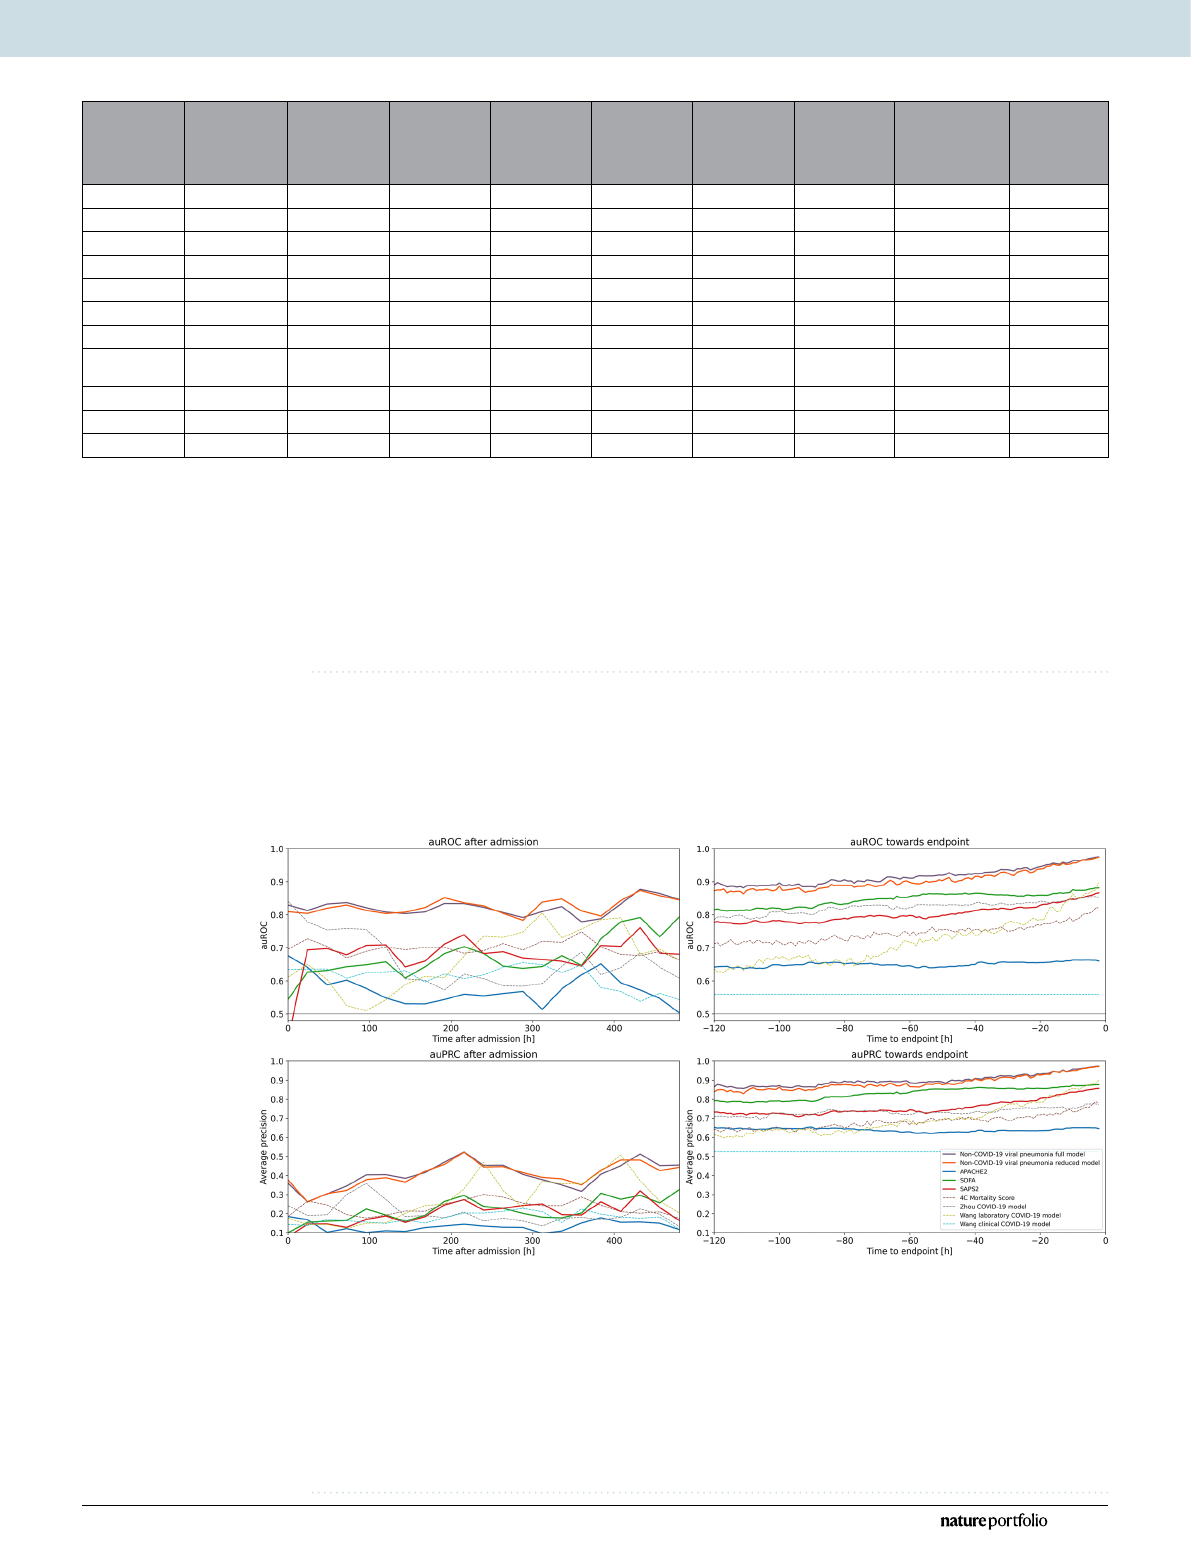
The time courses of prediction metrics for all models that used time-varying variables increased with increas-
ing time after admission, and reached their maximum towards the endpoint (Fig.3). Throughout the first day
after admission to the end of stay, both the full and the reduced model outperformed all clinical scores and
Table 1. Patient characteristics. The table shows descriptive statistics of the non-COVID-19 patient training
dataset and the COVID-19 patients test dataset (median (IQR) for continuous variables; n cases (percentage of
group total) for binary variables).
Non-COVID-19 patients (training dataset) COVID-19 patients (test dataset)
n 718 1054
Deceased 245 (34%) 369 (35%)
Age [a] 62.0 (50.0–73.0) 67.0 (57.0–77.0)
Sex 282 female (39%) 333 female (32%)
BMI [kg/m2] 25.7 (22.3–29.6) 27.8 (24.7–32.7)
Asthma 18 (3%) 51 (5%)
Carcinoma 171 (24%) 67 (6%)
Cardiovascular diseases 370 (52%) 444 (42%)
COPD 204 (28%) 142 (13%)
Coronary heart disease 152 (21%) 217 (21%)
Diabetes 340 (47%) 462 (44%)
Hypertension 402 (56%) 690 (65%)
Chronic kidney diseases 179 (25%) 194 (18%)
Lung diseases 267 (37%) 229 (22%)
Malnutrition 201 (28%) 182 (17%)
Metabolic disorders 477 (66%) 608 (58%)
Obesity 85 (12%) 129 (12%)
Pulmonary fibrosis 59 (8%) 54 (5%)
Pulmonary hypertension 320 (45%) 340 (32%)
Stroke 85 (12%) 142 (13%)
Figure2. Performance metrics of the non-COVID-19 viral pneumonia mortality prediction models,
clinical scores and previously published COVID-19 mortality prediction models. Shown are the receiver
operating characteristics (left) and precision-recall (right) curves for the full (purple) and reduced (orange)
non-COVID-19 viral pneumonia mortality prediction model and for the clinical scores APACHE2 (blue),
SOFA (green), SAPS2 (red) for the prediction of mortality within the next 5days in COVID-19 patients across
all 24h time bins of each patient’s stay on the ICU, weighted inversely by the number of time bins per patient.
Additionally shown are the ROC and PRC curves of previously published COVID-19 mortality prediction
models (dashed lines) and the performance of a random classifier (solid gray).
4
Vol:.(1234567890)
Scientific Reports | (2021) 11:13205 | https://doi.org/10.1038/s41598-021-92475-7
www.nature.com/scientificreports/
Table 2. Performance metrics. The table shows the area under the ROC (auROC)andthe area under the
precision-recall curve (auPRC) as threshold-independent performance metrics and the F1 score, positive
predictive value (PPV)/precision, negative predictive value (NPV), sensitivity/recall and specificity at a
classifier threshold that maximizes the F1 score (Threshold@max F1) for each of the models/scores applied
to the COVID-19 viral pneumonia patients test dataset for the prediction of mortality within the next 5days
across all 24h time bins of each patient’s stay on the ICU, weighted inversely by the number of time bins per
patient. Additionally shown are the number of included time bins (note that there are usually multiple time
bins per patient) and the number of included unique patients for each of the models and the Brier score for the
two models that output a probability score for the prediction.
Non-
COVID-19
viral
pneumonia full
model
Non-
COVID-19
viral
pneumonia
reduced model APACHE2 SOFA SAPS2 4C Mortality
Score Zhou COVID-
19 model Wang laboratory
COVID-19 model
Wang clinical
COVID-19
model
auROC 0.86 (0.86–0.87) 0.85 (0.84–0.86) 0.63 (0.61–0.65) 0.76 (0.75–0.77) 0.72 (0.71–0.74) 0.71 (0.70–0.72) 0.76 (0.73–0.78) 0.62 (0.59–0.65) 0.56 (0.55–0.58)
auPRC 0.69 (0.67–0.71) 0.68 (0.65–0.70) 0.41 (0.39–0.44) 0.53 (0.51–0.56) 0.46 (0.44–0.48) 0.46 (0.43–0.48) 0.46 (0.42–0.50) 0.39 (0.35–0.43) 0.32 (0.30–0.34)
F1 score 0.67 (0.66–0.68) 0.66 (0.64–0.67) 0.51 (0.49–0.52) 0.56 (0.54–0.58) 0.53 (0.51–0.54) 0.50 (0.48–0.51) 0.58 (0.55–0.61) 0.43 (0.41–0.47) 0.44 (0.43–0.46)
PPV/Precision 0.61 (0.59–0.63) 0.57 (0.55–0.62) 0.38 (0.35–0.39) 0.45 (0.43–0.50) 0.44 (0.39–0.47) 0.41 (0.40–0.43) 0.42 (0.40–0.46) 0.33 (0.28–0.43) 0.29 (0.28–0.32)
NPV 0.89 (0.88–0.90) 0.90 (0.88–0.91) 0.80 (0.79–0.84) 0.87 (0.83–0.88) 0.83 (0.82–0.86) 0.82 (0.81–0.83) 0.95 (0.90–0.96) 0.81 (0.79–0.84) 0.83 (0.80–0.85)
Sensitivity 0.74 (0.72–0.77) 0.77 (0.70–0.79) 0.76 (0.74–0.88) 0.75 (0.63–0.80) 0.65 (0.60–0.77) 0.62 (0.60–0.64) 0.93 (0.83–0.95) 0.62 (0.46–0.81) 0.92 (0.80–0.93)
Specificity 0.82 (0.80–0.84) 0.78 (0.76–0.84) 0.44 (0.28–0.47) 0.64 (0.59–0.74) 0.67 (0.53–0.73) 0.66 (0.65–0.67) 0.50 (0.49–0.61) 0.57 (0.31–0.78) 0.15 (0.14–0.32)
Threshold@
max F1 0.15 (0.13–0.16) 0.16 (0.15–0.21) 20.00 (16.00–
21.00) 7.00 (6.00–9.00) 43.00 (39.00–
45.00) 13.00 (13.00–
13.00) 21.75 (21.51–
25.43) −15.82
(−19.50–−13.12) 5.53 (5.53–6.57)
n time bins 18,521 18,521 13,361 17,255 17,245 18,521 4774 4480 18,521
n patients 1054 1054 607 921 925 1054 278 253 1054
Brier score 0.15 (0.15–0.16) 0.15 (0.15–0.16)
Figure3. Time courses of the area under the ROC curves (auROC) and area under the precision recall
curve (auPRC) of the non-COVID-19 viral pneumonia mortality prediction model, clinical scores and
previously published COVID-19 mortality prediction models. Shown are the auROC (top) and auPRC
(bottom) time courses between admission and 20days after admission (left) and between 120 and 1h before
the endpoint (death/control endpoint; right) for the full (purple) and reduced (orange) non-COVID-19 viral
pneumonia mortality prediction models and for the clinical scores APACHE2 (blue), SOFA (green), SAPS2
(red) for the prediction of mortality within the next 5days in COVID-19 patients. Prediction windows for the
time courses after admission were 24h and prediction windows for the time courses before the endpoints were
1h. Additionally shown are the ROCand PRC curves of previously published COVID-19 mortality prediction
models (dashed lines) and the performance of a random classifier (solid gray).

5
Vol.:(0123456789)
Scientific Reports | (2021) 11:13205 | https://doi.org/10.1038/s41598-021-92475-7
www.nature.com/scientificreports/
previously published COVID-19 prediction models. Additionally, the performance of the reduced model did not
systematically differ from that of the full model during the first days after admission. However, it was reduced
5days before the endpoint, but approximated the performance of the full model towards the endpoint.
Clinical features of the reduced model. From the 251 features of the full model, we determined those
20 unique clinical features that showed the highest feature importance as quantified by the mean absolute SHAP
values on the non-COVID-19 viral training dataset (Fig.4). Most of these features showed a significant differ-
ence between patients who deceased within the next 5days and patients who survived the next 5days already
within the first 24h after admission, both for the non-COVID-19 patients training and the COVID-19 patients
test dataset (Table3).
Discussion
We demonstrate here that lethal courses in critically ill COVID-19 patients can be predicted by a machine
learning model trained on critically ill non-COVID-19 viral pneumonia patients. Furthermore, we show that
the predictive performance of the model is not inferior to models developed specifically for COVID-19 patients.
The plausibility of this approach is reinforced by the fact that the features that showed the highest importance
in our model trained on non-COVID-19 patients and the features included in specific COVID-19 models are
largely identical.
The features that are commonly included in models to predict individual mortality in COVID-19 and critically
ill non-COVID-19 viral pneumonia patients can be divided in seven groups, including (1) demographic features
like age and gender, (2) comorbidities like chronic obstructive pulmonary disease (COPD), obesity, hyperten-
sion and diabetes, (3) radiological signs of disease severity like multi-lobular infiltration, (4) blood infection
markers and infection associated blood count parameters like C reactive protein, procalcitonin and lymphocyte
counts, (5) other laboratory blood markers associated with organ distress like lactate dehydrogenase, bilirubin
or blood urea nitrogen, (6) direct clinical signs of organ failure like respiratory rate, blood oxygenation or blood
pressure and (7) intensive care treatment measures as indirect markers of organ failure like catecholamine doses
or ventilation parameters1–13.
Similarly, the 20 parameters with the highest feature importance in our model trained on non-COVID-19
viral pneumonia patients included radiological signs of pulmonary infiltrates [group 3], infection-associated
blood counts of neutrophils and monocytes [group 4], laboratory markers of organ distress and organ failure
(thrombocytes, red blood cell distribution width, pH, P/F ratio, sodium, lactate dehydrogenase and alanine
aminotransferase) [group 5], direct clinical signs of organ distress and organ failure (heart rate, blood pressure,
blood oxygen saturation, urine output and respiratory rate) [group 6] or intensive care treatment measures as
indirect markers of organ distress and organ failure (vasoactive inotropic score as a summary parameter of
catecholamine administration, ventilation peak pressure and ventilation mode) [group 7].
While the differentiation between the latter two groups might not be sharp as the clinical signs of group 6
are always impacted by the treatment measures of group 7 and vice versa, it is clear that besides the infection
parameters as the primary driving cause for mortality in viral pneumonia, all but two of the other parameters
included in the 20 parameters with the highest feature importance in our model are either direct or indirect
measures of organ failure and therefore represent the mechanism by which the infection induces mortality.
Accordingly, the included parameters cover signs of organ distress and organ failure for all major organ systems
that are in the primary focus of intensive care treatment, including heart and circulation, lungs and respiration,
liver and coagulation, as well as kidneys and volume regulation.
The fact that from all demographic features [group 1] only age and height and none of the comorbidities
[group 2] proved of a high enough predictive value independent of the other included parameters to show in the
20 parameters with the highest feature importance might seem unexpected at first glance, as many features from
these groups have been shown in various previous studies as valuable predictors for critical and lethal courses in
both critically ill COVID-19 and non-COVID viral pneumonia patients. However, when focusing on mortality,
all of these features can be regarded as indirect predictors as they mediate the likelihood of specific organ failures
that lead to a lethal course. Thus, in the case of the parameters included in the model that allow the prediction of
lethal organ failure, the predictive value of the parameters from these first two groups of indirect parameters can
be masked by the parameters indicating organ failure. For example, COPD has been shown in multiple studies to
be a risk factor for a critical or lethal course in both COVID-19 and non-COVID-19 viral pneumonia patients7,14,
but these critical and lethal courses are not caused by COPD directly and independently of organ failure. Instead,
the effect of COPD is mediated through organ damage and associated increased risks of organ failure like lung
or heart failure. Overall, this effect of organ failure parameters masking indirect risk factors in the prediction
of lethal courses can be expected to increase with decreasing time between prediction and death. Thus, when
focusing on the treatment phase in the intensive care unit, which is defined by immediate or impending organ
distress and organ failure, the measures of the severity of the organ dysfunction can be expected to fully mask the
indirect predictors, as we show here. The only indirect parameter that remained unmasked in our model was age,
suggesting that other than the impact of specific diseases and disease groups the impact of age on organ func-
tion and compensation reserves for organ function during distress is not fully represented by the here included
organ failure markers. In contrast, the role of the other parameter of the group of demographic features that was
included in the 20 most important features—the patients’ height—is most probably not that the patients’ height
is a predictor of mortality by itself, but that the patients’ height is an indirect prediction parameter that increases
the information value of other predictors through individual normalization. As an example, the information
value of urine output per kilogram of lean body weight (which is primarily determined by the height) is higher
than the information value of urine output by itself.
Loading more pages...