
3rd PLATE Conference
September 18 – 20, 2019
Berlin, Germany
Nils F. Nissen
Melanie Jaeger-Erben (eds.)
Universitätsverlag der TU Berlin
Hsu, Wan-Ting; Domenech, Teresa; McDowall, Will: Circular economy of
plastics: analysis of fl ows and stocks of plastic in Europe . In: Nissen,
Nils F.; Jaeger-Erben, Melanie (Eds.): PLATE – Product Lifetimes And The
Environment : Proceedings, 3rd PLATE CONFERENCE, BERLIN, GERMA-
NY, 18 – 20 September 2019. Berlin: Universitätsverlag der TU Berlin, 2021.
pp. 369 – 373. ISBN 978-3-7983-3125-9 (online). https://doi.org/10.14279/
depositonce-9253.
This article – except for quotes, fi gures and where otherwise noted – is
licensed under a CC BY 4.0 License (Creative Commons Attribution 4.0).
https://creativecommons.org/licenses/by/4.0/.

369
3rd PLATE 2019 Conference
Berlin, Germany, 18-20 September 2019
Circular Economy of Plastics: Analysis of Plastic Flows and Stocks
in Europe
Hsu WT.; Domenech T.; McDowall W.
Institute for Sustainable Resources, University College London, London, United Kingdom
Keywords: Circular Economy; Material Flow Analysis; Dynamic Modeling; Stocks; Plastics.
Abstract: Plastic production is continuously growing and accumulated in the socioeconomic system.
Plastic in the stock has the potential to become plastic waste in the future, contributing to waste
generation or secondary plastics supply. This research applied material flow analysis(MFA) which
provides one-year snapshot of the system to then build a dynamic MFA model to estimate the future
plastic waste change from 1960 to 2040.
The results show that around 66.27±15.4 million tonnes(MT) plastic polymers production in the EU, and
about 69.99±11.8 MT consumed across packaging(31%), construction(18%), transport(13%), electrical
and electronic products(9%), textiles(6%) and other(23%) applications in 2014. The recycling rate was
around 38% but only 9% of this was used as secondary plastics to produce new products. According to
the stock modelling, total inflows and outflows are expected to increase in the future, which accounts for
178MT inflows and 131MT outflows in 2040. The amounts of in-use stock in this scenario continue
increase and reach to 1282MT in 2040. Construction dominates the stock-in-use for a long time due to
its long life span.
These results highlight the large quantities of plastics have accumulated in the societal stock and
leakage to natural systems. This study provides decision-makers an evidence-based model to plan
plastic circular economy strategies. Future research is suggested to combine these results of the stock
model into different scenarios which can help in gaining insights about possible future outcomes of
plastic circular economy strategies in the EU.
Introduction
Plastic products are omnipresent in human
lives and are extensively used in different
sectors. The production of the plastic is
continuously growing and accumulated in the
socioeconomic system. Geyer, Jambeck, and
Law (2017) estimated that 8300 million
tonnes(MT) plastics have been produced since
the early 20th century. In the global plastic
value chain, the EU plays an instrumental role,
contributes to 20% of the global production and
17% of global consumption (Plastics Europe,
2017). However, large quantities of plastic
materials and products have accumulated in
the societal stock or leakage to natural
systems, given that lifespans of plastic
components vary significantly. Plastic in the
stock has the potential to become plastic waste
in the future, contributing to waste generation or
secondary plastics supply. Transition to more
circular use of plastics requires an
understanding of plastic in the stock in order to
project infrastructural needs for future
processing of plastics and supply of secondary
plastics.
In 2015, the European Circular
Economy Action Plan (European Commission,
2015) identified plastics as one of five priority
areas for action. The European Commission
(2018) has established a strategy for moving
plastics towards a circular economy by 2030.
The concept of a circular economy has
attracted considerable business and policy
attention, thus, it is crucial to assess both
plastic flows and stocks. Geyer et al. (2017)
estimated that in-use stock of plastics may
account for 2500 MT globally, while analyses
such as Ciacci, Passarini, and Vassura (2017)
focused on European PVC flows and stocks.
Kawecki, Scheeder, and Nowack (2018) have
recently estimated plastic material flows in the
EU but the analysis does not include the
stocks. However, comprehensive analyses of
the plastic flows and stocks at EU level are still
largely missing. This study aims to contribute to
fill this gap by proposing a dynamic stock model
for plastics, which consider stocks and future
plastic waste flows to contribute to more
accurate assessment of Circular Economy
370
3rd PLATE Conference Berlin, Germany, 18-20 September 2019
Hsu WT., Domenech T, McDowall W.
Circular economy of plastics: analysis of plastic flows and stocks in Europe
opportunities for plastics in Europe. The study
can also contribute to literature by providing
methodological guidelines for the design of
comprehensive dynamic models of future
plastic flows.
The paper has been structured as follows.
Section 2 explains the methodology and data
collection. Section 3 analyses the results of the
plastic flows and stocks. The article wraps up
with discussion and suggestions in section 4.
Methodology
Material flow analysis (MFA) is a systematic
approach to assess the flows and stocks
through a system that is defined in spatial and
temporal boundary(Brunner & Rechberger,
2016). In this study, the system boundary
consists of the Europe, according to the EU-28
definition in 2014. The one-year snapshot of the
plastic flows used 2014 as a reference year,
while the stocks are estimated from 1960 to
2040. This plastic includes resins, plastic
materials, and thermoplastic elastomers, based
on the definition of the plastics polymers from
the NACE rev.2 (Eurostat, 2008), and the
plastic fibres are also included.
The plastic flows can be divided into four main
phases, including plastic polymer and product
production, consumption, plastic waste
generation and plastic waste treatment. A wide
range of data is needed to establish the plastic
flows. Most of the data are extracted from the
Eurostat databases, including statistics on the
sold production, exports and imports by
PRODCOM (production of manufactured
goods) list, waste generation and treatment
databases. The apparent consumption was
calculated as: production + imports – exports.
For the fraction of plastic contained in the
products, the data was mainly collected from
the commodity guide database established by
the Swedish Chemicals Agency (2015) and
other literature. The net weight per unit of
plastic-containing products was collected from
different sources (e.g.,Forti, Baldé, and Kuehr
(2018), Amazon). The STAN software was
used to do mass balance through data
reconciliation dealing with data uncertainty and
established the Sankey diagram.
Calculation of stocks is based on inflow and
outflow characteristics. With regard to the
inflows, the equation for projection of plastics
consumption has been estimated from the
historical data of per capita consumption(Panda,
Singh, & Mishra, 2010; Plastic Insight, 2016).
The fact that plastics are embedded in different
products (e.g., packaging, construction,
transportation, electrical and electronic
products(EEE) and other), requires considering
lifespans into the calculations of the outflows for
each period. The mean plastic product lifetimes
are applied by estimation based on other
literature (Bakker, Wang, Huisman, & Den
Hollander, 2014; Ciacci et al., 2017; Geyer et
al., 2017; Patel, Jochem, Radgen, & Worrell,
1998). Thus, we combined the plastic
consumption data with the normal distributions
of product lifetime to model the time period of
the plastic products are used until they reach to
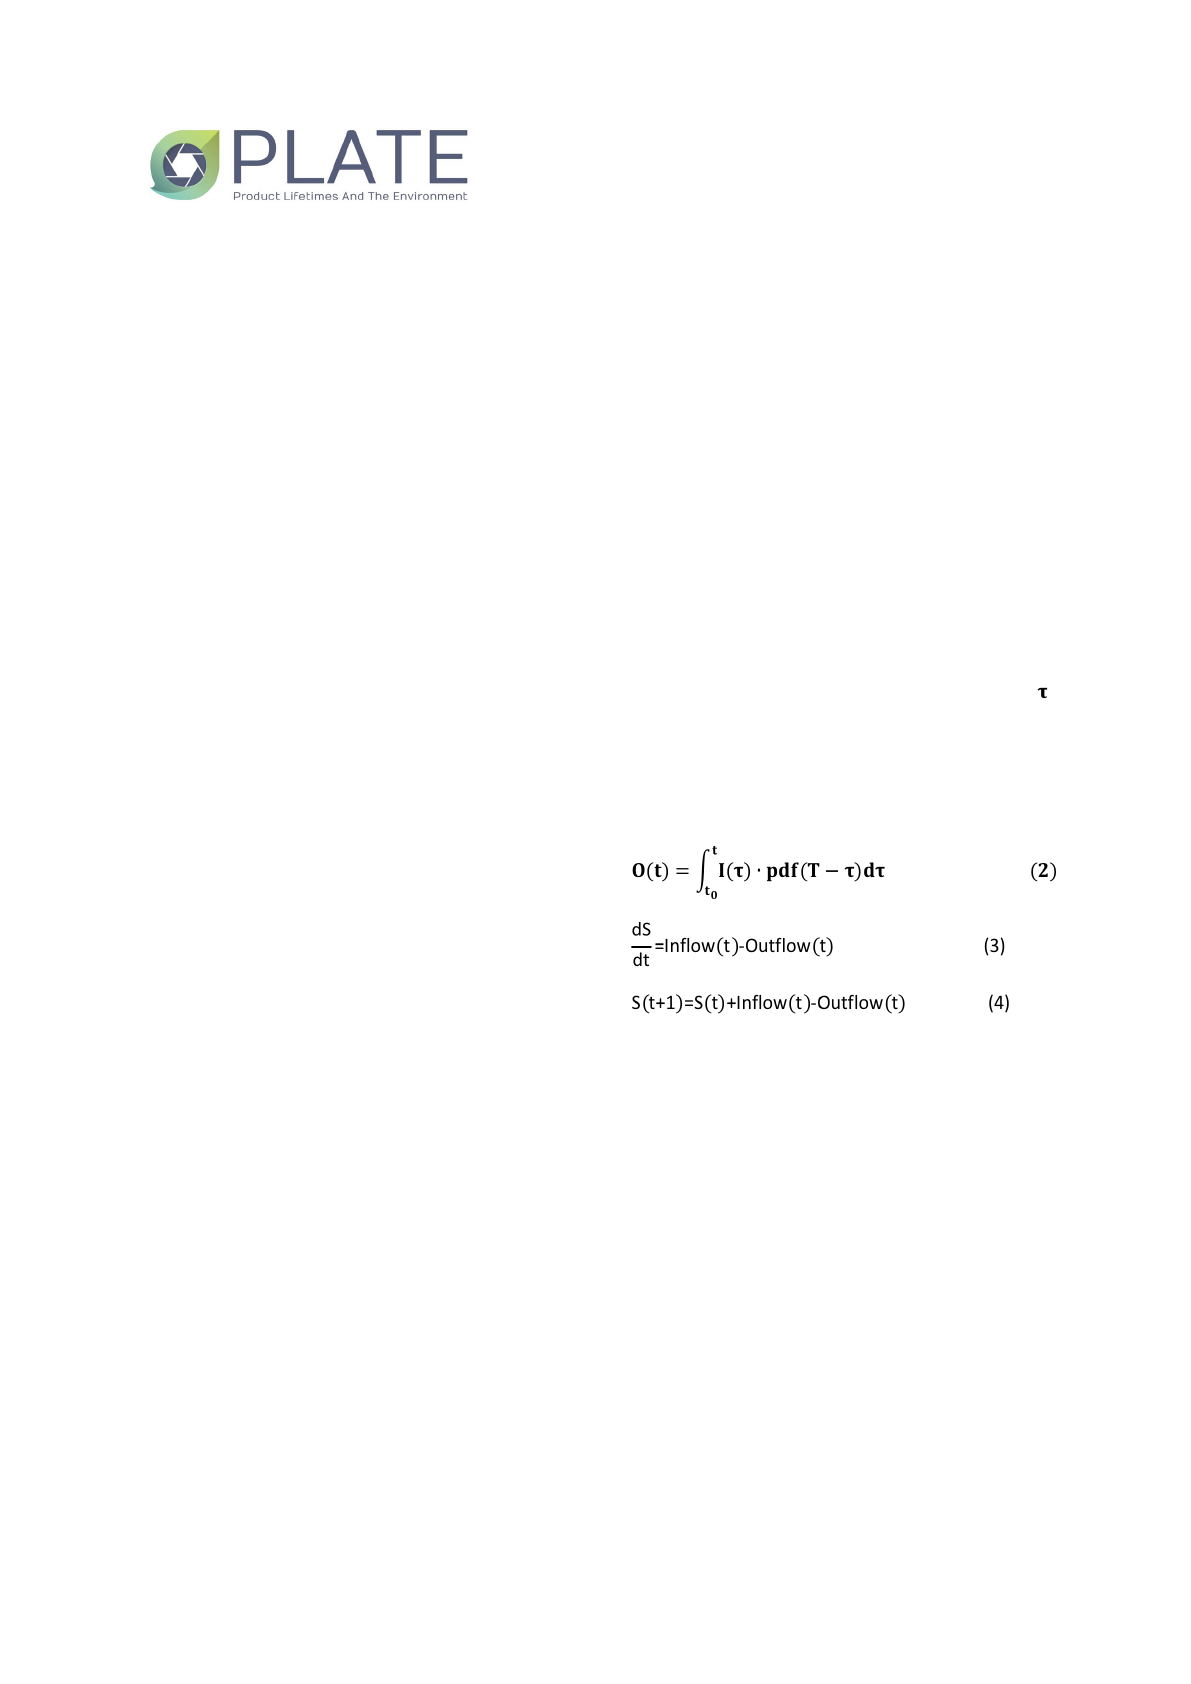
end-of-life stage. The outflow depends on the
delay of product discards, as shown in the
equation (2), where the pdf indicates the
probability density function of lifetime model,
is the age-cohort. The stock change over time
is given by equation (3). The top-down
approach is used to derive the in-use stock
(see Equation (4)). The plastic stocks before
1960 are ignored in this study.
The proportion of plastics used in different
application fields are estimated based on the
annual reports from Plastics Europe. Results
provide projections of future inflow and outflow
of plastic in Europe. Thus, the plastic stocks in
the EU up to 2040 can be forecasted.
371
3rd PLATE Conference Berlin, Germany, 18-20 September 2019
Hsu WT., Domenech T, McDowall W.
Circular economy of plastics: analysis of plastic flows and stocks in Europe
Preliminary results
Plastic flows
Figure 1. Plastic flows in the EU in 2014.
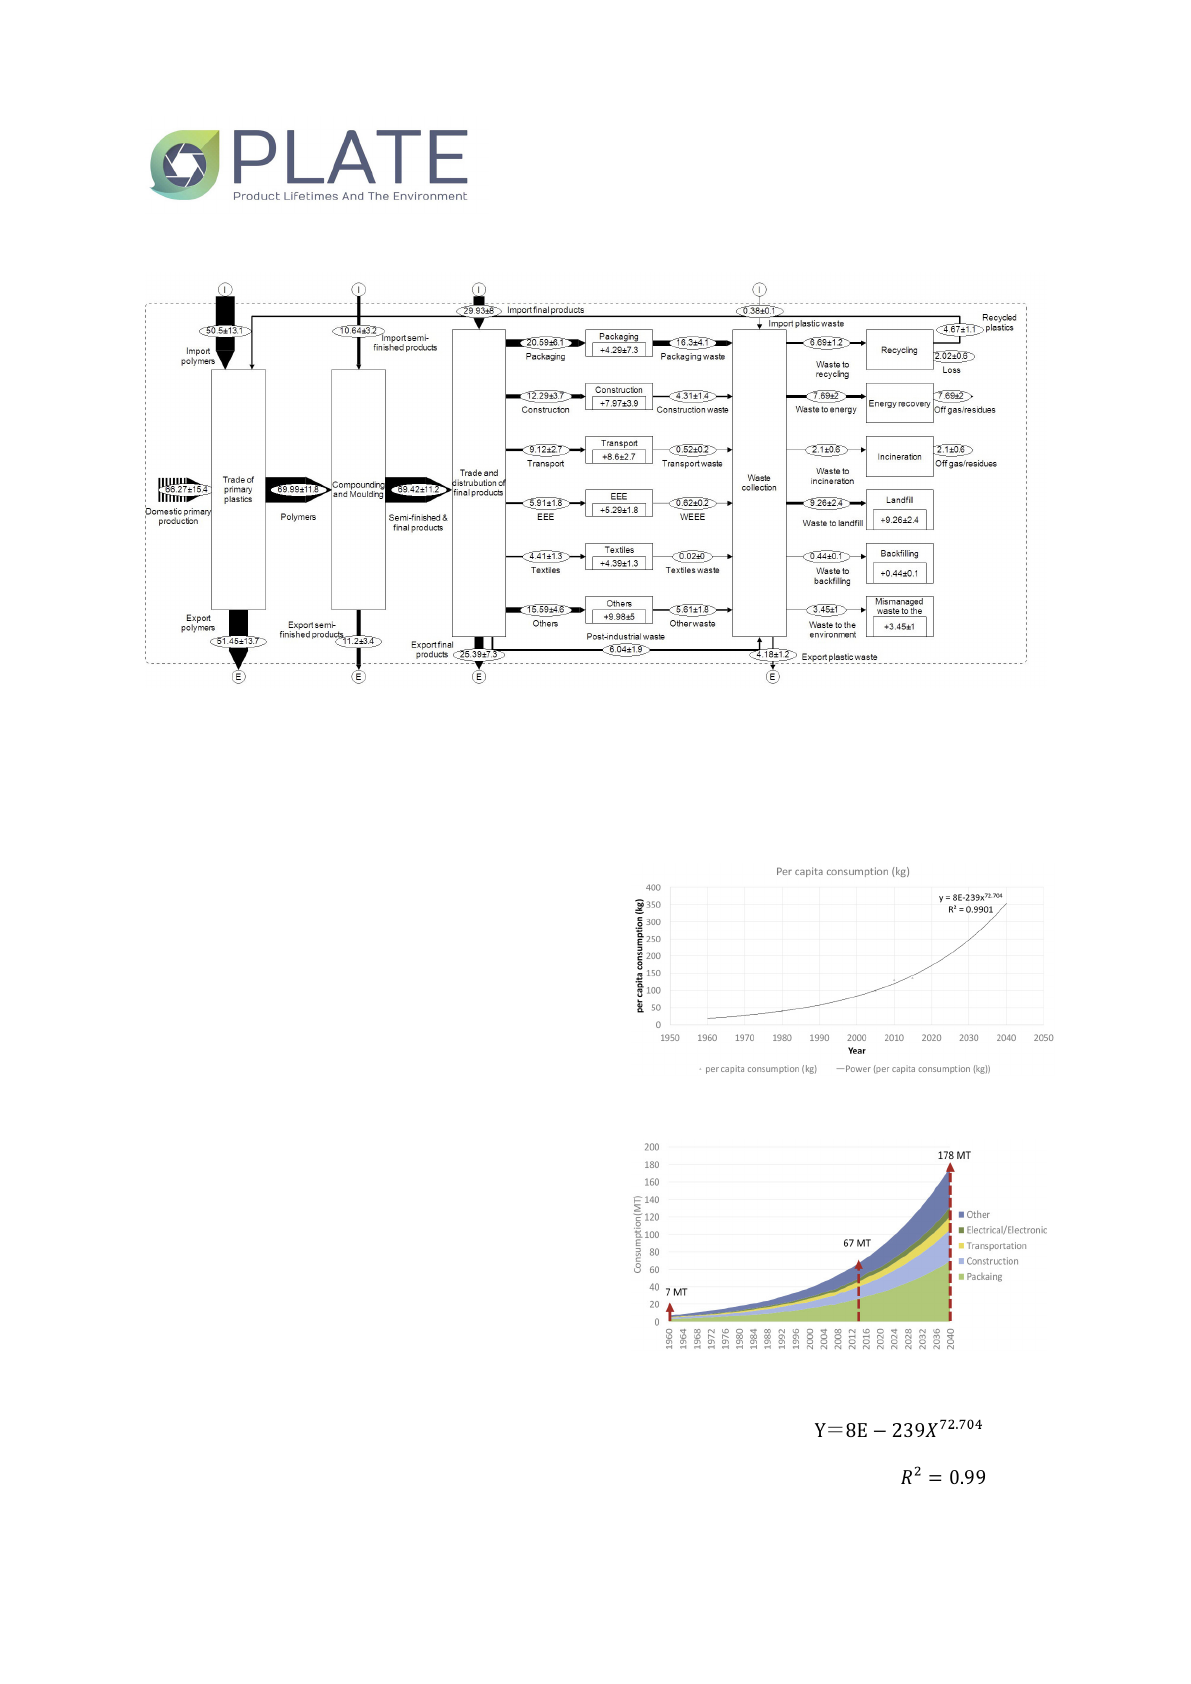
Figure 1 shows the results of plastic flows in the
EU in 2014. The total amount of plastic
polymers production in the EU was 66.27±15.4
million tonnes(MT), whilst 69.42±11.2 MT of
semi-finished products and final products were
produced.
The EU imported 50.5±13.1 MT of primary
polymers, 10.64±3.2 MT of semi-finished
products, and 11.2±3.4 MT final products, while
total exports consist of 51.45±13.7MT of
primary polymers, 11.2±3.4 MT of semi-finished
products, and 25.39±7.3 MT final products.
With regard to consumption, 69.99±11.8 MT
plastic polymers were consumed. The final
products were distributed to different
application fields. Packaging shows the highest
consumption(20.59±6.1MT), followed by
others(15.59±4.6MT), construction(12.9±3.7
MT), transport(9.12±2.7MT), EEE(5.91±1.8MT)
and textiles(4.41±1.3MT).
In the plastic waste generation and treatment
stage, the recycling rate was around 38% which
is relatively high compared to the global
rate(Geyer et al., 2017). However, only 9% of
this was used as secondary plastics to produce
new products (4.67±1.1MT). A significant
amount of the plastic waste did not return back
to the production. This includes relevant losses
during the recycling process (2.02±0.6MT),
around 9.26±2.4 MT entered into the landfill.
Furthermore, around 4.18±1.2 MT plastic waste
was exported to other countries, while a
substantial leakage to environment, which has
been estimated in here at around 3.45±1MT.
Plastic stocks
Figure 2. Projection of plastic consumption.
Figure 3. Inflows of plastics.
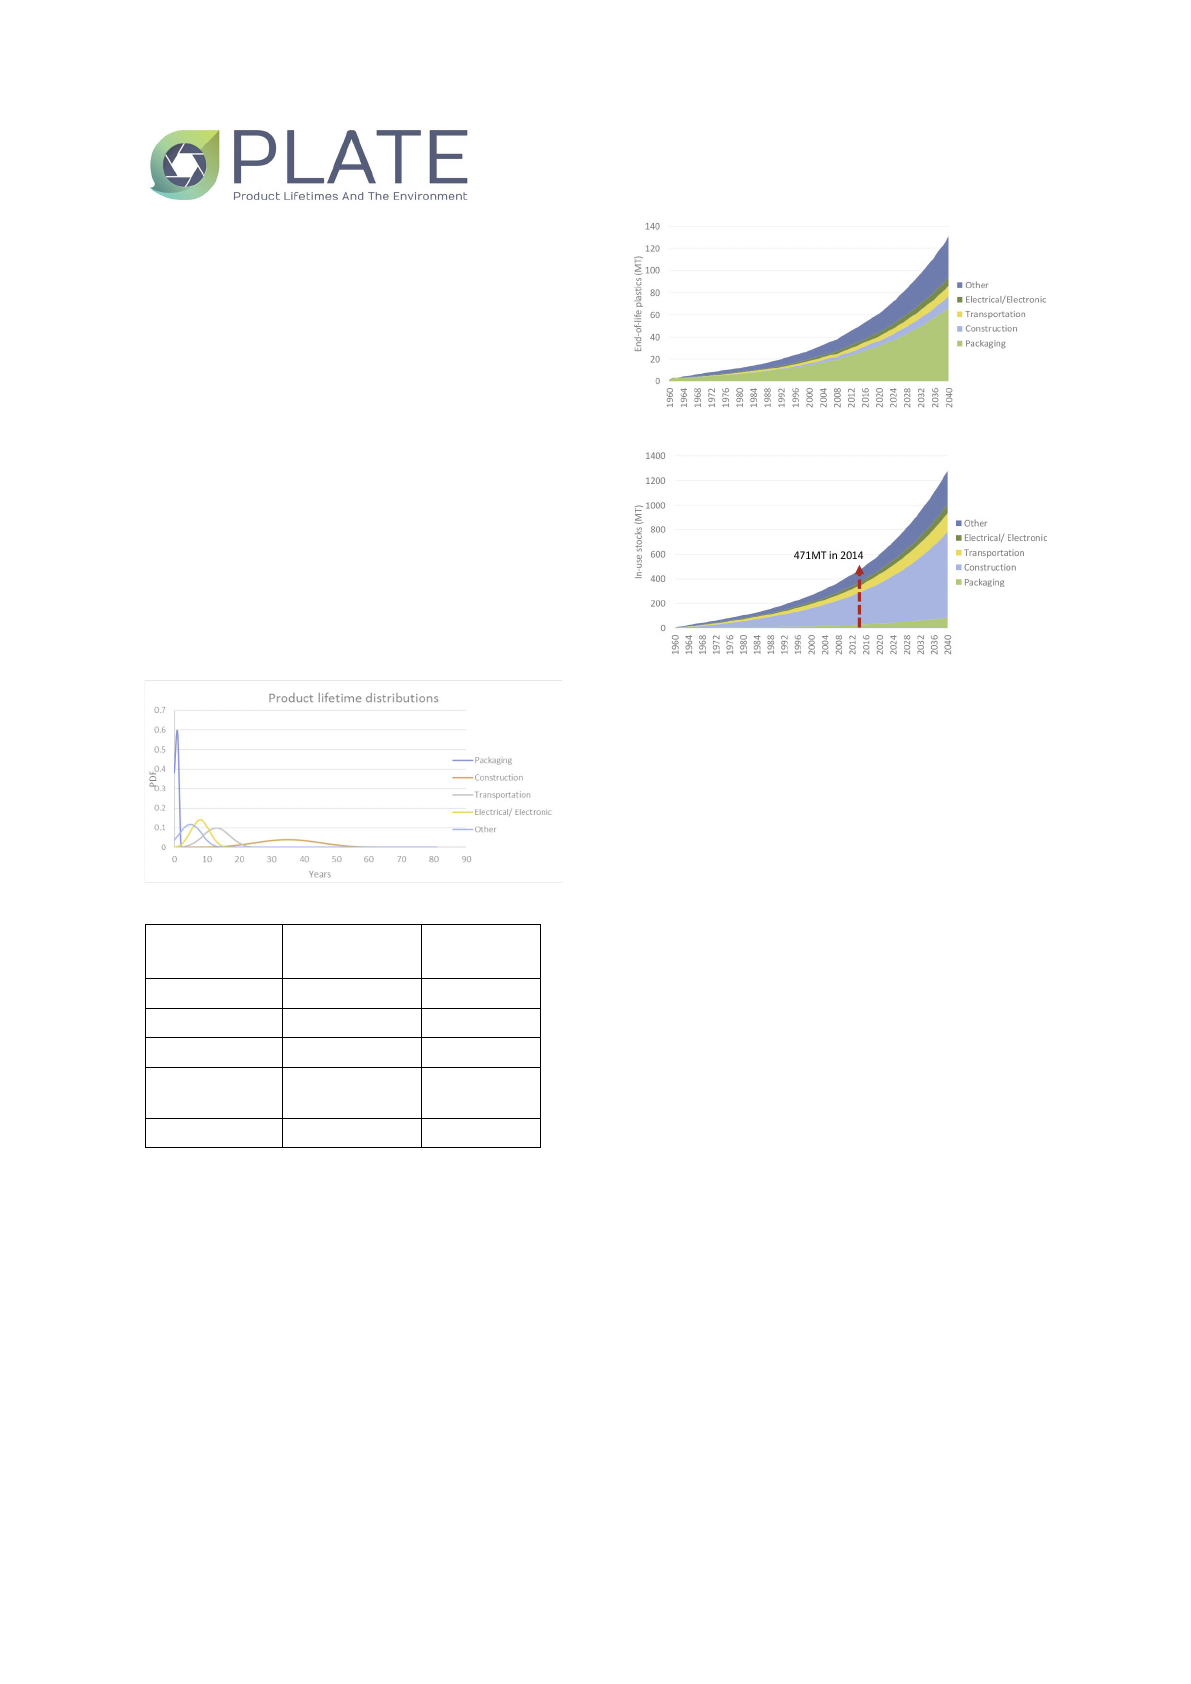
Figure 2 shows the equation for projection of
plastic consumption: , where
y represents per capita plastic consumption,
while x denotes time. The shows
significance between per capita consumption
and time change. The plastic consumption in
372
3rd PLATE Conference Berlin, Germany, 18-20 September 2019
Hsu WT., Domenech T, McDowall W.
Circular economy of plastics: analysis of plastic flows and stocks in Europe
this scenario is expected to continue growing
until 2040.
To be more specific, the plastic consumption in
Europe has increased from 7MT in 1960 to
67MT in 2014, and is expected to reach 178MT
in 2040 (see Figure 3) The projection of plastic
consumption here fits the range of the result
from the one year snapshot of plastic flows.
Next, these inflow data combined with the
product lifetime distributions for five product
application areas can forecast the future waste
generation and in-use stocks. Figure 4 shows
the product lifetime distributions, whereas Table
1 lists the detailed mean values and standard
deviation used in this study. According to our
assumption with normal distributions, the
means ranging from 0.6 year of packaging, to
41 years of the construction.
Figure 4. Product lifetime distributions.
Application Mean
(in years)
Standard
deviation
Packaging 0.6 0.5
Construction 41 10
Transportation 14 4
Electrical/
Electronic
9 3
Other 6 3
Table 1. Mean value and standard deviation for
estimating distribution of product lifespan.
Determining by these lifespans in different
application areas, the outflows from the stock
are estimated in Figure 5. In 2040, overall
outflows are estimated to reach 131MT. Since
there is a significant amount of the inflow of
packaging and its life span is short, the outflow
of packaging is expected to slowly increase,
reaching to 67MT in 2040. This means around
51% of the outflow is generated from the
packaging application area. The plastic
packaging waste remains a significant problem
in the future, if we keep extensive using plastic
packaging.
Figure 5. Outflows of plastics.
Figure 6. In-use stocks of plastics.
Figure 6 displays the change of in-use stocks of
plastics over time. It is clear that the reservoir
amounts of plastic will continue to increase and
reach to 1282MT in 2040. Namely, the
reservoirs are embedded in packaging
(82,992kt), construction (698,573kt),
transportation (153,937kt), electrical/electronic
products (71,775kt), and others (274,540kt).
Clearly, construction dominates the stock-in-
use for a long time due to its long life span.
As there is no decreased of net additions to
plastic stock in the past few years, the plastic
in-use stock is not expected to reach saturation
by 2040 consistent with Krausmann et al.
(2017).
These in-use stocks need to be utilised
efficiently, on the other hands, they would be
future waste. If these future outflows can enter
into the proper recycling system, and also
create the demand for recycled plastics within
the EU, these plastic waste can be reproduced
to be the secondary plastics as the substitution
of virgin plastics.
Conclusions
This study provides a comprehensive overview
of the plastic flows and stocks in Europe. The
dynamic stock model calculates the stock over
time by the inflow and outflow characteristics
of five application areas.
Loading more pages...