
SUSTAINABILITY
SCIENCE
Provisional COVID-19 infrastructure induces large,
rapid increases in cycling
Sebastian Krausa,b,1 and Nicolas Kocha,c
aMercator Research Institute on Global Commons and Climate Change, 10829 Berlin, Germany; bDepartment Economics of Climate Change, Technical
University of Berlin, 10623 Berlin, Germany; and cPotsdam Institute for Climate Impact Research, 14473 Potsdam, Germany
Edited by Susan Hanson, Clark University, Worcester, MA, and approved February 18, 2021 (received for review November 26, 2020)
The bicycle is a low-cost means of transport linked to low risk
of transmission of infectious disease. During the COVID-19 crisis,
governments have therefore incentivized cycling by provision-
ally redistributing street space. We evaluate the impact of this
new bicycle infrastructure on cycling traffic using a generalized
difference in differences design. We scrape daily bicycle counts
from 736 bicycle counters in 106 European cities. We combine
these with data on announced and completed pop-up bike lane
road work projects. Within 4 mo, an average of 11.5 km of
provisional pop-up bike lanes have been built per city and the
policy has increased cycling between 11 and 48% on average.
We calculate that the new infrastructure will generate between
$1 and $7 billion in health benefits per year if cycling habits
are sticky.
urban planning |active travel |generalized difference in differences
The COVID-19 crisis has led to important changes in trans-
port behavior in 2020 (1). Early evidence points to shifts from
public transport to car use as users have reacted to the pandemic
(2). Governments have incentivized cycling as a low-cost, sustain-
able, equitable, and space-saving mode of transport that reduces
the risk of COVID-19 transmission. A key measure has been
the redistribution of street space in cities to create provisional
bike infrastructure typically marked and protected by materi-
als readily available from road construction companies. As of
July 8, 2020, 2,000 km of these infrastructure changes had been
announced in European cities (3).
Transport mode choices are influenced by a variety of behav-
ioral effects that make people stick to their habits, such as status
quo bias, default effects, and time-inconsistent preferences (4).
This complicates the task of policymakers to encourage people to
cycle, particularly in the short run. However, major disruptions
to public transport, such as strikes, cause people to reconsider
their habits (5) and the provision of dedicated infrastructure
has been identified as an important means to increase cycling
(6). Thus, the fast provision of new bike infrastructure dur-
ing the COVID-19 pandemic is a suitable policy experiment
to investigate the responsiveness of cycling under conducive
conditions.
Here, we estimate the causal effect of the post-COVID-19
lockdown rollout of provisional (“pop-up”) bike lanes in Euro-
pean cities. We compile new data on daily bike counts in 106
cities. We connect to the open data application programming
interfaces (APIs) of these cities to download bike counts from
a total of 736 counters. We combine these data with information
on day-to-day kilometer changes in pop-up cycling infrastructure
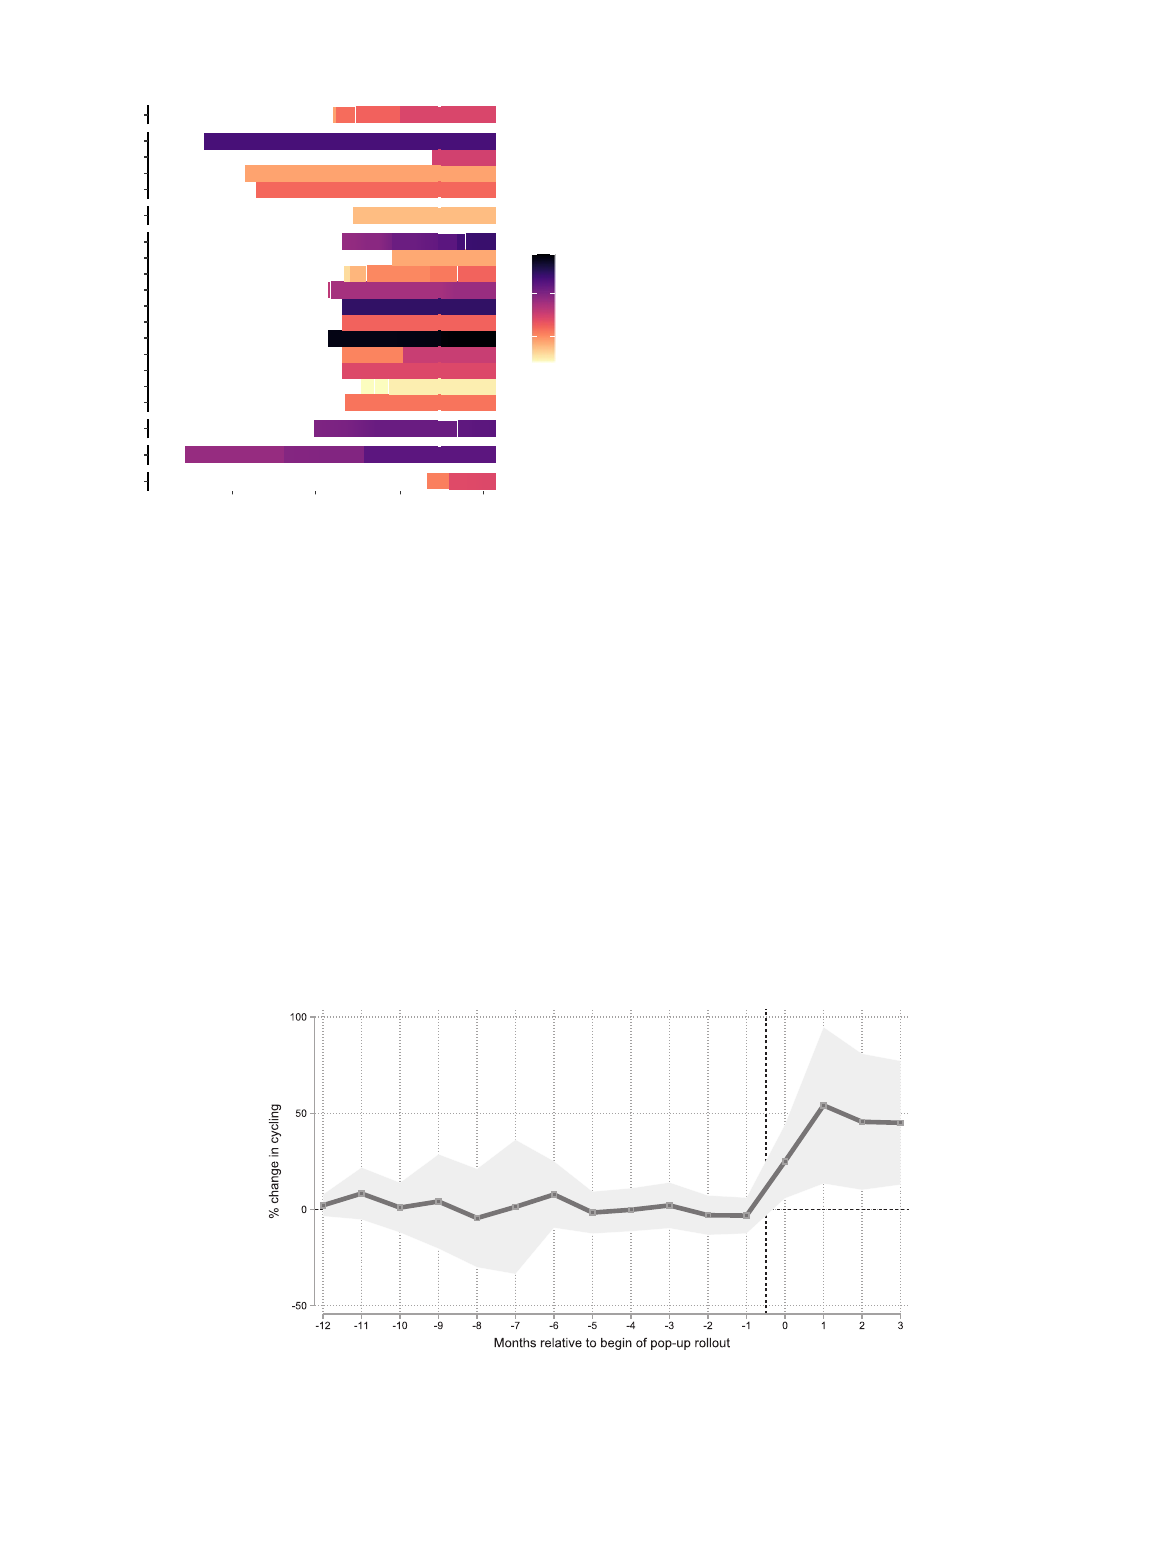
(Fig. 1).
The spatial placement of pop-up bike lanes has mainly been
driven by the availability of street space that could be redis-
tributed without restricting car traffic to one direction and
the existence of “shovel-ready” construction plans. The exact
timing of pop-up bike lane construction is driven by admin-
istrative idiosyncrasies and the availability and schedules of
construction firms. Therefore, the timing of the pop-up bike lane
rollout has been as good as random. This quasi-experimental
setting allows us to address the important concerns that bike
lanes could be built as a reaction to increased cycling traffic
(reverse causality) or that both the implementation of bike lanes
and bicycle counts could be driven by a third factor, such as
local “green” preferences, that cannot be measured (omitted
variable bias).
Results
We use panel regressions to compare bike traffic in treated cities
before and after they get treated with control cities. We find that
pop-up bike lanes have led to substantial increases in cycling.
This effect is robustly visible in comparisons over both a longer
and a shorter time span. First, in Fig. 2 we show the effect
comparing treated and control cities over several months before
and after treatment. Second, in Fig. 3 we provide estimates
from a range of more conservative specifications identifying the
effect based on daily variation within a narrow time window in
the same city.
The outcome in all our regressions is modeled as the natu-
ral logarithm of the cycling count. We use daily variation in this
variable either at the counter or at the city level. Our coefficients
can be interpreted as the average change in cycling caused by the
pop-up bike lane program.
Standard Difference in Differences. Fig. 2 shows the dynamic treat-
ment effect of the pop-up bike lane program. For the analysis
shown here, we define March 2020 as the time of treatment and
plot the estimated differences between treated and control cities
over time. Since we expect cycling to increase in both treated and
Significance
Active travel makes people healthier and creates a wide
range of additional social and environmental benefits. The
provision of dedicated infrastructure is considered a crucial
policy to increase cycling. However, evaluating the impact
of this type of intervention is difficult because infrastructure
changes are typically slow. The rollout of so-called pop-up
bike lanes during the COVID-19 pandemic is a unique empirical
context to estimate the pull effect of new cycling infrastruc-
ture. We show that the policy has worked. We find large
increases in cycling. This result is robust for a variety of
empirical counterfactuals. Further research is needed to inves-
tigate whether this change is persistent and whether similar
results can be achieved in situations outside the context
of a pandemic.
Author contributions: S.K. and N.K. designed research; S.K. analyzed data; and S.K. and
N.K. wrote the paper.y
The authors declare no competing interest.y
This article is a PNAS Direct Submission.y
This open access article is distributed under Creative Commons Attribution-NonCommercial-
NoDerivatives License 4.0 (CC BY-NC-ND).y
1To whom correspondence may be addressed. Email: [email protected].y
This article contains supporting information online at https://www.pnas.org/lookup/suppl/
doi:10.1073/pnas.2024399118/-/DCSupplemental.y
Published March 29, 2021.
PNAS 2021 Vol. 118 No. 15 e2024399118 https://doi.org/10.1073/pnas.2024399118 |1 of 6
Downloaded by guest on January 11, 2022
AT
DE
FI
FRHU
IE
PL
Apr
May
Jun
Jul
Wien
Stuttgart
Köln
Düsseldorf
Berlin
Lahti
Tours
Strasbourg
Rouen
Rennes
Paris
Nantes
Lyon
Grenoble
Chambéry
Caen
Avignon
Budapest
Dublin
Gdańsk
1
10
80
km
Fig. 1. Treated cities and their treatment intensities in terms of imple-
mented kilometers of public bike lanes in service (cumulative) on a given
day between March and July 2020. Cities used in the estimation sample for
Fig. 3 are marked in boldface type. Control cities are plotted in SI Appendix,
Fig. S2. London, Milan, Rome, and Lisbon are missing from the sample due
to a lack of daily bicycle counter data. Data are from the European Cyclists’
Federation (3).
control cities as a reaction to COVID-19, we take the difference
between the cycling increase in treated and in control cities as
our estimate of the average effect of the program. This differ-
ence in differences approach suggests an increase in cycling of
41.6% induced on average by the policy. A crucial assumption
for this research design is that cycling would have evolved on a
parallel trend in the treatment and control group in the absence
of treatment. This is called the common trends assumption. Since
we model the outcome as the natural logarithm of cycling counts,
we make the assumption that cycling would have grown at the
same rate in the treatment and in the control group.
Fig. 2 allows us to verify this assumption. The treatment effect
becomes apparent after the treatment sets in. Before, treat-
ment and control groups have been on the same trend. There
is a slight, albeit statistically insignificant downward trend before
treatment, hinting at the possibility of stronger mobility reduc-
tions due to COVID-19 in cities that have decided to build
pop-up bike lanes. This could for instance be the case because
local and national governments are more likely to take wide-
ranging action if their country is hit by a more intense outbreak.
It could also be due to governments acting upon stronger risk
aversion of their local populations toward cycling in the context
of emptier roads and increased speeding during the lockdown.
We mitigate some of these potential selection into treatment
effects by controlling for COVID-19–related dynamics with fixed
effects at the country–day level. This removes the effect of daily
national-level policy changes, such as lockdowns.
A remaining concern is that bike lanes could have been built
as a reaction to locally increased cycling traffic (reverse causality)
or that both the implementation of bike lanes and bicycle counts
could be driven by an unaccounted third factor (omitted variable
bias). We address these potential biases with regressions focus-
ing on changes over a shorter time span as discussed in the next
section.
Generalized Difference in Differences. In our second set of specifi-
cations (Fig. 3) we investigate more focused comparisons using
both variation in the timing of treatment between cities and vari-
ation in the treatment dose, i.e., the number of kilometers of
pop-up bike lane in service on a given day. With these specifi-
cations we robustify the more simple difference in differences
design by using additional fixed effects and by including con-
trol variables for the weather, for changes in overall mobility
and public transport, and for the number of active bike counters
in a city. Crucially, we look at the effects of pop-up bike lanes
in a shorter time span to investigate potential reverse causality
between cycling and the implementation of pop-up bike lanes.
Although pop-up bike lanes tend to be based on preexisting plans
by city planners or civil society organizations and could therefore
be implemented comparatively quickly, the erection of a bike
lane needs at least a few days’ notice and the exact timing of
these road works depends on the availability and the schedule of
construction firms. This has been confirmed in our conversations
with local policymakers in Berlin and Paris. Our preferred spec-
ifications (Eq. 1) are therefore based on comparisons of cycling
counts on the days before and after a change in the treatment
intensity (marked in blue). These comparisons are created by the
Fig. 2. Treatment effect (difference between treated and control cities) in months before and after the beginning of the pop-up bike lane policy. Obser-
vations are binned into months. Treatment for this plot is hard coded to March 2020 and the baseline category and the beginning of the sample are set to
February 2019. Estimates are from Poisson regressions that include city and country–day fixed effects (SI Appendix, Eq. S1). The shaded area shows the 95%
confidence interval. Data for the outcome variable are from the European Cyclists’ Federation (3) and data for the treatment variable are from municipal
bike counters (Materials and Methods).
2 of 6 |PNAS
https://doi.org/10.1073/pnas.2024399118
Kraus and Koch
Provisional COVID-19 infrastructure induces large, rapid increases in cycling
Downloaded by guest on January 11, 2022
SUSTAINABILITY
SCIENCE
Model:
Treatment definition:
Control group:
Controls:
Poisson
OLS
Binary
KM
KM per sqkm
KM per capita
City level
Treated only
To be treated
Counter FE
City FE
City−week FE
City−calendar week FE
Day FE
Country−day FE
Transit control
0
10
20
30
40
50
% change in cycling
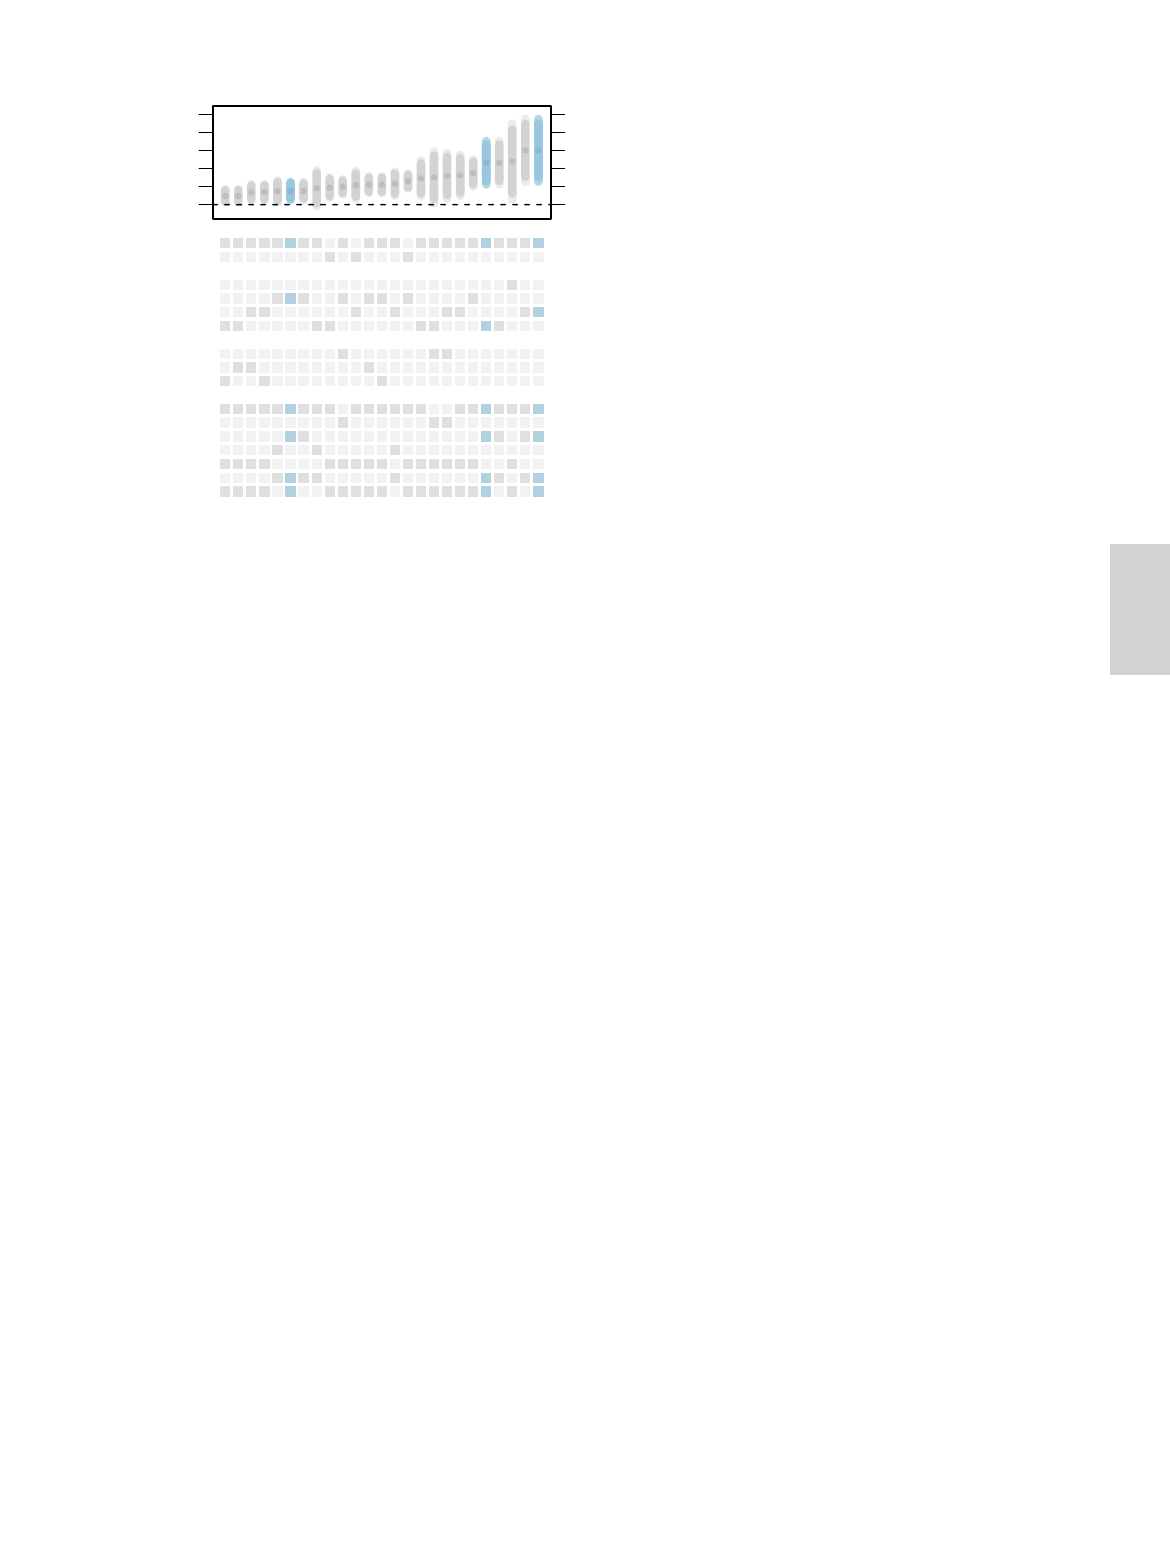
Fig. 3. Estimates of the average effect of pop-up bike lanes on cycling.
Dose–response regressions (in kilometers, kilometers per capita, or kilome-
ters per square kilometer in service on a given day) are multiplied by the
average treatment dose. The 90 and 95% confidence intervals are shown in
darker and lighter color. The unit of observation is the bike counter except
for regressions at the city level. Preferred specifications are marked in blue
(Eq. 1) and are reported in more detail in SI Appendix, Table S5. Gray (and
blue) indicators (Bottom) indicate the type of specification. Three estimates
are from OLS specifications and therefore use the natural logarithm of the
bicycle count as the outcome. All other specifications are Poisson regressions
using the level of the count. Data for the outcome are from the European
Cyclists’ Federation (3) and data for the treatment are from municipal bike
counters (Materials and Methods). All regressions include controls for the
number of active counters in a city on a given day and for the weather (tem-
perature, sunshine, wind, precipitation) (7). All regressions, except those
that rely on observations before 2020, include a control for overall mobility
(8). The transit control is from Apple routing requests (2020 only) (1). Code
is from ref. 9.
inclusion of city–week fixed effect. This fixed effect ensures that
our estimates are based on variation within the same city within
the same week. If the exact (i.e., day-level) timing of the rollout
of pop-up bike lanes has been as good as random, estimates from
these specification are not driven by reverse causality.
Our unit of observation in most regressions is the cycling
counter. This allows us to control for within-city differences
despite doing a cross-city study. We do this by including a counter
fixed effect that flexibly controls for any local confounders that
are time invariant within the time frame of the variation used
in the analysis. We thereby control for the density of public
transport stops, population density, and topography, but also for
additional, unobservable dimensions, such as social capital and
local preferences for green lifestyles, at a high spatial resolution
within the city. With the counter fixed effect we also rule out
that our result is driven by new counters that get placed next to
pop-up bike lanes. We assign treatment to each counter based on
its city, since we measure daily changes in the pop-up bike lane
network at that level. We investigate the effect of this source of
measurement error by defining the treatment dose either as a
binary variable or in terms of kilometers, kilometers per capita,
and kilometers per square kilometer of city area. We find that
measuring the dose–response in terms of kilometers attenuates
the effect (7.6%). This indicates that the effect is not exclusively
driven by the announcement effect of new infrastructure in a city,
but by the de facto availability of new infrastructure in the neigh-
borhood surrounding a counter, which is better approximated by
a measure in per capita or per area terms (estimates of 23.3 and
30.2%, respectively). Remaining measurement error due to some
counters being closer to or farther from new infrastructure than
the rest of the sample is unlikely to be systematic conditional on
fixed effects and control variables (detailed discussion of mea-
surement error in SI Appendix). We also run specifications for
which we take the mean of all counters in a city (marked as city
level in Fig. 3) to show that the effect is not driven by our use of
the counter as the unit of observation.
We use a variable capturing transit routing searches on Apple
maps (1) to control for omitted variable bias that could be
present if changes in public transport affect both pop-up bike
lane construction and cycling. In our preferred specification this
could still be the case, if daily changes in the provision or in the
use of public transport in a city led to new pop-up infrastruc-
ture within the same week. Public officials may for instance have
tried to schedule the erection of pop-up bike lanes for the same
day as planned public transport disruptions. The transit control
removes this potential remaining bias. Since the Apple data are
available only for a subset of larger cities in our sample (marked
in boldface type in Fig. 1), we run our main regressions (Fig. 3)
on this smaller sample. SI Appendix, Table S4 shows robustness
to lifting this sample restriction and to excluding Paris, which has
had the strongest treatment, from the analysis.
We control for subnational changes in policies and behaviors
related to COVID-19 with a variable that captures overall human
mobility based on Facebook user movements. We control for the
number of counters active in a city on a given day to account
for unusual traffic situations, for instance when a counter gets
shut down because of road works. We also include control vari-
ables for daily total precipitation and mean wind, temperature,
and sunshine to address the concern that both the scheduling of
pop-up bike lane construction work and daily variation in cycling
could have been driven by weather conditions.
We check the sensitivity of our results to changing the time
span of our identifying variation and to reshaping our treatment
and control group definitions (additional specifications in Fig.
3). The effect is robust to including days from the same calen-
dar week in previous years in these comparisons rather than days
from 2020 only. We also provide estimates for the effects of the
policy based on comparisons between 1) treated and untreated
cities, 2) treated cities using only their variation in treatment
timing, 3) cities that are already treated and those that have
announced only pop-up bike lanes, and 4) treated cities only
using their variation in treatment dose and treatment timing.
Heterogeneity Analysis. We investigate how the treatment effect
of pop-up bike lanes varies depending on relevant features of
the cities in our sample (Table 1). These heterogeneous effects
should not be interpreted causally, since we cannot control
for additional omitted variable bias or reverse causality cre-
ated by the inclusion of these variables in our model. We find
that the effect of pop-up bike lanes is stronger in cities with a
higher population density [1] and a higher modal share of public
transport in commutes [2], which are correlates of a built envi-
ronment favoring active travel. The treatment effect is lower
for cities with faster average speeds of car commutes [6] and
for cities with more road death per capita [7]. It is also lower
for cities with more cars per capita [5]. However, this estimate
is imprecise. These heterogeneities confirm research that found
that US cities with better safety, low car ownership, and more
density have more cycling (10, 11).
Our analysis also shows that the baseline length of the bike
lane network per capita [3] is correlated with a lower treatment
effect. We interpret this as an indication that the pop-up bike
lane effect is a phenomenon of catch-up growth in cities with
a high cycling potential that was previously impeded by missing
infrastructure. The effect of baseline cycling modal shares [4] is,
however, statistically unclear.
Further research could also look at the effect of pop-up bike
lanes in terms of improvements in bike lane network connectivity
Kraus and Koch
Provisional COVID-19 infrastructure induces large, rapid increases in cycling
PNAS |3 of 6
https://doi.org/10.1073/pnas.2024399118
Downloaded by guest on January 11, 2022

Table 1. Heterogeneous treatment effects of the pop-up bike lane rollout
×baseline (natural log) of
[1] [2] [3] [4] [5] [6] [7]
Population PT modal Bike lanes Cycling modal Cars Car commute Road deaths
density share per capita share per capita speeds per capita
Pop-up treatment 0.221* 0.258*** −0.194* 0.093 −0.592 −0.509** −0.351***
(0.121) (0.100) (0.115) (0.082) (0.485) (0.233) (0.058)
N 59,521 27,486 24,611 27,486 34,408 26,886 34,922
Estimates are based on the interaction term of the treatment variable (in kilometers per city area) and the natural logarithm of the heterogeneity
variables (column names). Coefficients are scaled to the average treatment dose in our sample. They can be interpreted as the unit change in cycling if a
heterogeneity variable is one unit higher (when assuming treatment with an average pop-up bike lane program). All regressions include counter, city–week,
and country–day fixed effects. They also include weather controls (7), a control for overall mobility (8), and a control for the number of counters active in a
city on a given day. Data for the outcome variable are from the European Cyclists’ Federation (3) and data for the treatment variable are from municipal bike
counters (Materials and Methods). All heterogeneity variables except for bike lanes per capita (17) are from the European Urban Audit (18, 19). Standard
errors clustered at the city level are reported in parentheses. Significance levels are *P<0.1, **P<0.05, ***P<0.01.
and directness as proposed by ref. 12 and other more complex
measures of a bike lane network, such as the level of protec-
tion of a bike lane and the treatment of intersections (13). In
this context it is important to investigate how underserved com-
munities can be provided with a pop-up bike lane network that
is complete and inclusive and how additional political, cultural,
and economic barriers to cycling for low-income and minority
groups can be removed (14). Bike sharing can support changes
in modal choice (15), but important barriers to adoption remain
for underrepresented groups (16). We therefore think it would
be valuable to investigate interactions between the pop-up bike
lane policy and time series data on bike sharing policies including
changes in pricing and the availability of bikes and stations.
Discussion
We find robust evidence for substantial short-run increases
in cycling in European cities due to new provisional cycling
infrastructure. Independent of its potential impacts in reducing
COVID-19 transmission, the net benefits of the intervention are
likely to be large. The direct cost of cycling infrastructure is low.
At the higher end, 1 km of bike lane in Sevilla has previously
cost e250,000 (20). However, Berlin’s approach of iterative plan-
ning with provisional infrastructure during the pandemic has for
instance reduced costs to e9,500/km as of July 2020 (21). These
costs are small compared to the substantial health benefits from
the new infrastructure. Previous research has found that every
kilometer of cycling generates health benefits of $0.45 (22). As
a complementary and more stylized analysis, we combine this
estimate from the literature with our econometric estimates of
policy-induced cycling increases to provide a projection of health
benefits generated by pop-up bike lane programs. We calcu-
late baseline values for total cycling in a city based on data on
daily kilometers cycled in German cities in 2018 and extrapo-
late these numbers to the other European cities in our sample
based on city-level data on transport and population (Materials
and Methods). This extrapolation is approximate but sufficient
to calculate a range of potential health benefits. Based on our
regression-based estimate for the 95% confidence interval of
the “treatment dose” in terms of kilometers per square kilo-
meter, we project that the additional cycling induced by the
pop-up bike lane treatment during its first months of operation
has generated between $0.5 and $1.7 billion in health benefits.
Thus, the new infrastructure may generate between $2.2 and $6.9
billion/y in health benefits if the new bike lanes become perma-
nent and make cycling habits stick. We project this range to be
between $1.2 and $3.5 in annual health benefits if we use our
alternative estimate for the 95% confidence interval of the pol-
icy effect based on the “treatment dose” in terms of kilometers
per capita.
The magnitude of our estimate is large compared to previous
evaluations of new cycling infrastructure improvements that have
found statistically unclear or modest effects, typically because
of the limited scale of the interventions (23–25). Our estimate
implies a higher responsiveness of cycling to new infrastructure
than the associations found in cross-sections of US cities (10, 26).
However, in cities in Europe (17) and the United Kingdom (27)
additional infrastructure is associated with more cycling than in
the United States. The case of Sevilla has shown that in a dense
city with a high share of narrow, cycling-friendly roads the con-
struction of bike lanes on major roads can create substantial
cycling growth: 120 km of new bike lanes have led there to a
fivefold increase of cycling between 2006 and 2011 (20). Simi-
larly, pop-up bike lanes have often been placed on main roads.
Thereby they have removed important bottlenecks for cyclists
and generated important improvements for the overall cycling
network. Many of the cities in our sample are fundamentally well
suited for cycling. For instance, they are often dense and have a
high share of side roads with slow car speeds. Therefore, they
can be assumed to have a high potential for catch-up growth,
which is one explanation for our larger effect estimate. In addi-
tion, the pandemic has led to a reshuffling of otherwise rather
inelastic mobility choices and thus created the conditions for new
infrastructure to induce shifts to active travel. However, this also
means that our results cannot be directly generalized to other
settings. Given this limitation in terms of external validity, we
caution against an overinterpretation of our estimates as pro-
viding a benchmark value for increases in cycling that planners
should expect from an additional kilometer of bike infrastruc-
ture. It remains to be evaluated whether the new bicycle use is
sticky and how similar treatments influence behavior outside of
the context of a pandemic.
Surveys indicate that separated, protected infrastructure is a
key element to incentivize uptake of cycling (28–30). Cities have
experimented with different measures to create new spaces for
cycling, ranging from painted to provisionally protected bike lanes
and from traffic calming with signs to built “modal filters” that
prevent the passage of cars. Our data on pop-up infrastructure do
not allow us to systematically distinguish between these types of
interventions and the quality of their implementation.∗Further
research should investigate which types of infrastructure have
more successfully increased cycling by previously underrepre-
sented groups, such as women, older people, and children.
*In SI Appendix, Table S3 we show that the results are robust to specifying treatment in
terms of 1) the total length of all types of infrastructure, 2) the total length of measures
clearly marked as bike lanes in the data, 3) the number of measures, and 4) a binary
indicator for treatment.
4 of 6 |PNAS
https://doi.org/10.1073/pnas.2024399118
Kraus and Koch
Provisional COVID-19 infrastructure induces large, rapid increases in cycling
Downloaded by guest on January 11, 2022

SUSTAINABILITY
SCIENCE
Materials and Methods
Bicycle Counter Data. We connect to municipal Open Data Portals to obtain
daily bicycle counts from bike counters in large- and medium-sized cities
in 20 European countries. The raw data and code to download counter
data are included in our code package (31). The outcome is modeled as the
natural logarithm of cycling counts. This means that we investigate percent-
age changes rather than absolute increases in the number of cyclists. Our
outcome varies daily at the counter level (summary statistics and cleaning
procedures in SI Appendix).
Bike Lane Data. The data on planned and completed pop-up infrastructure
projects have been collected and crowdsourced by the European Cyclists’
Federation based on technical reports and media announcements. A visual-
ization of the data can be accessed at https://ecf.com/dashboard. We merge
these data with city polygons from the European Urban Audit 2020 (32) to
generate a cumulative measure for the total number of pop-up bike lanes
in service in a city on a given day (summary statistics and cleaning proce-
dures in SI Appendix). We generate a range of treatment variables (binary,
kilometers built, kilometers per capita, kilometers per square kilometer of
city area) and assign this treatment to counters based on their city polygon.
Control Variables. Using fixed effects in our regressions, we remove and
therefore control for time-invariant differences between cities and between
the locations of the individual counters in our data. Therefore, any addi-
tional time-invariant control variables at the city and the counter level
would be redundant in our analysis. We also use fixed effects interacting
different spatial levels with time dimensions, thereby controlling for many
time-varying observable and unobservable factors. We use additional con-
trols to rule out any bias that may be introduced by time-varying factors
below our fixed effect levels.
We control for daily changes in public transport supply and demand with
the transit variable from the Apple COVID-19 Mobility Trends Reports (1).
This variable captures daily variations in the number of requests for pub-
lic transport directions on Apple Maps. We access these data using the
covmobility package (33).
We capture average human mobility throughout the phase of the COVID-
19 pandemic starting in March with a human mobility index based on
Facebook data (8). The index is from a dataset called “movement range
maps” that Facebook shares after aggregating individual user movements
for humanitarian and research purposes with a reference to the principles
outlined by epidemiologists and public health researchers (34). It measures
the number of daily 600-m grid cells visited by Facebook users compared to
a baseline in February. For most of our sample the index is aggregated to
the state level, where we use the data. On average, in our sample period
daily mobility has been below the February baseline.
We use weather data from the ERA5 climate model that generates hourly
measures of surface temperature, ultraviolet (UV) radiation, precipitation,
and wind at a 0.25◦×0.25◦resolution (7). We use the ecwmfr package (35)
to aggregate this to the European Union Urban Audit city polygons (32) at
the daily level.
Heterogeneity Variables. We analyze heterogeneous treatment effects
along seven city-level variables. Bike lanes per capita measures the length
of the bike lane network in a city based on Open Street Map data (17, 36).
Population density is from the European Urban Audit (19). Public transport
(PT) modal share, cycling modal share, cars per capita, car commute speeds,
and road deaths per capita are based on city transport statistics from Euro-
stat (18). We use the natural logarithm of these variables to obtain the unit
change in cycling for a unit change in the respective heterogeneity variable.
Empirical Strategy. We estimate a panel regression model at the counter
level with daily counts of cyclists as the outcome variable and the number of
kilometers (kilometers, kilometers per capita, or kilometers per square kilo-
meter of city area) of pop-up bike lanes in service in a city on a given day
as the treatment. This regression analysis forms comparisons between treat-
ment and control groups before and after treatment for each cohort of new
bike lanes and for different treatment intensities (generalized difference
in differences). This separates the effect of pop-up bike lanes from over-
all changes in cycling due to COVID-19. We use a set of indicator variables
(fixed effects) that remove remaining variation from our estimation sample
that would otherwise bias our estimates. Our study design thus allows for
systematic differences in the level of bike traffic between treatment and
control groups, but relies on a common trends assumption, that bike traffic
in treated and control cities would have evolved on a parallel trend in the
absence of treatment. We cannot observe treated units in their untreated
state after treatment (potential outcome). However, we can investigate
pretreatment trends between treated and control cities and check the sen-
sitivity of our estimates to changes in the control group definition, i.e., in
the way we construct the empirical counterfactual (Fig. 3).
In our preferred specification we model the relationship between cycling
traffic and the pop-up bike lane treatment as
ln Countid =βBike Lanescd +Xcd +λi+σcw +ϕnd +εid [1]
where iindexes a counter, ca city, na country, da day, and wa week.
λiis a counter fixed effect that controls for time-invariant factors at
a high spatial resolution. σcw is a city–week fixed effect that controls for
week-specific time-varying factors, thereby restricting identifying variation
to days before and after treatment within the same week in the same city.
ϕnd is a country–day fixed effect that captures any daily changes common
to all cities in a country.
We cannot include fixed effects for factors that vary at the city level over
time, such as local mobility or weather, since this is the geographical level
at which our treatment is measured. Xcd is a vector of control variables
that account for these factors. It includes an index for public transport use
from Apple (1), an index for overall mobility based on Facebook data (8),
weather variables (temperature, UV radiation, wind, precipitation) (7), and
the number of counters per city active on a given day.
The coefficient of interest is β. It captures the effect of the pop-up bike
lane treatment on bicycle counts. Our treatment variable is defined either as
a binary indicator for treatment or as the number of kilometers (kilometers,
kilometers per capita, or kilometers per square kilometer of city area) of
pop-up bike lanes in service on a given day.
Figs. 2 and 3 and Table 1 present the transformed estimate 100 ×
(exp β−1).
Since our outcome is a count variable, we use Poisson pseudo–maximum-
likelihood (PPML) regressions to estimate this model (37). As a robustness
check we also use ordinary least squares (OLS) with the natural logarithm of
the bicycle count as the outcome (Fig. 3). We cluster standard errors at the
city level, where treatment is assigned (38).
Calculating the Health Benefits. We calculate the health benefits by com-
bining our regression estimates of cycling increases for each kilometer of
pop-up bike lane with an estimate of the average health benefits of a kilo-
meter cycled ($0.45 converted from 0.62 Australian dollars), which is lower
than typical values from the gray literature (22). Our dose–response regres-
sions give us the percentage increase in cycling per kilometer of bike lane
divided by the city size or city population. For each city in our sample we
multiply this effect by the size of its pop-up bike lane program. We then con-
vert this result into additional kilometers cycled in a city based on baseline
values of kilometers cycled per person from a detailed transport behavior
survey in 135 German cities (39). We impute values of kilometers cycled
for other European cities based on ordinary least-squares regressions using
information on baseline values of a city’s modal split (trips) of commutes,
its population density, the length of its initial bike lane network, the modal
share of public transport, the number of cars per capita, the average speed
of car commuting, and road deaths per capita (more detail in Heterogeneity
Variables).
Data and Code Availability. Raw data and code have been deposited in
Zenodo (DOI: 10.5281/zenodo.3973038) (31).
ACKNOWLEDGMENTS. We thank Ben Thies and Lennard Naumann for their
excellent research assistance.
1. Apple, Mobility trends reports (2020) https://www.apple.com/covid19/mobility.
Accessed 18 July 2020.
2. H. H. Chang, C. Meyerhoefer, F. A. Yang, Covid-19 prevention and air pollu-
tion in the absence of a lockdown. https://www.nber.org/system/files/working
papers/w27604/w27604.pdf. Accessed 23 March 2021.
3. ECF, COVID-19 cycling measures tracker (2020) https://ecf.com/dashboard. Accessed
24 July 2020.
4. L. Mattauch, M. Ridgway, F. Creutzig, Happy or liberal? Making sense of behavior in
transport policy design. Transport. Res. Transport Environ. 45, 64–83 (2016).
5. S. Larcom, F. Rauch, T. Willems, The benefits of forced experimentation: Strik-
ing evidence from the London underground network. Q. J. Econ. 132, 2019–2055
(2017).
6. J. Pucher, J. Dill, S. Handy, Infrastructure, programs, and policies to increase bicycling:
An international review. Prev. Med. 50, S106–S125 (2010).
Kraus and Koch
Provisional COVID-19 infrastructure induces large, rapid increases in cycling
PNAS |5 of 6
https://doi.org/10.1073/pnas.2024399118
Downloaded by guest on January 11, 2022
Loading more pages...