
applied
sciences
Article
Combining Signal Features of Ground-Penetrating Radar to
Classify Moisture Damage in Layered Building Floors
Tim Klewe 1,* , Christoph Strangfeld 1, Tobias Ritzer 2and Sabine Kruschwitz 1,3
Citation: Klewe, T.; Stragfeld, C.;
Ritzer, T.; Kruschwitz, S. Combining
Signal Features of Ground
Penetrating Radar to Classify
Moisture Damage in Layered
Building Floors. Appl. Sci. 2021,11,
8820. https://doi.org/10.3390/
app11198820
Academic Editors: Jerzy Hoła and
Łukasz Sadowski
Received: 29 July 2021
Accepted: 15 September 2021
Published: 23 September 2021
Publisher’s Note: MDPI stays neutral
with regard to jurisdictional claims in
published maps and institutional affil-
iations.
Copyright: © 2021 by the authors.
Licensee MDPI, Basel, Switzerland.
This article is an open access article
distributed under the terms and
conditions of the Creative Commons
Attribution (CC BY) license (https://
creativecommons.org/licenses/by/
4.0/).
1Bundesanstalt für Materialforschung und-Prüfung (BAM), 12205 Berlin, Germany;
2Ingenieurbüro Tobias Ritzer GmbH, Lindenbachstrasse 29, 91126 Schwabach, Germany;
3Technische Universität Berlin, 10623 Berlin, Germany
*Correspondence: [email protected]
Abstract:
To date, the destructive extraction and analysis of drilling cores is the main possibility
to obtain depth information about damaging water ingress in building floors. The time- and cost-
intensive procedure constitutes an additional burden for building insurances that already list piped
water damage as their largest item. With its high sensitivity for water, a ground-penetrating radar
(GPR) could provide important support to approach this problem in a non-destructive way. In this
research, we study the influence of moisture damage on GPR signals at different floor constructions.
For this purpose, a modular specimen with interchangeable layers is developed to vary the screed
and insulation material, as well as the respective layer thickness. The obtained data set is then
used to investigate suitable signal features to classify three scenarios: dry, damaged insulation, and
damaged screed. It was found that analyzing statistical distributions of A-scan features inside one
B-scan allows for accurate classification on unknown floor constructions. Combining the features
with multivariate data analysis and machine learning was the key to achieve satisfying results. The
developed method provides a basis for upcoming validations on real damage cases.
Keywords:
non-destructive testing; ground-penetrating radar; signal features; material moisture;
classification; machine learning; moisture measurements; building floors; civil engineering
1. Introduction
More than half of the building insurance claims in Germany (53%) are caused by piped
water damage, which entailed costs of over 3 billion Euro in 2019 alone [
1
]. One reason
for this, apart from generally ageing pipe systems, is that water leakage often remains
unrecognized until signs of degradation become noticeable. At that point the extent of
damage is already critical, which underlines the demand of an accurate determination and
localization of water ingress.
Neutron probes [
2
] are already successfully applied on building floors to localize the
source of damage and to identify affected areas. The radiated fast neutrons lose most
of their kinetic energy when colliding with low-mass atoms. This is especially true for
hydrogen. As a result, the fast neutrons are transformed into slow (thermal) neutrons,
which are then detected by a counter tube inside the probe. Given that, the method is highly
sensitive to moisture, however it cannot distinguish between chemically bound or fluid
water. Therefore, a calibration must be done by the destructive extraction of drilling cores.
These cores are also the only possibility to obtain additional information about the depth of
moisture penetration. This is a time- and cost-intensive procedure, especially for building
floors, where knowledge about the affected layer is essential to plan and perform efficient
renovations. Here, ground-penetrating radar (GPR) can serve as a suitable addition to the
neutron probe in order to classify common moisture damages in layered building floors in
a non-destructive way.
Appl. Sci. 2021,11, 8820. https://doi.org/10.3390/app11198820 https://www.mdpi.com/journal/applsci

Appl. Sci. 2021,11, 8820 2 of 16
The sensitivity of GPR for water has already been proven in many publications,
especially in geophysics [
3
,
4
]. However, in civil engineering (CE), GPR is also increasingly
being applied for non-destructive moisture measurements on building materials like
asphalt, concrete, and screed [
5
–
10
]. Here, various methods have already been established.
However, their adequate use and suitability highly depends on the particular case. Due
to numerous possible uncertainties, like the given structure, installed materials, and layer
thicknesses, interpreting GPR results is not straightforward and requires the expertise of
trained personnel. These uncertainties often influence the same signal features that are
used for moisture measurements (see Section 1.1). Here, relying on only one feature, as it is
done in most of the related publications [11], can lead to high uncertainty.
In contrast, this work pursues the strategy of combining different features, which
allows the use of multivariate data analysis. It aims to achieve an automated classification
of three scenarios: (1) the dry state, (2) damaged insulation, and (3) a damaged screed,
all of them on unknown floor constructions. This is accomplished by a machine learning
approach trained with novel radargram features that consider the spatial continuity of the
present damage. The features are extracted from an experimentally measured data set,
including varying materials and layer thicknesses. Before discussing the methodology in
Section 2, a short introduction to moisture measurements with GPR is given.
1.1. Moisture Measurement with GPR
Besides the mostly negligible conductivity and magnetic permeability, the electric per-
mittivity
ε
is the governing material parameter for moisture measurements with
GPR [12,13]
.
This gets particularly clear by comparing
ε
for dry concrete and water. Whereas the for-
mer lies between 2 to 9 [
14
], the latter shows values around 81. This difference causes a
significant rise for wet concrete (between 10 to 20), which influences various propagation
characteristics of the electromagnetic (EM) waves. By analyzing specific time-,
amplitude-,
or frequency-based features of the received signals, these water-related influences become
measurable. A detailed review of those features typically used for moisture measurement
with GPR in CE is presented in [11]. However, a short overview is given in the following.
First, the velocity
v
of an EM wave is directly related to
ε
. For non-magnetic conditions,
as it is usually the case in building materials, it can simply be calculated as follows [
14
,
15
]:
v=c
√ε=2D
T, (1)
where
c
is the velocity of EM waves in free space, and
T
the two-way travel time in a
material with the thickness
D
. Comparing the dry state of a material, sent and reflected
pulses are received later for rising moisture content. Furthermore, the intensities and thus
the measured amplitudes are reduced due to higher attenuations, caused by generally in-
creased conductivity and more frequently occurring scattering events on water-filled pores.
Filled pores also lead to Rayleigh scattering [
16
], which is one way to explain the observable
shift of the received signals to lower frequencies for higher moisture content. Another
explanation is given with the presence of dielectric dispersion, presented in the popular
models of Debye [
17
] and Cole–Cole [
18
]. It describes the rising imaginary part of
ε
and
the resulting absorption of higher-frequency components close to the relaxation frequency,
which is 10 GHz to 20 GHz for free water [
15
,
19
], but can be smaller for porous materials.
Another important characteristic of EM waves is the occurrence of reflection and transmis-
sion on material boundaries with different permittivities. With
ε1
and
ε2
of two mediums,
an EM wave travelling from medium 1 to medium 2 is reflected by the amount of the
reflection coefficient r∈[−1, 1], which is calculated as follows [20]:
r=√ε1−√ε2
√ε1+√ε2
(2)
.
Appl. Sci. 2021,11, 8820 3 of 16
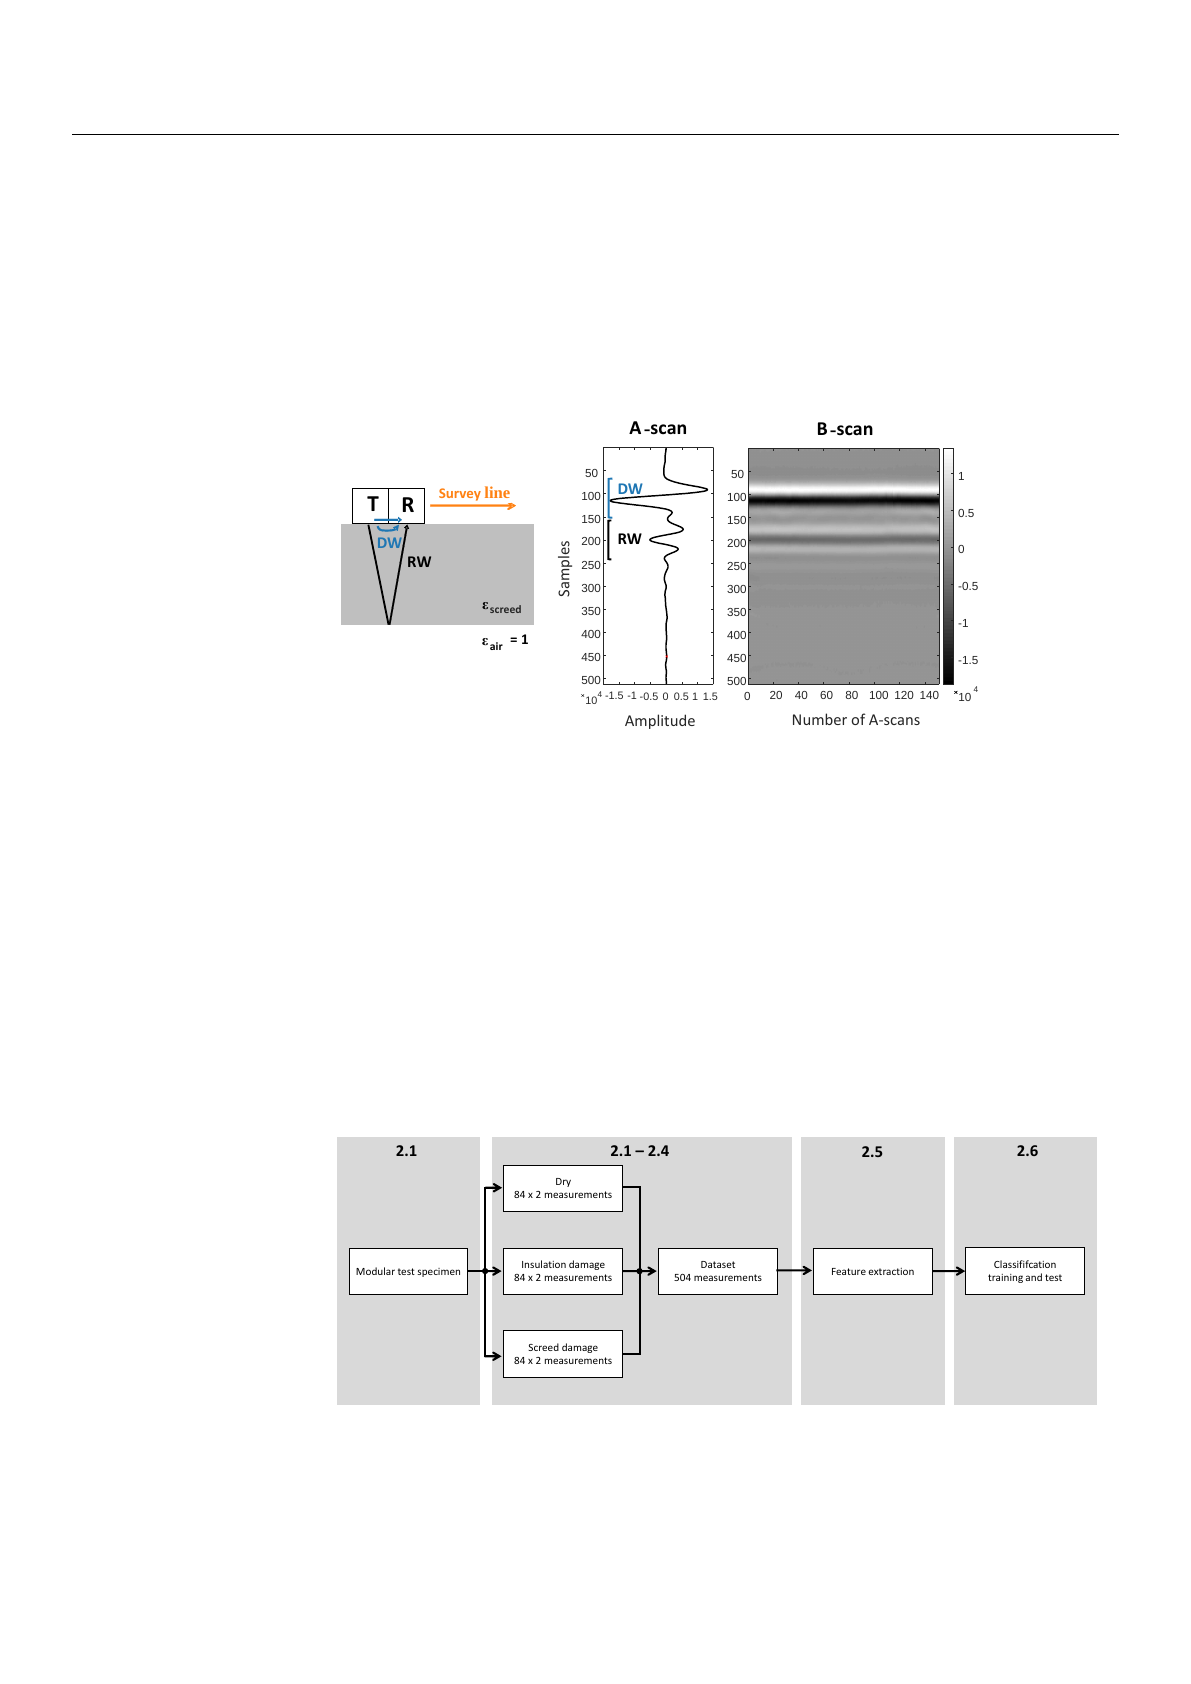
Therefore, the amplitude of a reflection wave (RW) is highly influenced by the bound-
ary’s permittivity contrast, from which it originates. Figure 1shows this simplified ray-
based principle with an exemplary screed plate above air, forming such a permittivity
contrast. It also presents the usually performed collection of multiple reflection signals (A-
scans) along a survey line, whereas the offset between the transmitter (T) and receiver (R)
stays constant (common-offset configuration). The recorded A-scans can then be combined
in a radargram (B-scan) that offers the opportunity to visualize spatial deviations caused
by inhomogeneities, like the presence of reinforcements or water-damaged areas.
Samples
0 1 1.5
A-scan
20 40 60 80 100 120 140
Number of A-scans
50
100
150
200
250
300
350
400
450
500
-1.5
-1
-0.5
0
0.5
1
104
B-scan
104
50
100
150
200
250
300
350
400
450
500
DW
RW
TR
εscreed
εair = 1
RW
DW
Survey line
Amplitude
1.5
0.5 0
-0.5
-1
-1.5
Figure 1. Principle of GPR. Multiple A-scans collected along a survey line form a B-scan.
The most dominant wave-type in an A-scan is the direct wave (DW), which travels
the shortest path between T and R and is therefore recorded first. As shown, it is a
superposition of an air and a ground wave and is generally used as a time reference for the
following RW, since the moment of emitting the pulse (time zero) is unknown [21].
Typical signals and their respective features measured on layered floor constructions
are discussed in Section 2.5.
2. Materials and Methods
Figure 2shows the general procedure of the work presented in this section. After in-
troducing the designed modular test specimen in Section 2.1, the conducted experiments
to obtain a dataset of three damage scenarios are discussed in the Sections 2.1–2.4. In
Section 2.5
, various features are extracted to train and test different classifiers, which are
shown in Section 2.6.
Modular test specimen Insulation damage
84 x 2 measurements
Dry
84 x 2 measurements
Screed damage
84 x 2 measurements
Dataset
504 measurements Feature extraction Classififcation
training and test
2.1 2.1 –2.4 2.5 2.6
Figure 2.
Schematic of the work steps presented in Section 2divided by their respective subsections.
2.1. Modular Test Specimen
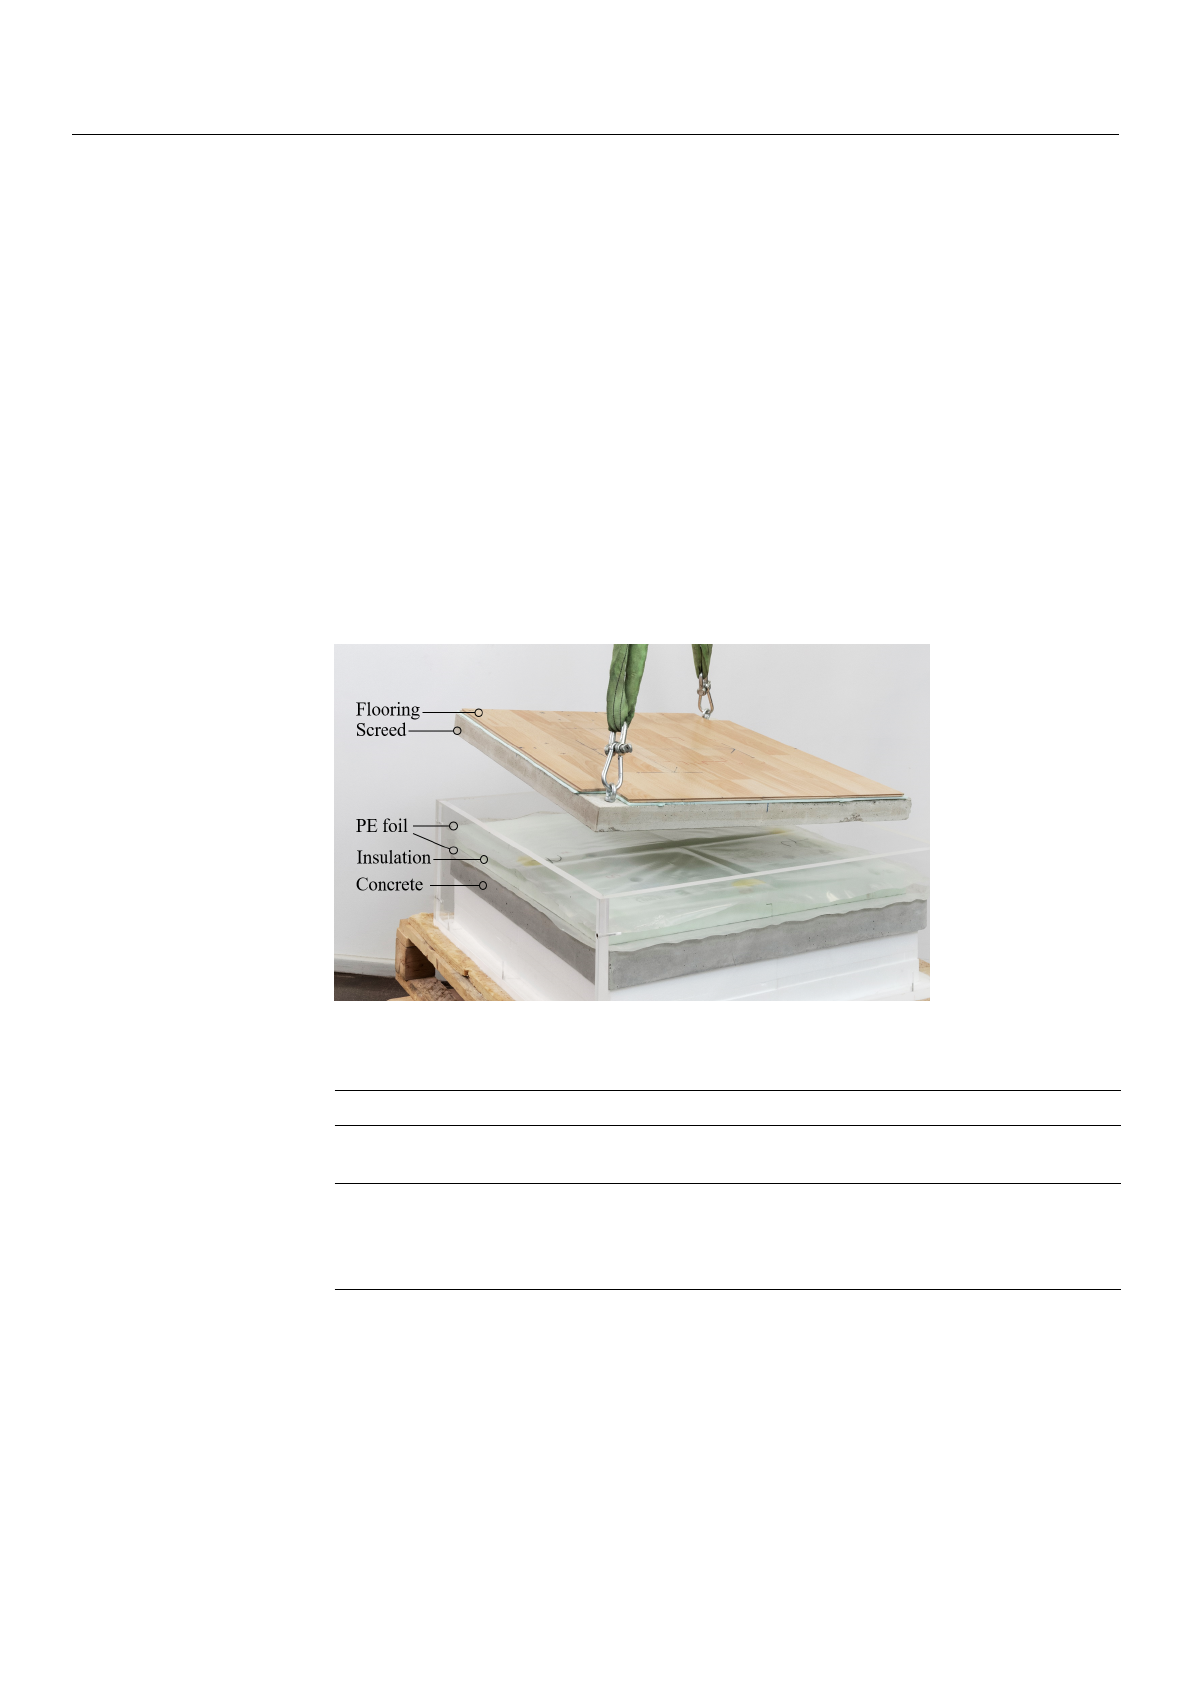
To study multiple different floor constructions, we designed a modular specimen
(Figure 3), in which the screed and insulation layer can be exchanged in various ways
according to the requirements of the experiment. The inner dimensions of 84 cm length,
Appl. Sci. 2021,11, 8820 4 of 16
84 cm width, and 30 cm height ensure sufficient space for the individual square-shaped
parts with an edge length of 80 cm. Table 1shows the variations of the chosen materials and
their thicknesses that are believed to cover most floor setups in practice. Polyethylene (PE)
foil is used to create a moisture barrier above and below the insulation. The influence of
the laminate flooring and the concrete base layer on the presented classification method is
considered to be negligible compared to the screed and insulation layer. Therefore, and with
regard to the experimental effort, the flooring and base layer remained unchanged for the
entire test series.
The cement and anhydrite screed were both chosen with the popular compressive
strength C25 and the consistency class F5. The production process was carried out as
instructed by the manufacturer. To guarantee efficient handling of the 60 kg to 100 kg heavy
specimens, threaded sleeves were embedded in each corner. This allowed the temporary
use of ring bolts to lift the plates.
The amount of different materials and thicknesses (Table 1) allows for the simulation
of 84 different floor constructions for each of the three scenarios (252 setups in total).
The experimental implementation of water damage in the insulation and screed layer is
described in the following sections.
Figure 3. Modular test specimen with screed, insulation, and concrete base layer.
Table 1. Used materials and layer thicknesses for the screed (top) and insulation layer (bottom).
Material Thickness D[cm] Density [g·cm−3] Porosity * [%]
Cement screed (CT) 5, 6, 7 1.92 20.76
Anhydrite screed (CA) 5, 6, 2.05 27.18
Expanded polysterene (EP) 2, 5, 7, 10 0.027 -
Extruded polysterene (XP) 2, 5, 7, 10 0.037 -
Glass wool (GW) 2, 6, 10 0.061 -
Perlites (PS) 2, 6, 10 0.092 -
* Measured with mercury intrusion porosimetry.
2.2. Water Damage in Insulation Layer
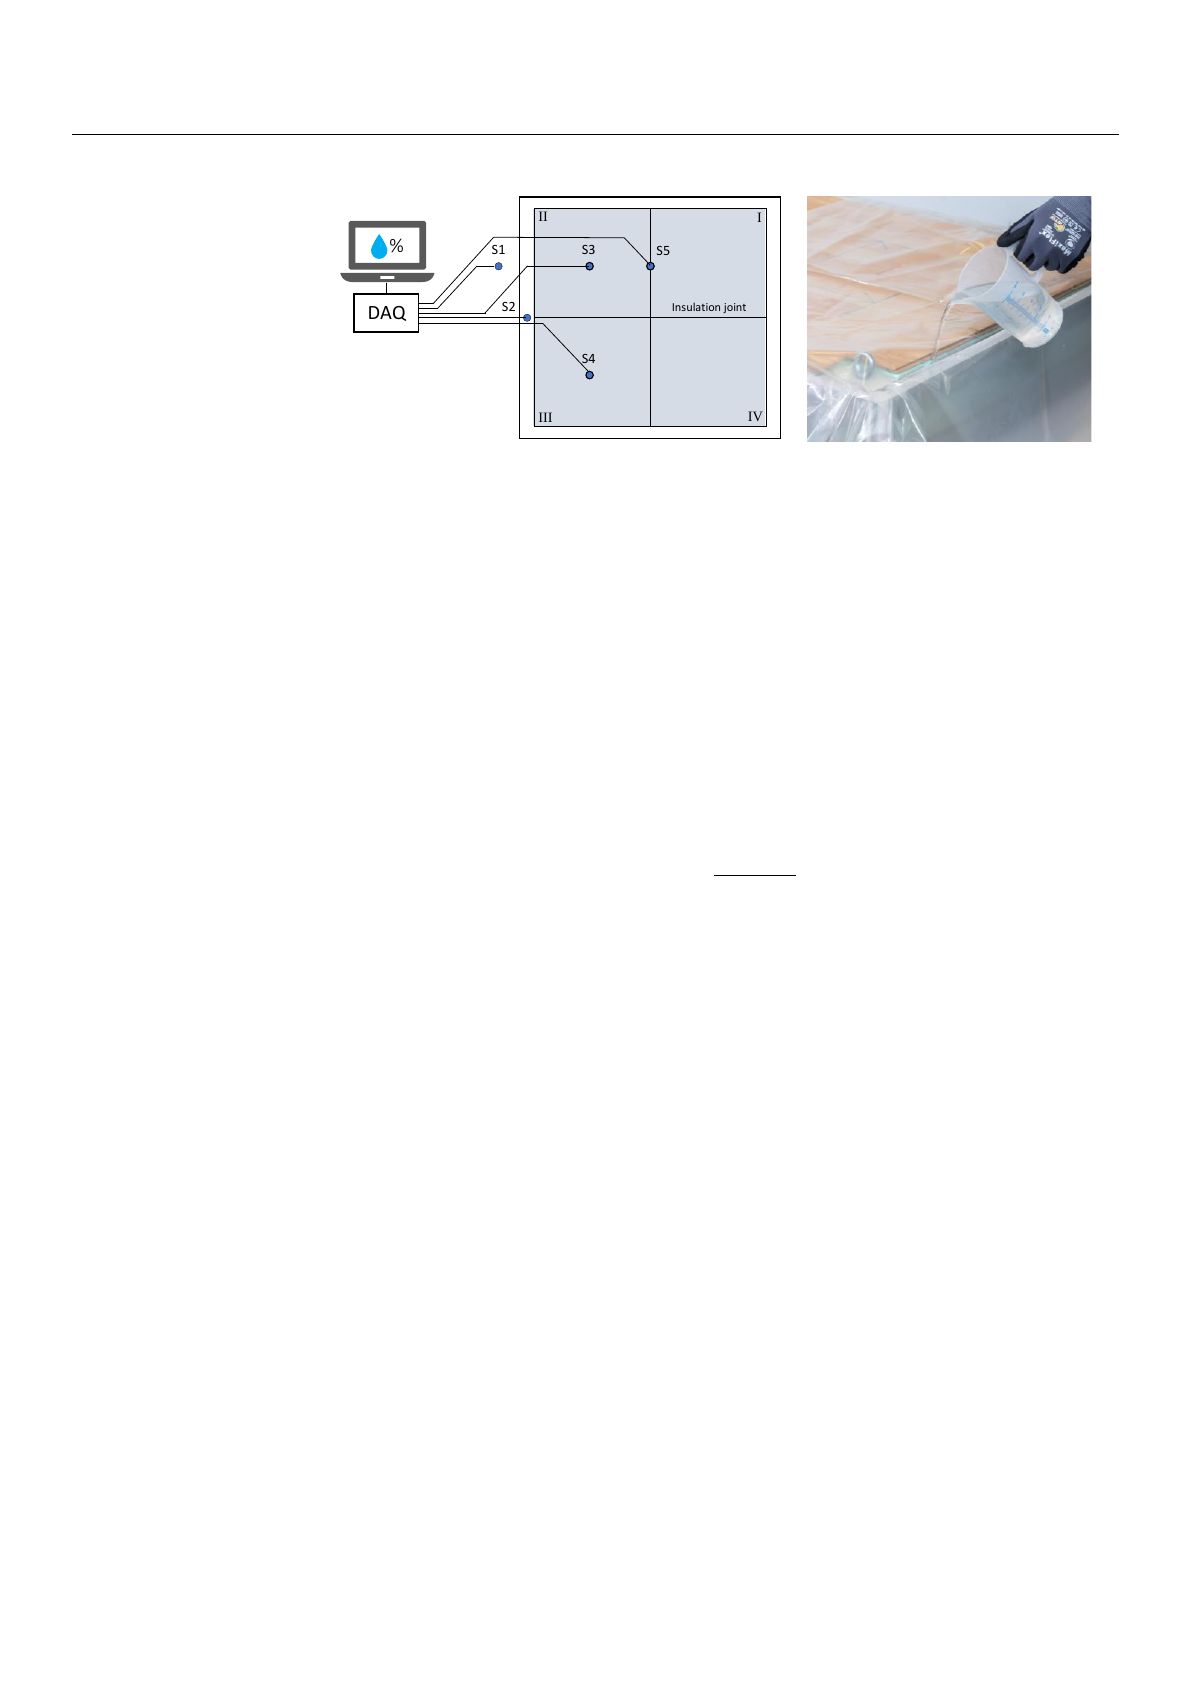
To evaluate the resulting damage of added water, HIH-5030 humidity sensors were
embedded in the insulation material, as shown in Figure 4. For EP, XP, and GW, this was
accomplished with drilling holes of 3 cm diameter and depths varying from 50% to 75% of
the respective insulation thickness. Top sealing was attained with waterproof tape. For the
fine-grained PS, drilling holes were not necessary because the sensors could be placed easily.
Appl. Sci. 2021,11, 8820 5 of 16
S1
S2
S4
S3 S5
DAQ
%
Insulation joint
I
II
III IV
Figure 4.
Evaluation of the resulting insulation damage through the use of embedded humidity sensors.
After adding equal amounts of water in all four sides of the setup, the moisture could
spread for at least 12 hours to ensure stable conditions. In practical investigations, a thresh-
old of 80% relative humidity is often considered as an adequate reason for renovations,
since it provides optimum growth conditions for mould [
22
]. Following that, a setup
was labeled as “damaged” only if all three sensors S3 to S5 exceeded this critical value.
Thereafter, the measurement procedure, which is discussed in Section 2.4, was conducted
for each of the six screeds.
2.3. Water Damage in Screed Layer
The quantification of screed moisture was carried out using the direct Darr method [
23
],
which captures the loss of water by weighing samples before and after an oven-drying
procedure. With the wet sample weight
Ww
and the dry sample weight
Wd
, the dry basis
moisture content Mdis calculated as follows:
Md=Ww−Wd
Wd
(3)
.
Moisture content above 4 weight percent (wt%) and 0.5 wt% were valued as dam-
age for cement and anhydrite screed, respectively. Due to preliminary investigations of
the screed’s hydration process,
Wd
was already known for each sample. Consequently,
the sample’s moisture content could be obtained by measuring
Ww
only. With 1.7 wt% to
2.3 wt% for CT and around 0.1 wt% for CA, these were rather low before simulating the
damage. Therefore, we first flooded each sample by submersing them in water for 30 min
(CT) or 10 min (CA). The moisture could then spread and evaporate for at least 2 days
before the actual damage was induced. In consideration of practical screed damage that
usually occurs after flooding from above, we then constantly poured water on top of the
plates for 10 min. Besides continually weighing the samples, additional nuclear magnetic
resonance (NMR) measurements were performed with the MOUSE [
24
,
25
] to obtain depth-
resolved moisture distribution during the described saturation process. Figure 5presents
the exemplary NMR results with their respective water content measured on the 5 cm thick
CT and CA screed.
Compared to CA, the CT screed shows an unbalanced water ingress for the sample’s
top and bottom side after the submersion. We explain this with a lower porosity of CT,
not allowing the air in the bottom to be displaced towards the upper areas. The porosity
also allows the water to spread more in CA after two days of rest. Nevertheless, sprinkling
the samples resulted in quite a similar moisture distribution for both screed types with
sufficiently high moisture content to be labeled as damage. After that, the screed was
measured with all 14 insulation setups.
Loading more pages...