
3rd PLATE Conference
September 18 – 20, 2019
Berlin, Germany
Nils F. Nissen
Melanie Jaeger-Erben (eds.)
Universitätsverlag der TU Berlin
Poppe , Erik: Time in market: using data mining technologies to measure
product lifecycles. In: Nissen, Nils F.; Jaeger-Erben, Melanie (Eds.):
PLATE – Product Lifetimes And The Environment : Proceedings, 3rd PLATE
CONFERENCE, BERLIN, GERMANY, 18 – 20 September 2019. Berlin: Uni-
versitätsverlag der TU Berlin, 2021. pp. 661 – 667. ISBN 978-3-7983-3125-9
(online). https://doi.org/10.14279/depositonce-9253.
This article – except for quotes, fi gures and where otherwise noted – is
licensed under a CC BY 4.0 License (Creative Commons Attribution 4.0).
https://creativecommons.org/licenses/by/4.0/.
661
3rd PLATE 2019 Conference
Berlin, Germany, 18-20 September 2019
Time in Market: Using Data Mining Technologies to Measure
Product Life Cycles
Poppe, Erik
Technische Universität Berlin, Chair of Transdisciplinary Sustainability Research in Electronics, Berlin, Germany
Keywords: Data Mining; Web Crawling; Time in Market; Obsolescence; Smartphones.
Abstract: Time in Market (TIM) is a metric to describe the time period of a product from its market
entry to its decline and disappearance from the market. The concept is often used implicit to describe
the acceleration of product life cycles, innovation cycles and is an essential part of the product life
cycle concept. It can be assumed that time in markets is an important indicator for manufacturers and
marketers to plan and evaluate their market success. Moreover, time in markets are necessary to
measure the speed of product life cycles and their implication for the general development of product
lifetime. This article’s major contributions are to presenting (1) time in markets as a highly relevant
concept for the assessment of product life cycles, although the indicator has received little attention
so far, (2) explaining an automated internet-based data mining approach to gather semi-structured
product data from 5 German internet shops for electronic consumer goods and (3) presenting initial
insights for a period of a half to one year on market data for smartphones. It will turn out that longer
periods of time are needed to obtain significant data on time in markets, nevertheless initial results
show a high product rollover rate of 40-45% within one year and present a time in market below 100
days for at least 16% of the captured products. Due to the current state of work, this article is
addressed to researchers already engaged in data mining or interested in the application of it.
What is TIM good for?
Time in Market (TIM) as a product metric is
considered to measure the time period of
products entry into a market and its eventual
withdrawal.
Did you know that there are at least over 500
different types of toasters, more than 800 water
boilers and over 1.600 smartphones being
traded in Germany within one year (data by the
author)? In today’s era of mass consumption
and customization there are hundreds, if not
thousands, of new electronic consumer
products introduced every week worldwide
(Cox/Alm 1998). It’s astonishing how shop
operators, consumers and market authorities
can deal with all this complexity (Schwartz
2009, Schneider et al 2007). Especially modern
online distribution systems enable a world of
abundance with unlimited shelf spaces and an
enormous choice of products. (Anderson 2008:
143ff). “Yet abundance is the driving force in all
economic growth and change” (Gilder 2006: 6).
Little empirical evidence of shortening of
product life cycles
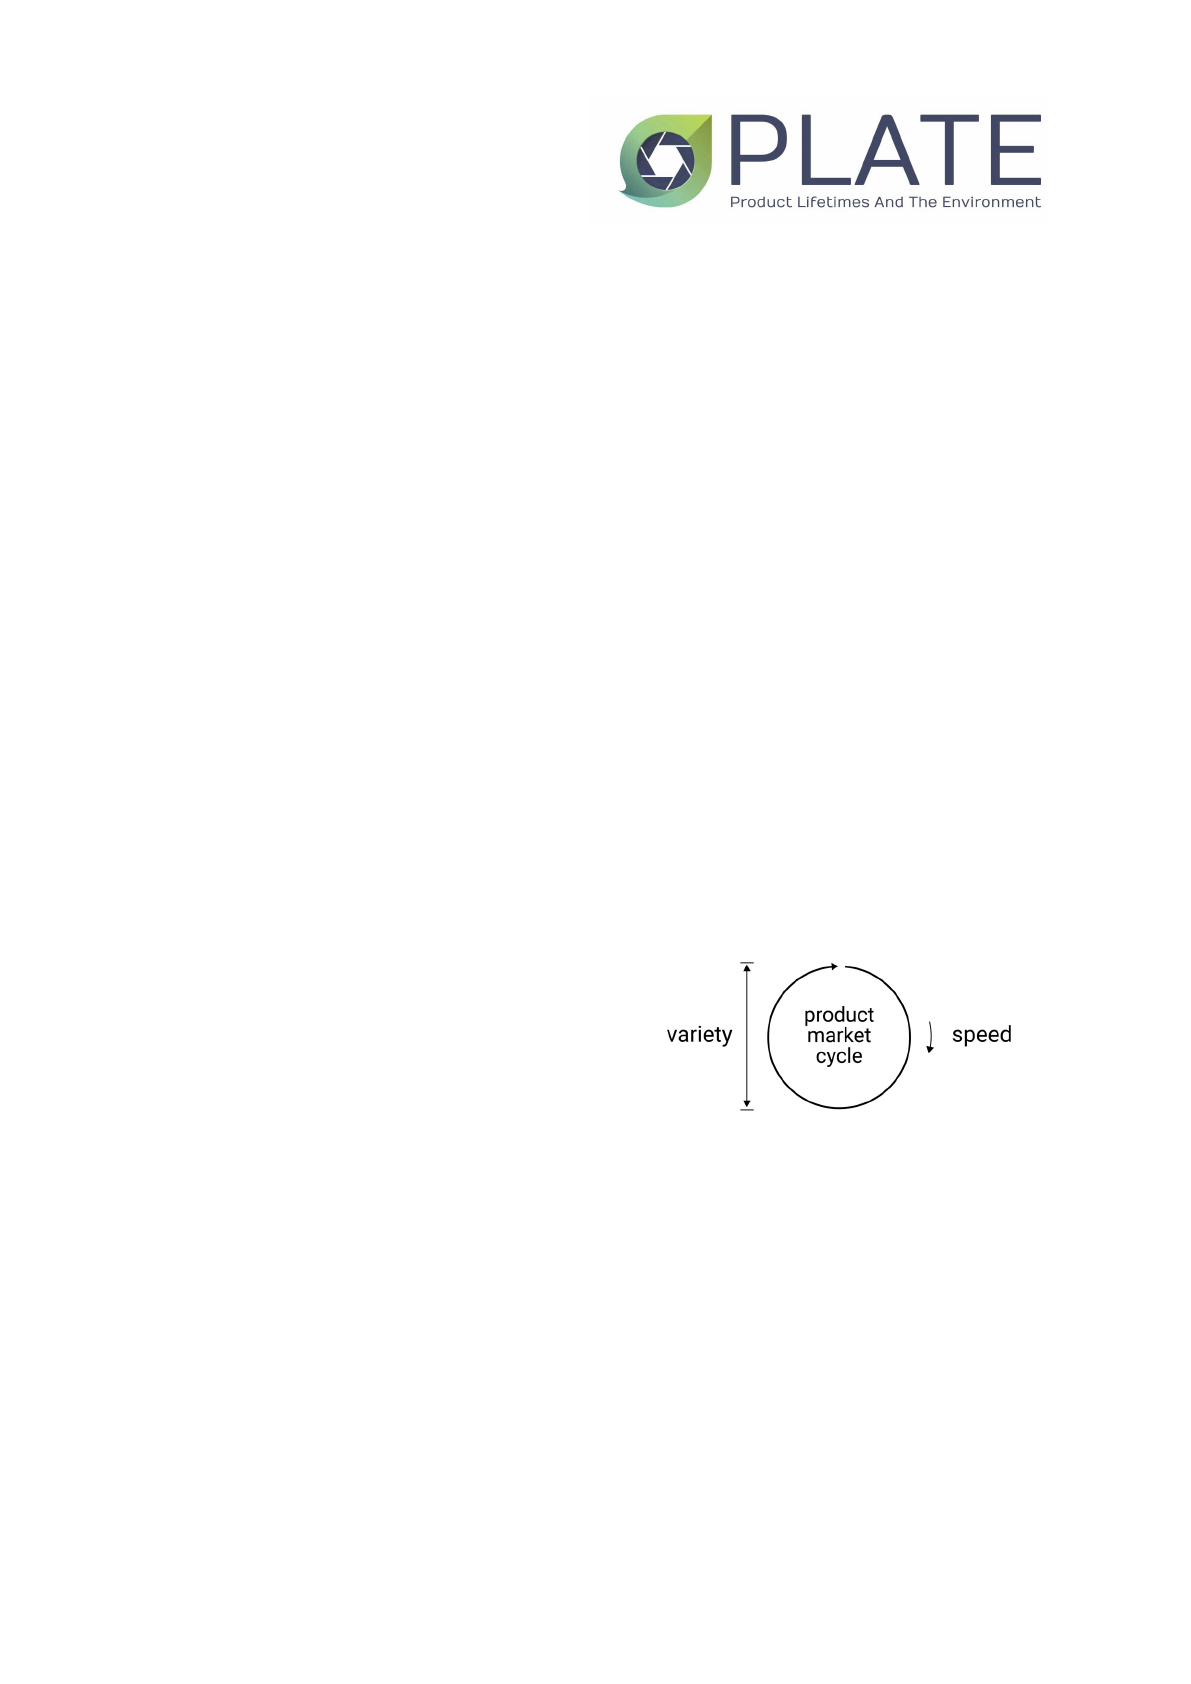
Figure 1. Product variety and life cycle speed in
the market.
There have been many discussions on
premature obsolescence and accelerated
product life cycles, but not much research on
the actual speed of the market cycle and
variety of products in the market (Figure 1).
Bayus was one of the first to critically pointed
out that while there is a lively discussion about
the shorting of product life cycles, nobody
cares about the empirical evidence (Bayus, B.,
1998). Even reference books on product life
cycle management, which suggest holistic
approaches, ignore TIM as a metric and
objective of the product life cycle (Stark, J.,
2015).
662
3rd PLATE Conference Berlin, Germany, 18-20 September 2019
Poppe E.
Time in market: Using data mining technologies to measure product life
cycles
The more products, the more
obsolescence
This is striking given the fact that shorter TIM
and an ever-increasing variety of products can
be seen as a main driver for obsolescence.
According to the linear assumption and thesis:
the higher the variety of products in the market
(e.g. by product proliferation, mass
customization) and the shorter their timespan
in the market, the higher the absolute number
of products that will become obsolete at some
point in time (Trentmann 2017: 672 ff., Slade
2006:29-55, Packard 1960:29-40). In short, the
more products, the more obsolescence. The
main advantages of the TIM indicator i.a.:
• Business relevance: TIM is an
important factor and objective for the
success of companies in an
increasingly competitive consumer
electronic market, especially when
general product life cycles are
shortening (Cooper 2005:19-20,
Brown/Lattin 1994).
• Optimized product strategies: Better
insights on TIM can mitigate the risk of
misplanning, overproduction that
cause negative environmental effects
and business damage.
• Accessibility: In many cases semi-
structured product data can be openly
accessed and automatically processed
afterwards.
Operationalization of TIM
According to a general market-oriented
concept of product life cycles, there are
different stages a product goes through from
its initial launch until completion of the life
cycle at the point the product becomes
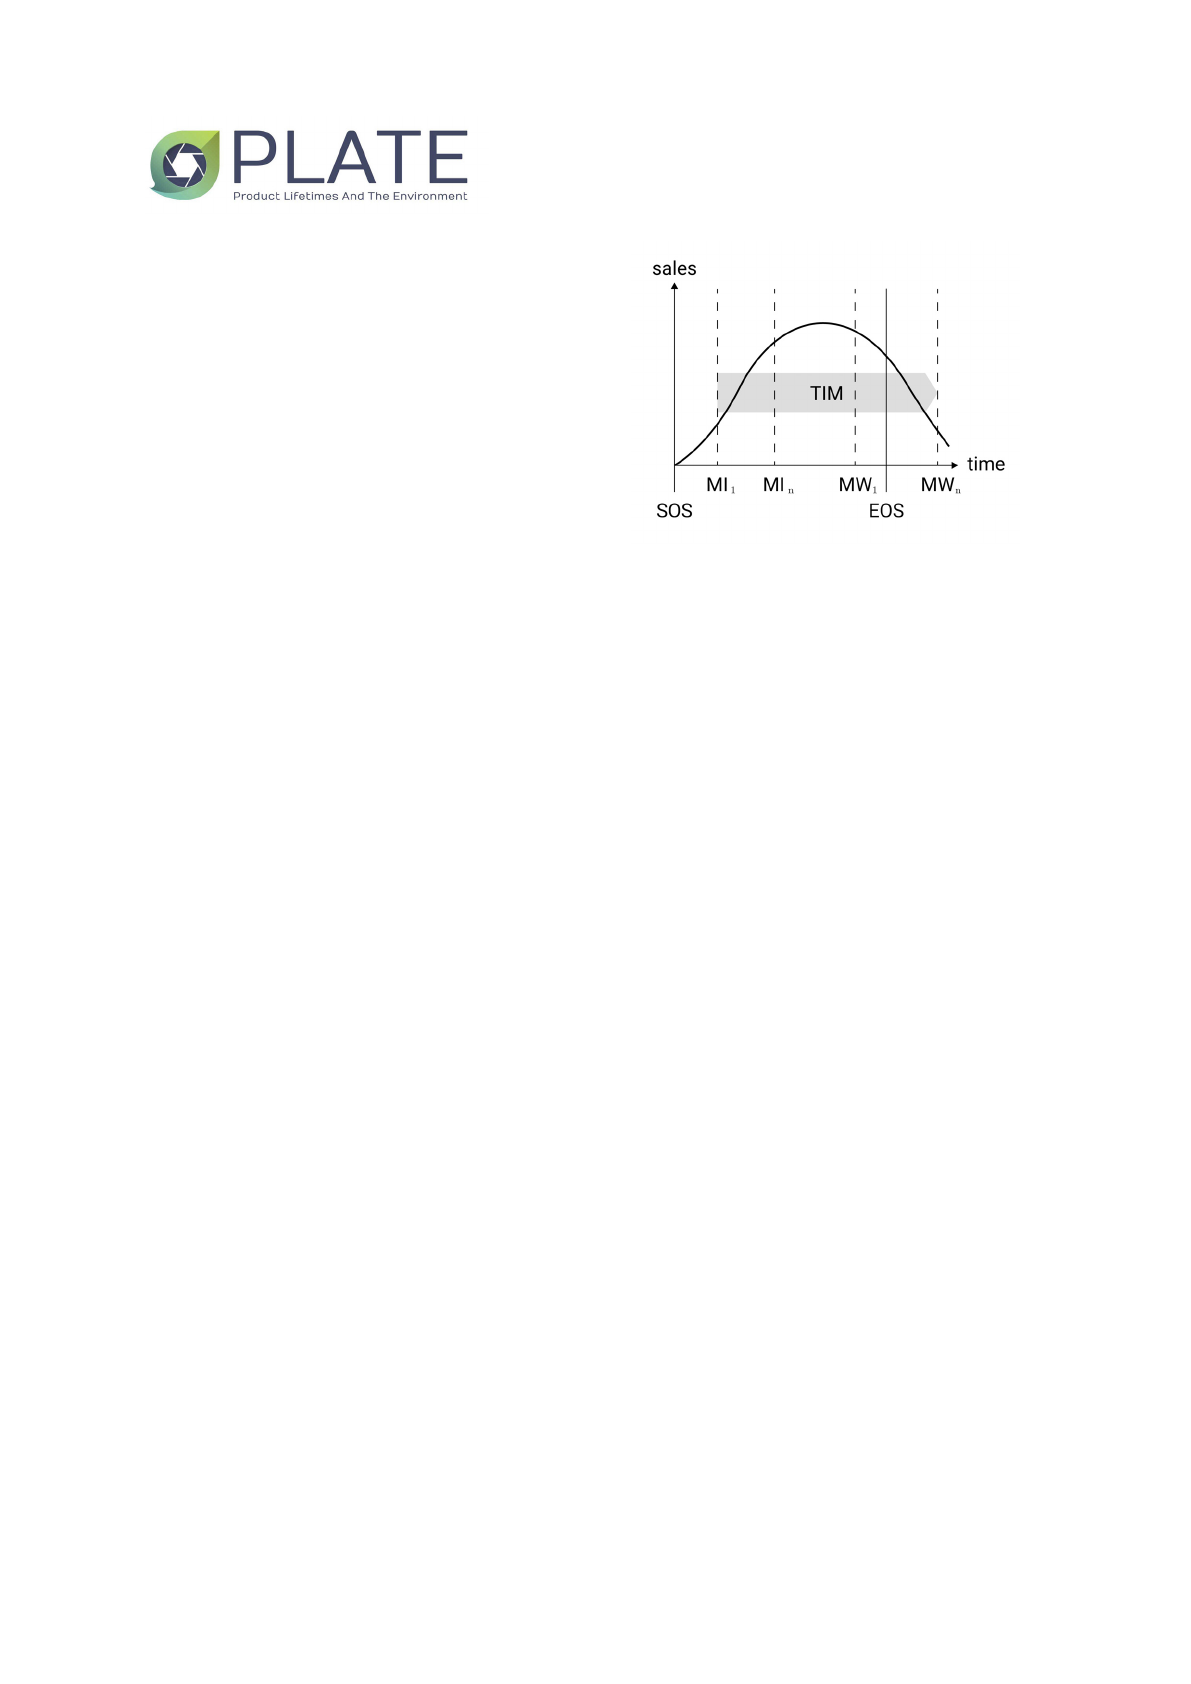
obsolete (Kotler/Armstrong 2012:273). Figure
2 shows an adapted and simplified product life
cycle to give a better understanding on the
difficulties to measure TIM.
Figure 2. TIM within the product life cycle and
cumulated sales rate.
The key parameters shown in figure 2 are:
• Start of sales (SOS): The manufacturer
or market representative start sales,
directly to customers, to trade
intermediaries or to trading companies.
• Market introduction (MI): The products
become available in the market
through different vendors at different
point of times (MI1-n). The cumulated
sales rate typically goes up.
• End of sale (EOS): At some point in
time the manufacturer discontinues
the production and distribution of the
product.
• Market withdrawal (MW): Manifold
reasons induce vendors to withdraw
the products from their marketplace at
different point of times (MW
1-n
). The
cumulated sales rate typically declines.
Differentiation at multiple scales
The model outlined above is to be understood
as an idealized superposition of several
microcycles on different levels. On the one
side, there is a complex differentiation of
vendors on the market stretching from retailers
to second hand re-commerce marketplaces. On
the other side, there is a complex differentiation
at the product level. A smartphone of the type
iPhone 8 Plus from the manufacturer Apple is
offered in at least 14 corresponding
configurations due to different colors and size
of the internal memory. The same problem of
distinction occurs with different colors of
663
3rd PLATE Conference Berlin, Germany, 18-20 September 2019
Poppe E.
Time in market: Using data mining technologies to measure product life
cycles
toasters, notebook keyboards in different
languages or televisions display size.
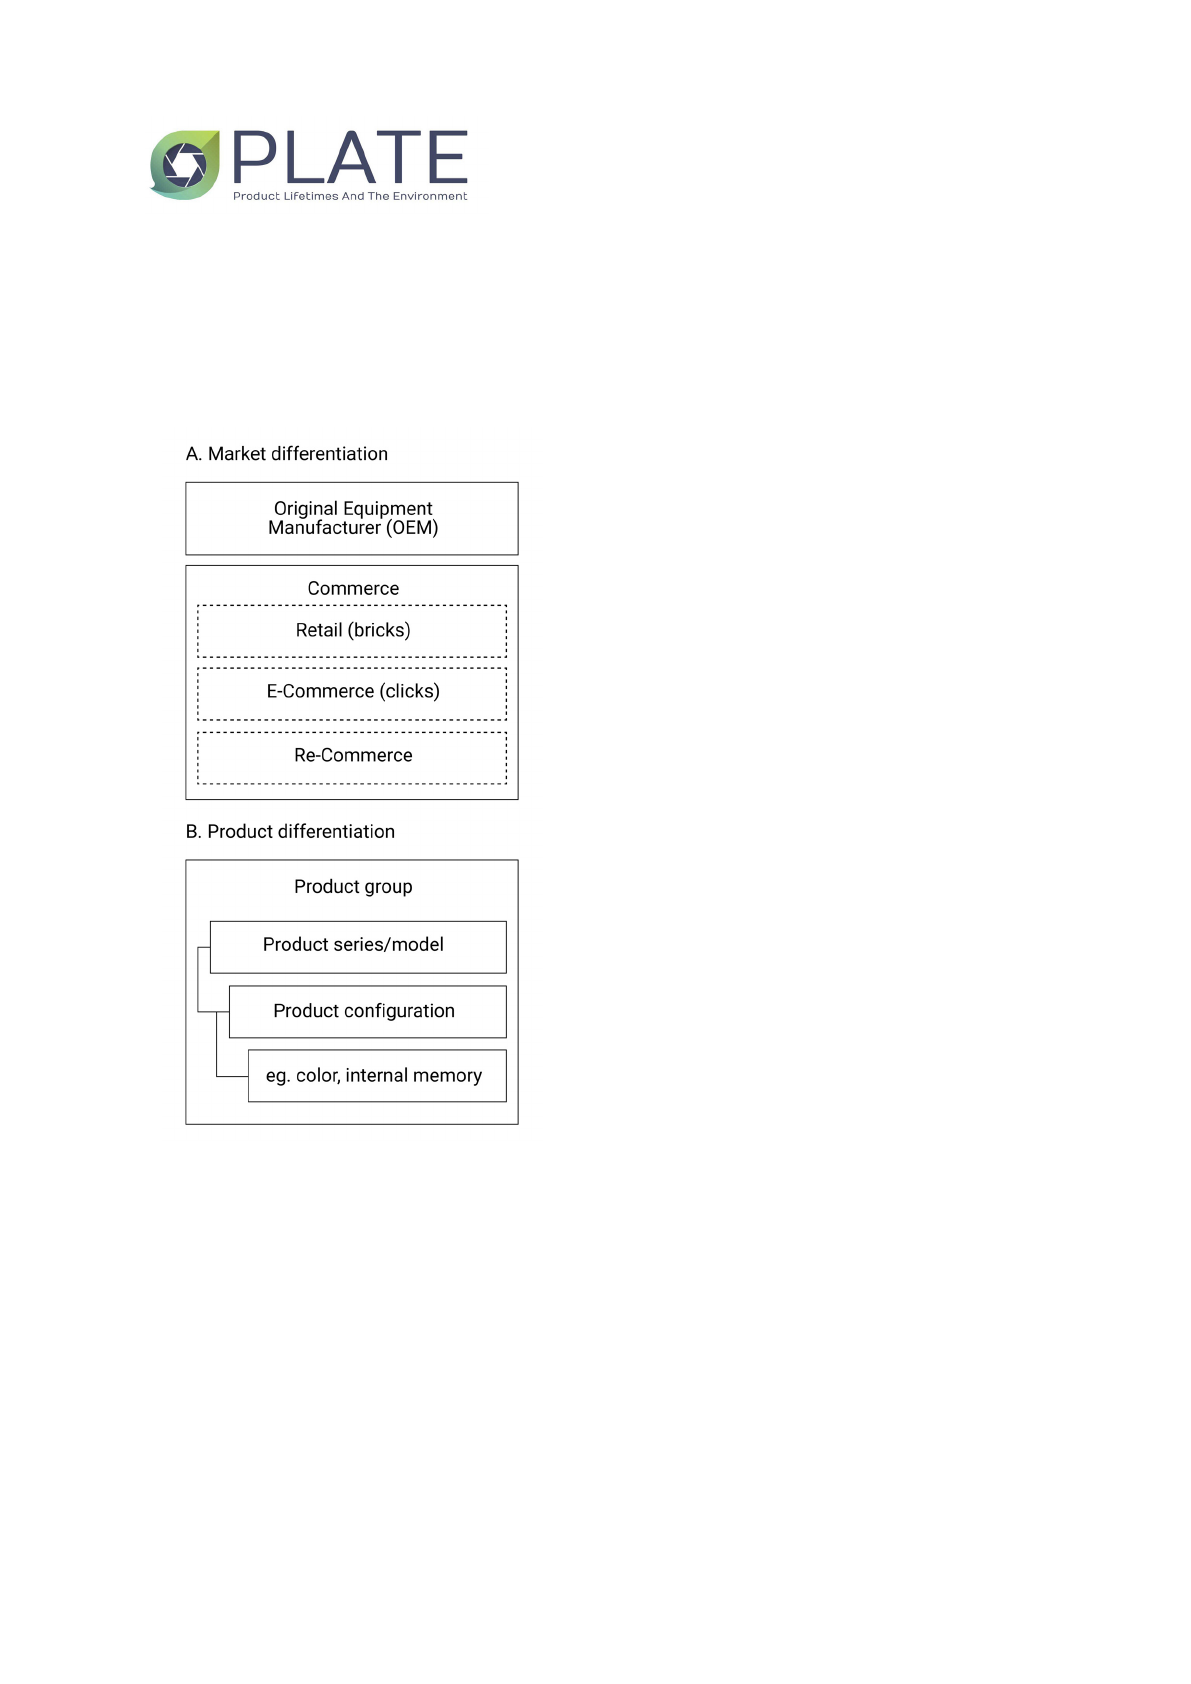
Regarding the bulk of product variety and
single product market cycles it seems rational
to itemize the observable data along the
taxonomy presented in figure 3.
Figure 3. Market and product specific taxonomy.
The taxonomy proposed in figure 3 offers a
basic ontology to describe market and product
specific TIM. The e-commerce sector at the
market level (A) is assumed to achieve a
longer timespan in the markets as they don’t
have the same scarcity of physical shelf space
such as retailers in physical stores. Moreover,
re-commerce providers probably realize
expectably longer timespans in markets due
their business model. Inevitably, for further
analytics it becomes necessary to distinguish
between different product levels (B). As already
mentioned, products are often manufactured in
series or models and have different
configurations. A smartphone model of the type
of an Apple iPhone 8 with 64 gigabyte internal
memory can have a longer TIM than its smaller
equivalent with only 32 gigabyte memory.
Where possible, it is necessary to analyze TIM
at different product levels to enable detailed
analysis of the results.
Data mining approach
Inevitably, an article of this scope cannot cover
every technical detail. For this reason, the
following section will focus on the concept of
data mining and major challenges of web
crawling to give even non-experts an insight in
this complex field. For a broad overview the
author recommends Fan and Bifet (Fan/Bifet
2014) and for a detailed study of the general
concept and application Sumathi and
Sivandam (Sumathi/Sivanandam 2006).
Definitions and key concepts
Data mining refers here to the process of
acquiring and analyzing large amounts of data
in order to discover patterns and other
information (Sumathi/Sivanandam 2006).
Web crawler are software applications
commonly known as bot, web spider, web
scraping or data harvesting. They can browse
hyperlinks, collect pages from online resources
and extract the relevant information (Patil/Patil,
2016, Castrillo-Fernández 2015).
Technical requirements
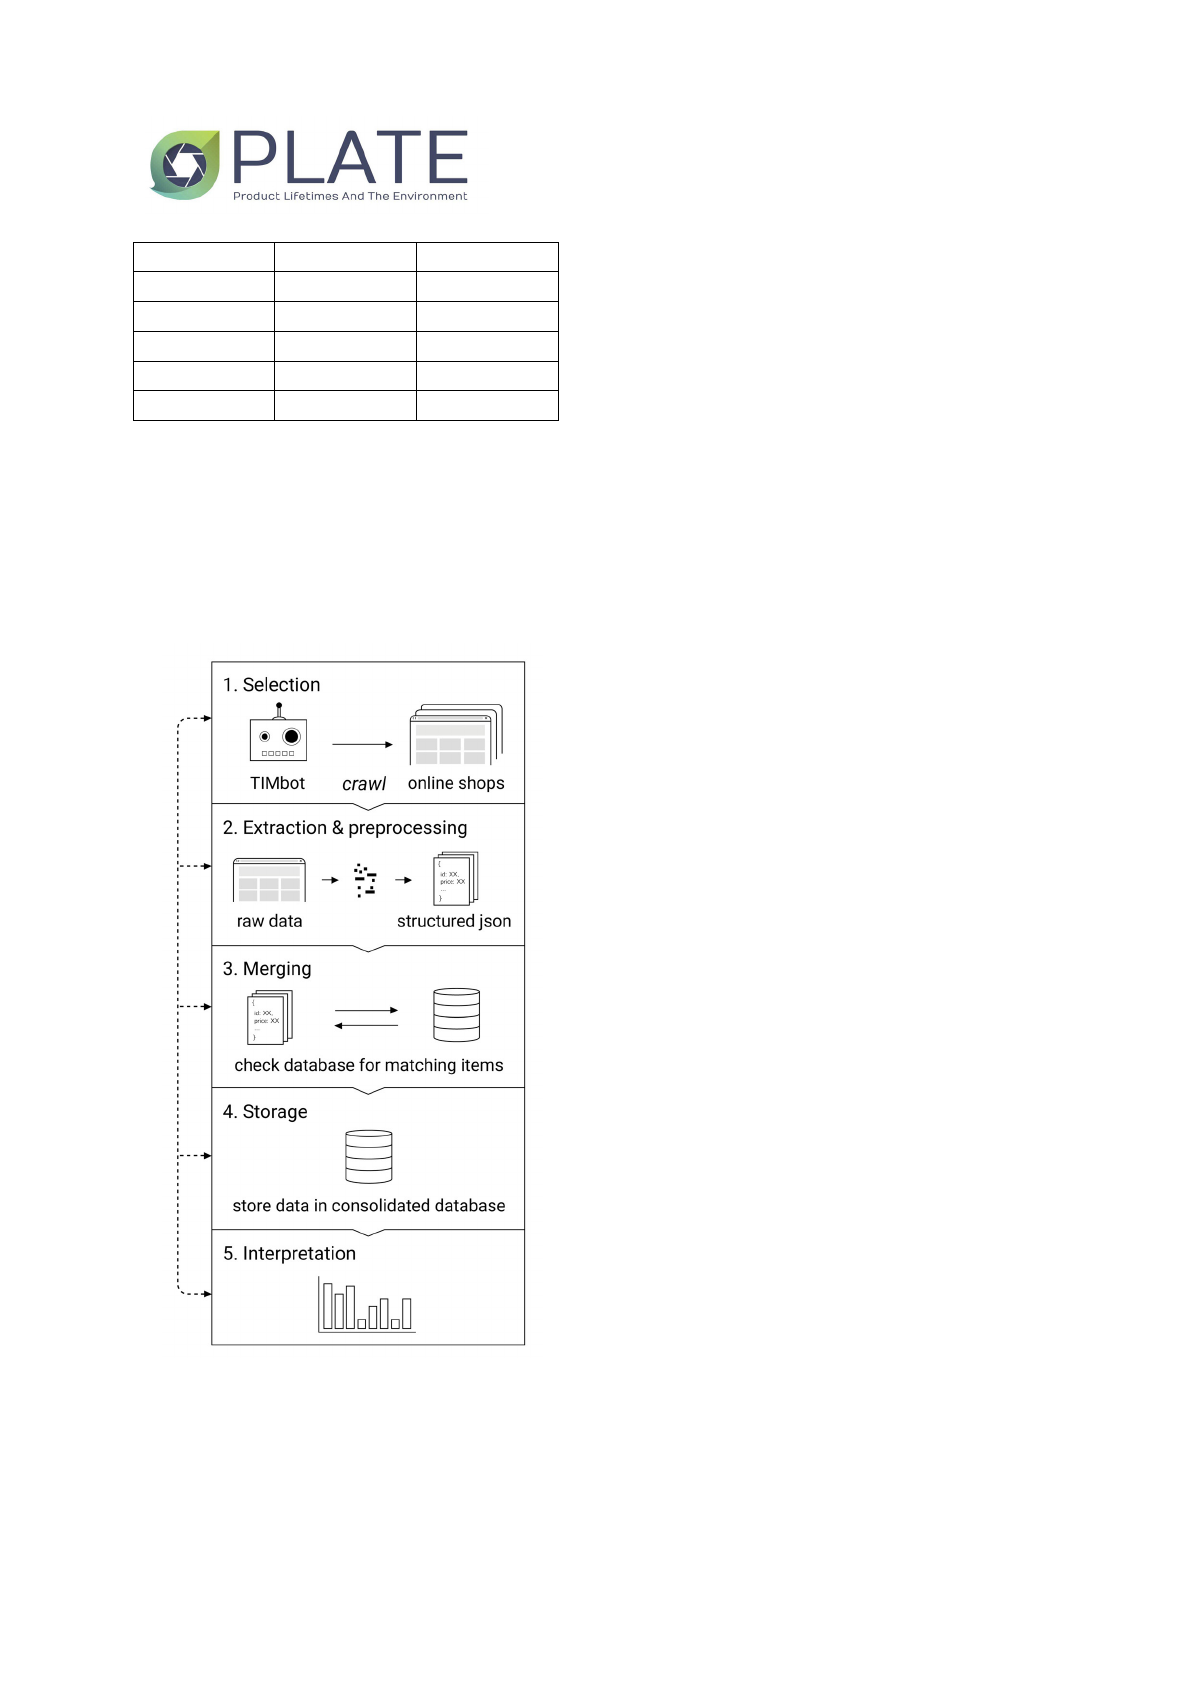
The basic task was to setup a system that
automatically extracts, preprocess and stores
online product data from different product
categories of selected German e-commerce
and retail shops on a weekly basis. In addition,
the system must be able to match products
from one shop to another. The implementation
process and a simplified recursive workflow
are shown in figure 4 and explained below.
Step 1: Selection
The online shops in Table 1 were selected
because of the provider's market share in the
consumer electronics sector and the possibility
to automatically retrieve data. The latter point
is important because some online shops limit
access to websites through legal and technical
restrictions. In order to avoid double counting
of single shops, aggregators such as
amazon.de, google.de, or idealo.de where
excluded from the selection.
664
3rd PLATE Conference Berlin, Germany, 18-20 September 2019
Poppe E.
Time in market: Using data mining technologies to measure product life
cycles
Shopname Market place Period since
saturn.de bricks & clicks 2018-06
mediamarkt.de bricks & clicks 2018-06
medimax.de bricks & clicks 2018-09
euronics.de bricks & clicks 2018-09
conrad.de bricks & clicks 2019-02
Table 1. Selected online shops.
The five selected shops accounted in the year
2017 at least for 50-60% of the net sales of the
leading companies in the German consumer
electronics retailing sector (Estimation based
on LZ 2018). Thus, the presented data can be
considered as relatively representative for the
predefined marketplace (see figure 3).
Figure 4. Simplified workflow of the data mining
and webcrawling process.
The general process of webcrawling is realized
through various libraries, frameworks and
software written with the programming
language Python (Python 2019). Due to the
different technical setups and structure of the
shop websites various crawling approaches are
used. All together they build a software system
that will be named in the following as TIMbot.
Step 2: Data extraction and preprocessing
TIMbot is crawling predefined product
categories by the shops internet address (URL)
and extracts the raw semi-structured data from
the HTML structure or via occupying the
database interface (API). The data will be
filtered through predefined patterns that select
target information such as the name, brand,
product link and additional product information.
The most important information is the European
Article Number (EAN) which identifies each
product and its different configurations by a
unique number. The preprocessed data is then
stored as structured data string in a json-File.
Step 3: Merging
All product data will be stored in a consolidated
database. In order to generate time series from
one week to another the product data from the
json-File will run through a specific merger
script (Merger), to check first if the EAN is
already present in the database. If not, TIMbot
will entry a completely new product in the
database. If the product already exists, only
some information such as price and page rank
will be stored as a separate new data point
(event).
Step 4: Storage
The data will be stored in a MySQL-Database
system which provides a highly reliable and
almost unlimited dataspace. MySQL is
widespread, recommended for structured data
and well documented. So far, the database
contains over 40.000 unique product items and
captures over 2 million corresponding
datapoints (events) as time series.
Step 5: Interpretation
The Database can be accessed by a variety of
different analysis and statistic programs such
as MS Excel, Tableau or Stata.
Initial insights into the smartphone
market
The following statistics focuses on the product
group of smartphones and a limited time period
from July 2018 to June 2019. Due to the current
status of the research project the results must
be seen as a first step for a proof of concept
and do not claim to be fully representative.
Loading more pages...