
Review
Review of moisture measurements in civil engineering with ground
penetrating radar – Applied methods and signal features
Tim Klewe
a,
⇑
, Christoph Strangfeld
a
, Sabine Kruschwitz
a,b
a
Bundesanstalt für Materialforschung und -prüfung, Unter den Eichen 87, 12205 Berlin, Germany
b
Technische Universität Berlin, Straße des 17. Juni 135, 10623 Berlin, Germany
highlights
A detailed literature review is given regarding the different signal features for moisture measurement in civil engineering.
Applied signal features can be grouped into amplitude, time and frequency features.
An Overview of applied signal features is presented regarding their group, wave type, preceding survey method and use for moisture content estimation.
Quantitative estimations deliver good results in laboratory conditions, on site measurements underly a lot of uncertainties and mostly allow only
qualitative estimations.
Most reviewed publications consider only one signal feature, thus future approaches may include multiple features for further development.
article info
Article history:
Received 7 July 2020
Received in revised form 15 December 2020
Accepted 3 January 2021
Available online 2 February 2021
Keywords:
Ground Penetrating Radar (GPR)
Moisture
Civil engineering
Signal features
abstract
When applying Ground Penetrating Radar (GPR) to assess the moisture content of building materials, dif-
ferent medium properties, dimensions, interfaces and other unknown influences may require specific
strategies to achieve useful results. Hence, we present an overview of the various approaches to carry
out moisture measurements with GPR in civil engineering (CE). We especially focus on the applied signal
features such as time, amplitude and frequency features and discuss their limitations. Since the majority
of publications rely on one single feature when applying moisture measurements, we also hope to
encourage the consideration of approaches that combine different signal features for further
developments.
Ó2021 The Author(s). Published by Elsevier Ltd. This is an open access article under the CC BY license
(http://creativecommons.org/licenses/by/4.0/).
Contents
1. Introduction . . . ........................................................................................................ 2
2. Fundamentals of GPR. . . . . . . . . . . . . . . ..................................................................................... 2
2.1. Wave propagation and received signals. . . . . ........................................................................... 2
3. Configurations and their parameters . . ..................................................................................... 3
4. Moisture content of building materials ..................................................................................... 3
5. Determination of material moisture based on GPR . . . . . . . . . . .................................................................. 4
5.1. Travel time and velocity features. . . . . . . . . . ........................................................................... 5
5.2. Amplitude and attenuation features . . . . . . . ........................................................................... 5
5.3. Features in the frequency domain . . . . . . . . . ........................................................................... 6
5.4. Inversion-based methods ........................................................................................... 6
5.5. Problems and limitations of on site investigations . . . . . . . . . . . . . . . ........................................................ 6
6. Summary and conclusion. . . . . . . . . . . . ..................................................................................... 7
Declaration of Competing Interest . . . . ..................................................................................... 7
Acknowledgments . . . . . . . . . . . . . . . . . ..................................................................................... 7
References . . . . ........................................................................................................ 8
https://doi.org/10.1016/j.conbuildmat.2021.122250
0950-0618/Ó2021 The Author(s). Published by Elsevier Ltd.
This is an open access article under the CC BY license (http://creativecommons.org/licenses/by/4.0/).
⇑
Corresponding author.
Construction and Building Materials 278 (2021) 122250
Contents lists available at ScienceDirect
Construction and Building Materials
journal homepage: www.elsevier.com/locate/conbuildmat
1. Introduction
In civil engineering (CE), all constructions are facing several
types of degradation, which cause expensive costs of repair. Fre-
quently occurring degradations are the migration of chloride ions
[1], leading to corrosion [2], alkali-silica reaction [3], mould [4],
frost-thaw cycle, micro cracking [5], spalling, salt efflorescence
[6], etc. All these degradation processes are promoted by an
increased amount of material moisture and affect building materi-
als such as concrete, steel, wood, stones, bricks, and screed [7].
Constructions in the field of transport infrastructure, building con-
structions, or hydraulic structures are mainly made of reinforced
concrete [8]. Therefore, the moisture content in the porous cement
matrix of concrete is an important and crucial parameter. How-
ever, a reliable and non-destructive investigation of the moisture
content is still very complex and challenging, while the costs of
repair rise continuously. Especially in the field of building con-
structions, ageing pipe systems are becoming a high burden for
insurance. In 2018, 2:9 billion Euro of damage was caused by piped
water, accounting for the largest share (49%) of building insurance
claims in Germany [9]. In the event of damage, the accurate deter-
mination and localization of water ingress is essential to plan for
and perform efficient renovations.
There are various methods to approach this task, ranging from
destructive (Darr test, calcium carbide method) to non-
destructive procedures (electrical, capacitive, radiometric, thermal
and hygromatic) [10,11]. While destructive methods are time and
cost intensive, most non-destructive measurements are compara-
tively easy to perform, however, without the use of complex pro-
cessing and interpretation procedures, they deliver only
qualitative results.
Ground Penetrating Radar (GPR) is a fast and widely used mea-
surement method based on electromagnetic waves. Although
Radio Detection And Ranging (Radar) is commonly applied for air-
craft and ship detection [12], it is used in many other applications
like weather forecasts [13] or collision avoidance in the automotive
industry [14]. Apart from that, it recently received attention from a
wider audience with its application to prove the existence of water
on Mars [15]. Over the last decades, many publications already
demonstrated the high sensitivity of GPR for water, especially in
geophysics [16,17]. However, also in CE it is increasingly used for
nondestructive moisture measurements (e.g. [18–22]).
A variety of publications have shown multiple ways to assess
moisture with GPR. Different building materials and inspection
purposes require individual methods concerning the antenna con-
figuration or the used frequency. The applied setup as well as the
underlying structure highly influence the subsequent interpreta-
tion of the recorded data, which is why also numerous signal fea-
tures have been established. Due to the many possibilities to
perform moisture measurements with GPR, this review gives an
overview of the various methods and their limitation in the con-
text of CE. It shall serve as a basis for inexperienced readers, as
well as for advanced users, to encourage further development.
Approaches that combine different features or even methods, like
data fusion and machine learning, could also benefit from this
overview.
2. Fundamentals of GPR
GPR signals are electromagnetic waves whose dynamic behav-
ior is mathematically expressed by Maxwell’s equations [23,24].
The wave propagation in investigated objects is highly dependent
on the particular electrical properties of the underlying material.
Those properties are described by dielectric permittivity
e
, electri-
cal conductivity
r
, and magnetic permeability
l
.
While an influence of
l
is neglectable in the majority of GPR
applications,
e
and
r
are of high importance [25]. A low electrical
conductivity
r
provides the best conditions for an effective use
of GPR since the energy is primarily maintained in low-loss mate-
rials. Less attenuation allows signals to penetrate deeper into a
given material, which results in a better signal-to-noise ratio for
low-lying regions of interest. The velocity of wave propagation in
low-loss and nonmagnetic materials can be calculated with Eq.
(1) [25,26].
v
¼c
0
ffiffiffiffi
e
r
pð1Þ
As the speed of light c
0
is constant, the wave velocity is a function of
the relative permittivity e
r
(with e
r
¼
e
e
0
and the electric permittivity
in vacuum e
0
¼8:854 10
6As
Vm
). The relative permittivity describes
the dielectric characteristics of materials and is defined as a com-
plex value, where the real and imaginary part are associated with
energy storage and dissipation, respectively [16]. While the real
part of most building materials is considered as constant and dom-
inant between 10 MHz and 1000 MHz, the frequency-dependent
loss becomes relevant as you get closer to the water relaxation fre-
quency between 10 GHz and 20 GHz [25,27]. According to the pop-
ular models of Debye [28] and Cole–Cole [29] this results in a
decreasing real part and an increasing imaginary part of e
r
for
higher frequencies. Following Eq. 1smaller real parts of e
r
cause
higher velocities. However, this effect is not measurable in common
GPR applications on building materials, since the high frequency
components of transmitted broadband impulses also experience
more attenuation due to an increased imaginary part. The frequency
dependent attenuation leads to a shift towards lower frequencies
that can be observed with rising water contents (see Section 5.3).
Furthermore, the enhanced scattering of higher frequencies on
heterogeneities leads to additional damping, which limits the possi-
ble penetration depth [30,31].
The real value of
e
r
is 1 for air and approximately 81 for pure
water in liquid phase. For most of dry soils and building materials
e
r
is in the range of 2–9 [26] and increases with a higher water con-
tent (e.g.
e
r
is 10 to 20 for wet concrete). Due to these significant
differences, the water content is considered as the main influence
on dielectric properties of building materials, which highly justifies
the use of GPR for moisture measurements [32].
A related method that also utilizes the influence of water on the
electric permittivity and the resulting attenuation of electromag-
netic waves is the application of microwave measurements. A
review of the various concepts is presented by Okamura [33].
2.1. Wave propagation and received signals
The occurrence of reflection, refraction, and transmission on
boundaries between two different permittivities is an important
behavior to describe the propagation of electromagnetic waves.
Fig. 1. Principle of GPR reflection and underlying signal paths between a
transmitter T
x
and a receiver R
x
: A – direct air wave, G – direct ground wave, R –
reflected wave, C – critical refracted wave (according to [16,25]).
T. Klewe, C. Strangfeld and S. Kruschwitz Construction and Building Materials 278 (2021) 122250
2
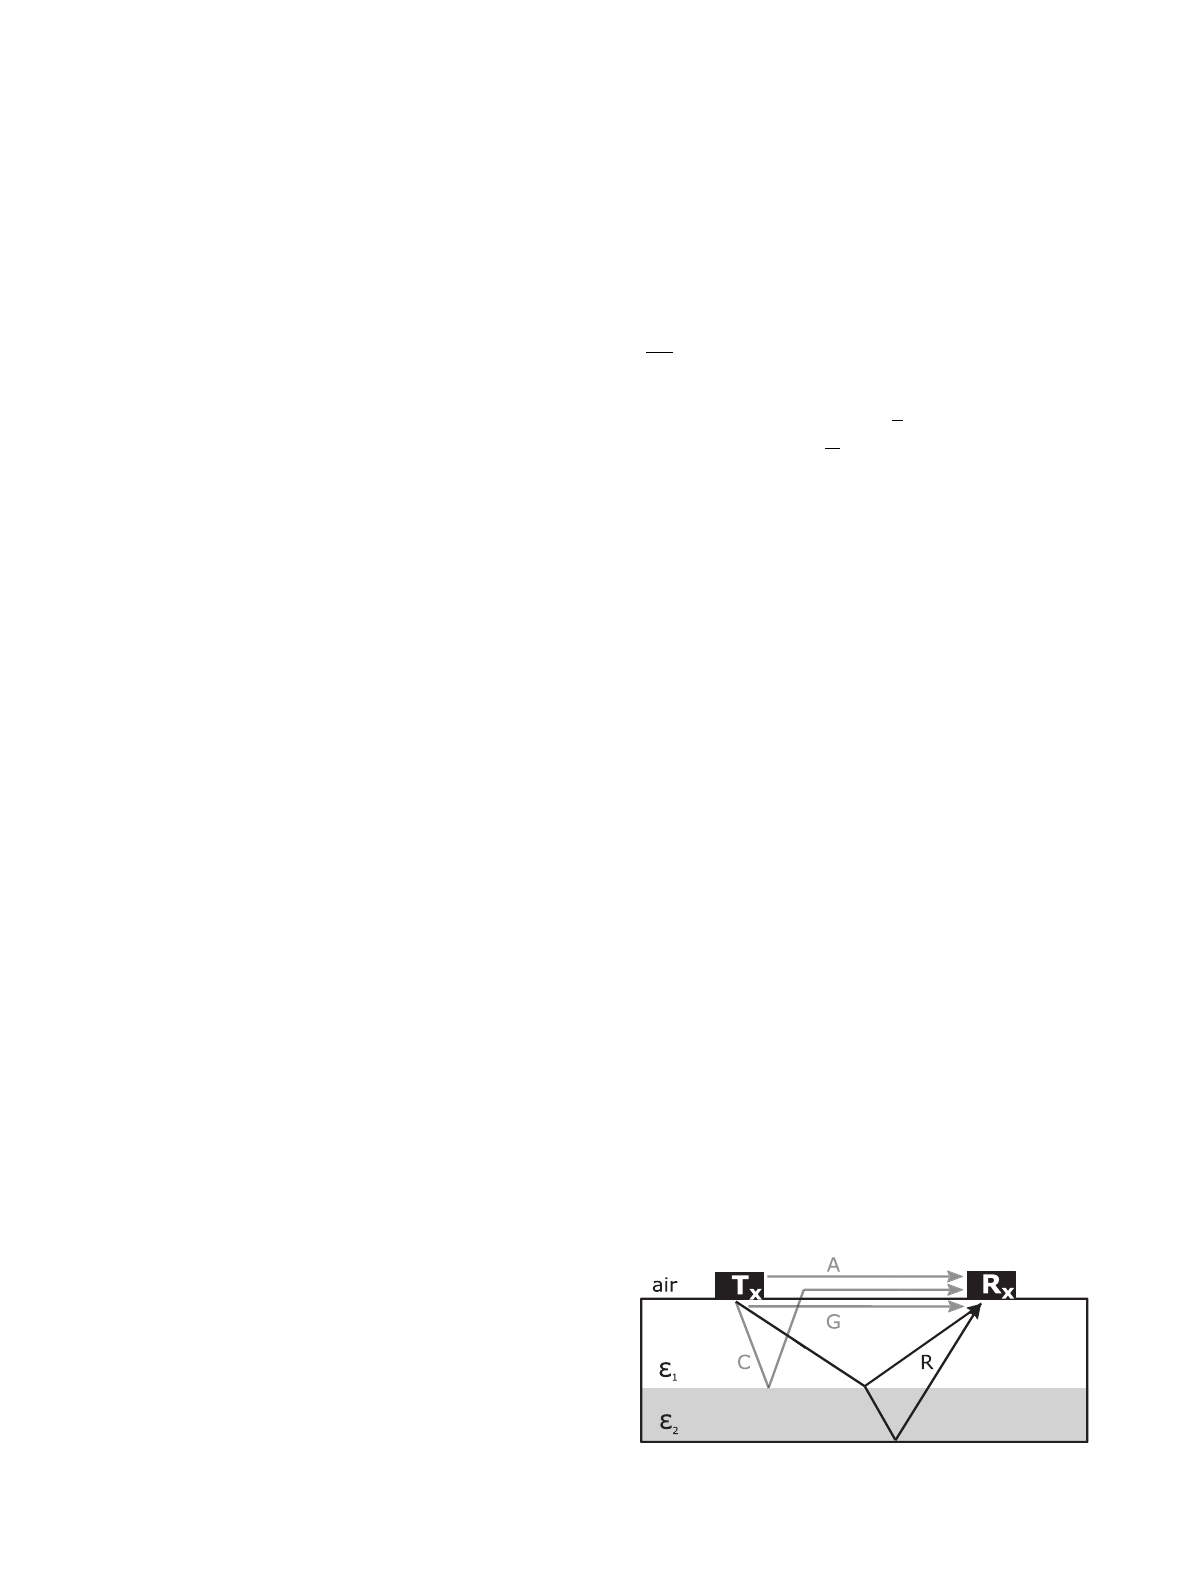
The simplified ray-based wave paths describing these principles
are shown in Fig. 1. The amount of reflected energy (R, black) of
a transmitted pulse is dependent on the difference between the
permittivities
e
1
and
e
2
of two considered materials. Expressed as
a factor in the range of 1 and 1, the reflection coefficient ris cal-
culated as follows:
r¼ffiffiffiffiffi
e
2
pffiffiffiffiffi
e
1
p
ffiffiffiffiffi
e
2
pþffiffiffiffiffi
e
1
pð2Þ
Another important wave path is taken by the direct air (A, grey) and
direct ground (G, grey) wave, which propagate in their respective
medium on the shortest way between transmitter and receiver.
With a small antenna spacing, both waves superpose and form
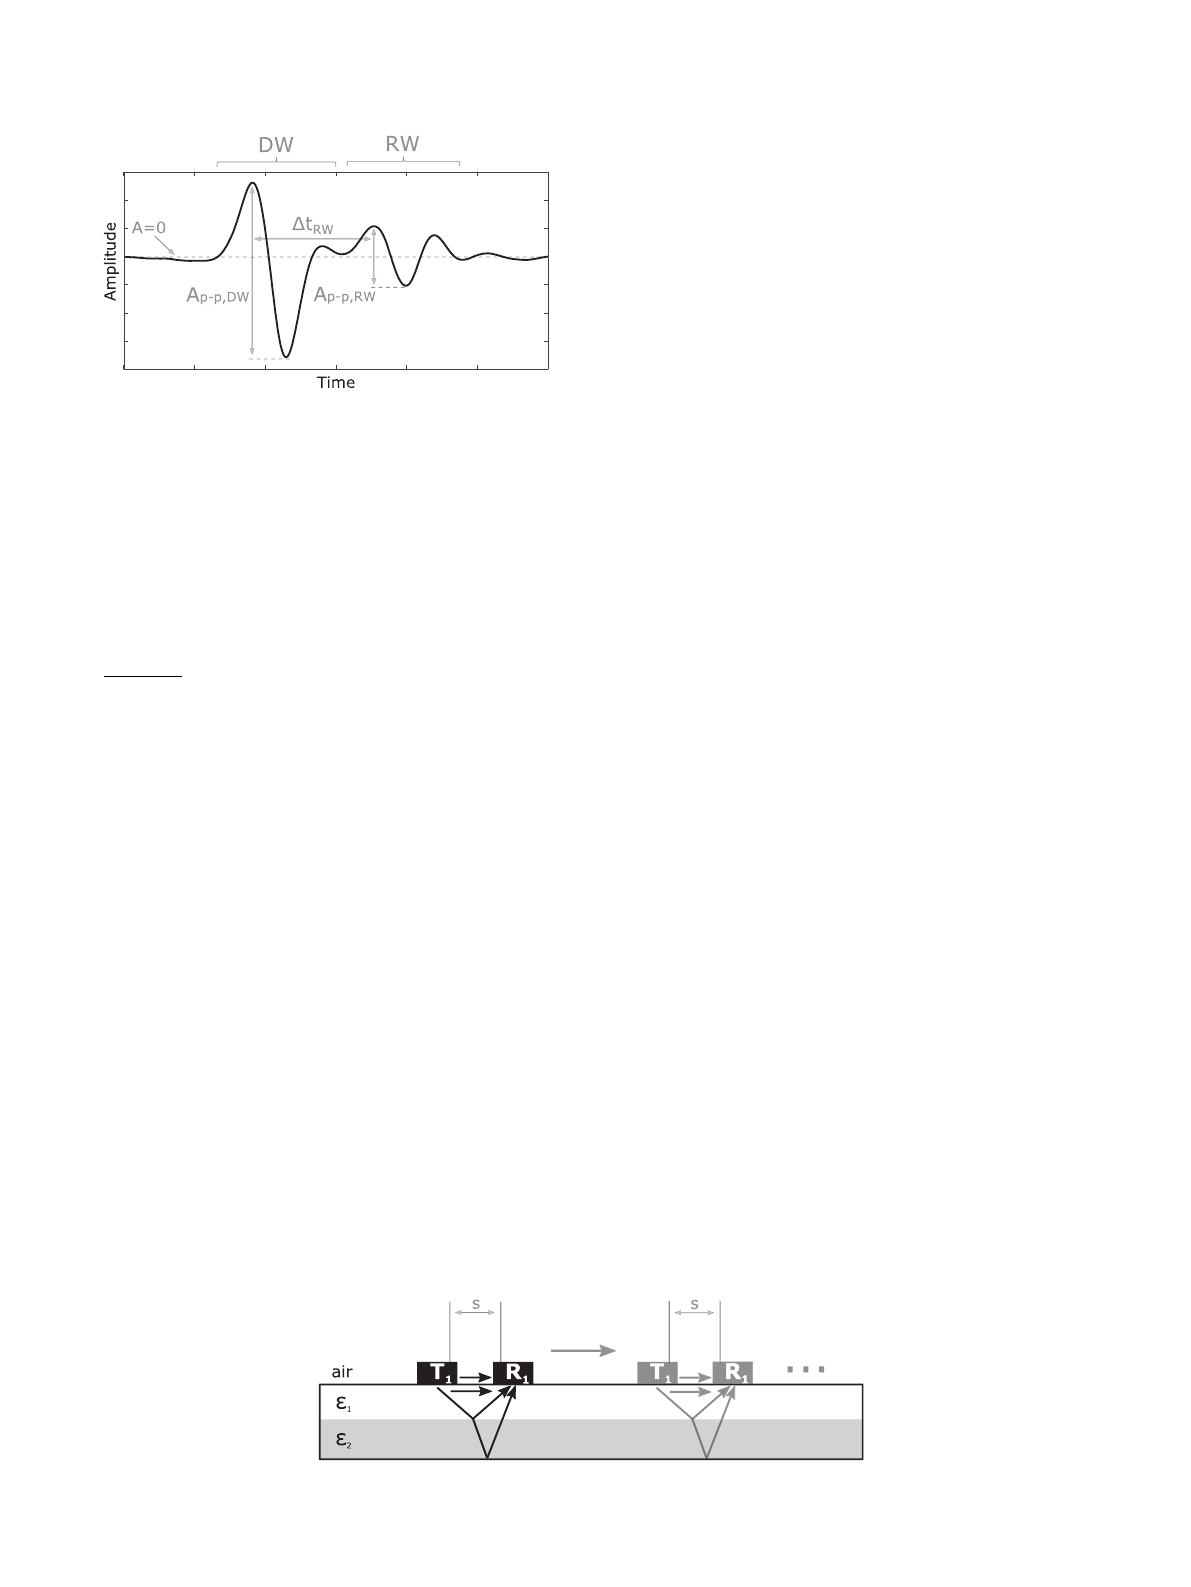
the direct wave (DW) that is seen first in the received signal. A qual-
itative example of such a recorded energy-signal in time domain (A-
Scan) is shown in Fig. 2. The DW is followed by a reflection wave
(RW), with a certain peak-to-peak amplitude A
pp;RW
and a time dif-
ference
D
t
RW
between DW and RW. These basic signal features, as
well as the peak-to-peak amplitude of the DW, can already serve
as good indicators for moisture measurements on building materi-
als, which will be further discussed in Section 5. Similar to optics,
refraction is described by Snell’s law that deals with the relation-
ship of occurring angles on interfaces. For reasons of clarity, the
occurring refraction from e
2
to e
1
is not depicted in Fig. 1. Critical
refractions and reflections (C, grey) also exist. They often superpose
with the reflected wave R, which makes a separate investigation dif-
ficult. In general, the received A-Scan is always a superposition of all
different wave paths, whereas their individual amplitude and sepa-
ration in time and space depend on the spacing between transmit-
ter and receiver as well as on the target depth and on the elevation
of the antenna [31]. Different GPR configurations, therefore, have a
considerable influence on the received signals and their interpreta-
tion. The commonly used set-ups for moisture measurements in
building materials and their underlying parameters are discussed
in the following section.
3. Configurations and their parameters
GPR configurations are divided into two types: reflection and
transillumination measurements. Transillumination is rarely per-
formed in civil engineering since a suitable back wall is often inac-
cessible (e.g tunnels, foundations, containments). Also, the
transmission between a pair of boreholes, as it is applied by geo-
physicists for soil moisture measurements [24,34], is commonly
not used to investigate building materials. This paper, therefore,
focuses on reflection configurations. Here, the common–offset
reflection survey, as shown in Fig. 3, is the simplest and mostly
applied configuration. As the name of the method suggests, the
spacing sbetween a single transmitter and a receiver is kept con-
stant for every measurement position on a survey line. The most
significant parameter is the applied center frequency, which
describes the dominant frequency of the transmitted broadband
pulse. As mentioned in Section 2, it influences the general attenu-
ation and, therefore, the penetration depth. When it comes to mul-
tilayered mediums or rebar localization, the spatial resolution
becomes more relevant since it rises with shorter wavelengths.
This creates a trade-off between resolution and penetration depth
when choosing the most suitable center frequency. GPR frequen-
cies used for material moisture measurements are mainly between
100 kHz and 10 GHz. In case of concrete, frequencies between
1 GHz to 3 GHz yield a good trade-off between spatial resolution
and penetration depth. Other essential parameters are the antenna
spacing s, the antenna orientation, the bit resolution, recording
time window, sampling frequency, the distance between each
measurement and the parallel line spacing (when performing more
than one survey line) [24]. The suitable choice of these values
highly depends on the particular test object and purpose.
When using GPR in reflection configuration, one rarely has pre-
cise information about the underlying layer depth. In that case, a
profound water content estimation through the use of velocity
data is impossible since the traveled distance is unknown. Here,
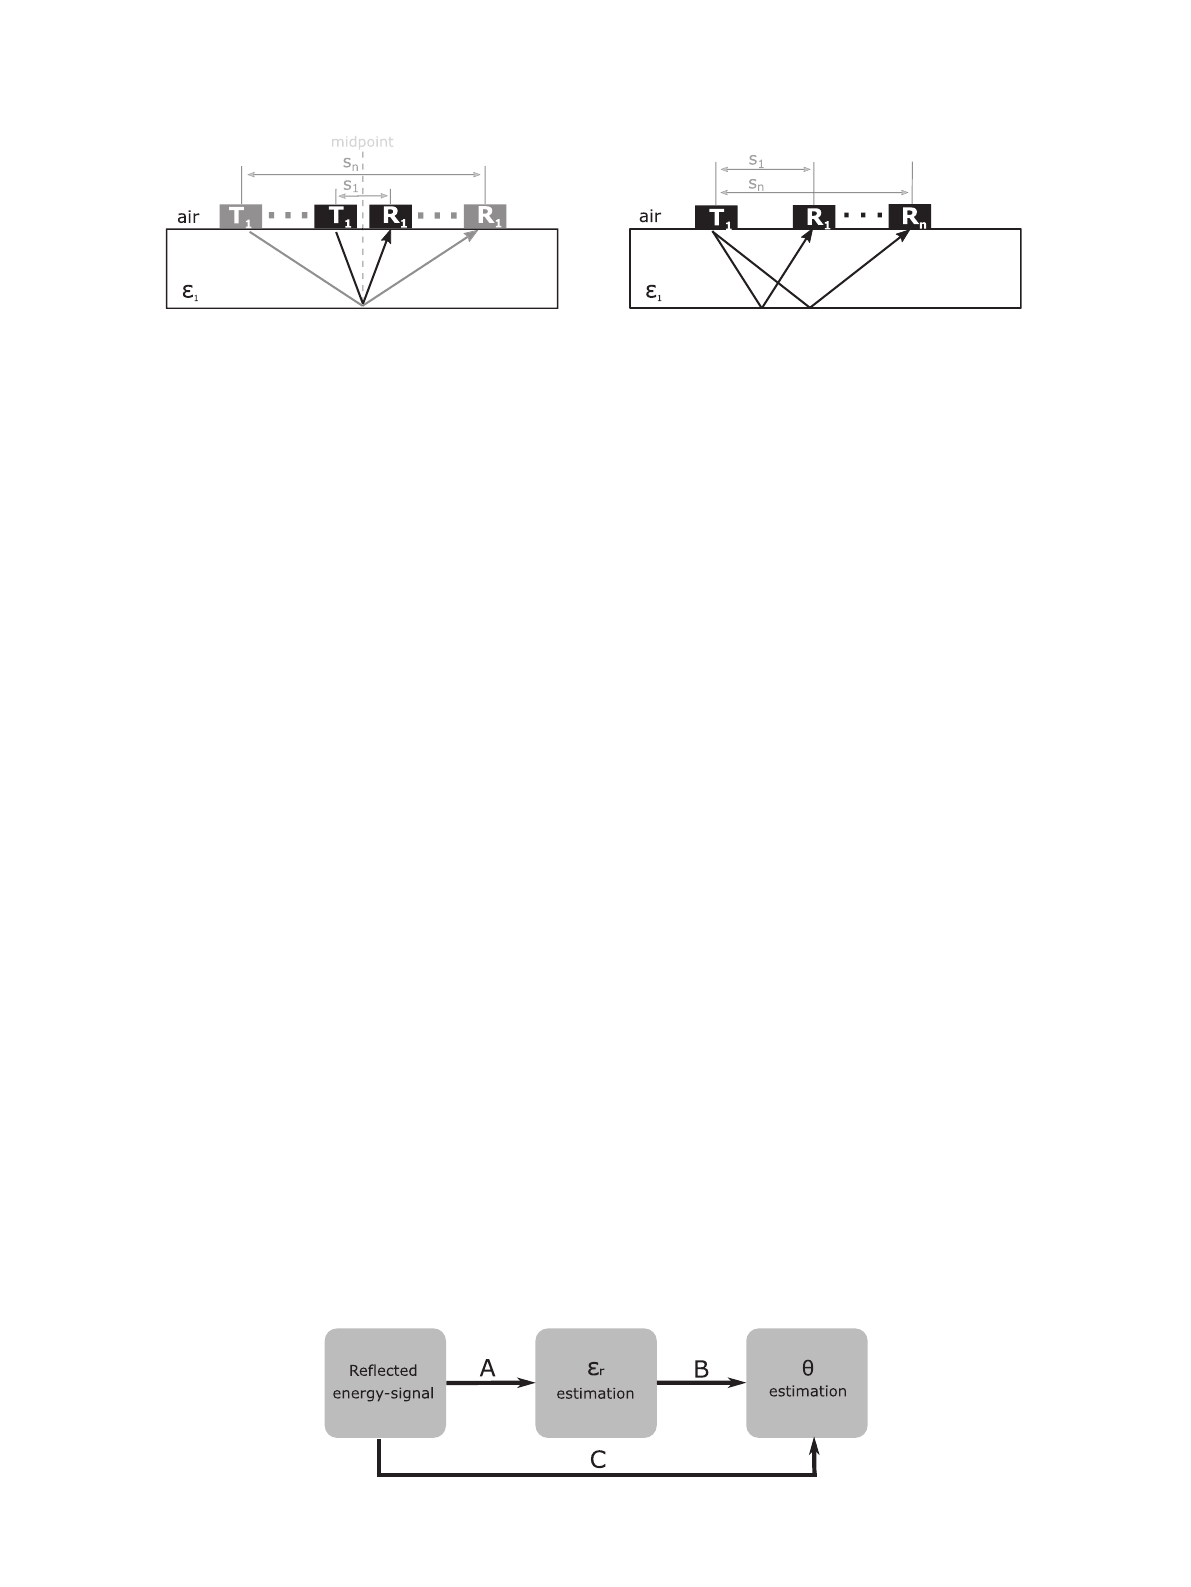
multi-offset configurations like common-midpoint (CMP) and wide
angle reflection and refraction (WARR), as shown in Fig. 4, can be
used. While the CMP method uses a fixed midpoint with a stepwise
increasing spacing between transmitter and receiver, WARR con-
figurations often have one source at a constant location with mul-
tiple receivers in defined distances. WARR can also be performed
by using a single receiver (or transmitter) that is moved further
from the corresponding transmitter (or receiver) with every mea-
surement. The series of reflection waves (B-Scan) collected by
multi-offset techniques form a hyperbola from which velocity
and layer depth can be estimated [35–37]. After that, the obtained
vertical velocity model allows a layer specific permittivity
estimation.
4. Moisture content of building materials
As discussed in Section 2, the permittivity of an investigated
material heavily depends on the moisture content and, therefore,
Fig. 2. Example of a recorded energy-signal in time domain (A-Scan) including the
direct wave (DW) and reflection wave (RW). Basic signal features are the peak-to-
peak amplitudes A
pp;DW
and A
pp;RW
located at the first peaks of DW and RW. The
time difference
D
t
RW
between both peaks is often considered as the travel time.
Fig. 3. Principle of a line measurement with GPR in common-offset configuration and its most important signal paths: Direct air wave, direct ground wave and the reflected
waves.
T. Klewe, C. Strangfeld and S. Kruschwitz Construction and Building Materials 278 (2021) 122250
3
changes when water is adsorbed. Water adsorption or desorption
generally requires an open porosity as well as a hydrophobic
behavior. Several building materials possess these material proper-
ties such as: concrete, screed, mineral rock wool, calcium silicate
plate, etc. In these, the adsorbed water is located in completely
filled pores and partially saturated pores [38].
Concrete is a highly heterogeneous material. Every concrete
mixture has its own composition of water, cement, minerals,
aggregates, additives, etc. This defines the resulting material prop-
erties, e.g. comprehensive strength, the dry density, and resistance
to water and chlorides. Furthermore, the resulting pore system is
also influenced significantly by the concrete composition as well
as by the ambient temperature and humidity. On the long-term,
the pore system might vary due to carbonation, micro-cracking,
and sulphate attack. Thus, every pore system and hence every con-
crete is unique, and a general calibration function does not exist.
Furthermore, the properties of the pore water are not time con-
stant. Chloride and sulphate ingress change the surface tension of
water, which changes the moisture content as well as the relative
permittivity. In conclusion, quantitative moisture measurements
of concrete would require intensive calibration for all the influenc-
ing factors mentioned above. Also in case of assumed perfect dry
concrete samples (all evaporable pore water is released), no uni-
form permittivity exists. Every cement mixture contains different
amounts of chemically bound water, calcium, aluminum, iron,
etc. which influence the final permittivity.
The open porosity varies between 5% and 25% in most cases. The
pore sizes are distributed over several magnitudes and are
described by a representative diameter. Micro-pore diameters are
between 0.4 nm and 2 nm, so called meso-pores are in the range
of 2 nm to 100 nm, and macro-pores range from 100 nm up to
100
l
m[39]. In these pores, the material moisture is located in liq-
uid phase at the pore surface/ fringe and in vapor phase in the pore
center. Occurring transportation processes are a two-phase flow
including both phases, vapour and liquid. The total porosity and
the distribution of the different pore sizes determine the capability
of adsorption and desorption of water. The function which relates
the water vapour partial pressure, i.e. relative humidity and the
resulting material moisture is the so-called sorption isotherm.
In most cases, the moisture content of concrete is between
0.15 M% and 10 M%. It is defined as the ratio between the mass
of moisture divided by the mass of the dry material. Besides this
definition, sometimes the moisture content is based on the mass
of the wet material or the volumetric moisture content is given
[40]. For comparison, these values must be converted to each
other. In the following, we use the definition based on the mass
of the dry material. Obviously, this requires the knowledge of the
dry mass. One common approach is oven drying to evaporate the
mobile water in the pores [41]. Depending on the sample size, this
might take up to several days. If mass constant is reached, the sam-
ple is considered as dry and all evaporable/ mobile water is
released. Nevertheless, the cement matrix still contains a lot of
chemically bound water. This water is immobile and never con-
tributes to the moisture transport [11]. However, if the oven tem-
perature is too high, this chemically bound water is partially
released as well, which leads to systematic deviations from the
‘‘true” moisture content. In practice, various drying temperatures
are established for different materials (cement based, calcium-
sulphate based, clay minerals, etc.) and different testing purposes.
Therefore, we will emphasize to consider clearly the drying
method and a suitable temperature (in case of oven drying) when
using moisture content values for calibration.
5. Determination of material moisture based on GPR
After the reflected energy-signals are recorded (Fig. 2), there are
two possible ways to estimate the underlying water content h. The
first is illustrated by the steps A and B in Fig. 5, where the
h-estimation is based on a preceding
e
-estimation. This is an appro-
priate approach, since the electric permittivity
e
strongly depends
on the material moisture [42]. However, such two-step calcula-
tions may increase the risk of error accumulation and therefore,
already require a precise determination of
e
. With a known
e
,
petrophysical models derived from empirical studies can be
applied to calculate hð
e
Þ. Topp’s equation [43] is the most com-
monly used model in geophysics to estimate soil moisture
[16,17]. Therefore, it is also applied in civil engineering to derive
hof subgrades below pavement and railway structures
[20,44,45]. It provides a basic polynomial approximation for hð
e
Þ,
which only regards the real part of
e
. For asphalt mixes, Fernandes
et al. [46] applied a modification of the complex refractive index
model (CRIM) derived by Wang and Lytton [47] to estimate the
moisture content. CRIM offers a more complex approach, which
requires further knowledge about the volumetric fraction of differ-
ent material components. An overview of various petrophysical
models and further literature can be found in [48].
Fig. 4. GPR with multiple offsets: common-midpoint (CMP, left) and wide angle reflection and refraction (WARR, right) configuration.
Fig. 5. Principle of signal processing to estimate the moisture content hby using the reflected energy-signal of GPR.
T. Klewe, C. Strangfeld and S. Kruschwitz Construction and Building Materials 278 (2021) 122250
4

When there is no established model for the investigated mate-
rial, like for concrete, site-specific relationships based on the col-
lected data serve as a suitable way to evaluate h[49]. However,
those fitted models always require an accurate reference of the
underlying water contents. Here, the gravimetric method, as dis-
cussed in the previous section, provides results by drying and
weighing collected samples (e.g. drilling cores) according to ASTM
D2216-19 [41].
Such references also enable the second possible way to estimate
h, which is shown by step C in Fig. 5. This approach skips the
e
-
estimation by formulating a direct relationship between the
received GPR signals and the obtained moisture data. Both
approaches, AB and C, require characteristic signal features that
correlate with h. Those features commonly applied in civil engi-
neering can be divided into time, amplitude, and frequency fea-
tures. Their related methods and limitations will be discussed in
the following sections.
5.1. Travel time and velocity features
Measuring the time
D
tthat it takes for a transmitted and
reflected impulse to travel back to its origin is by far the oldest sig-
nal feature in radar technology [50]. It is generally used to detect
objects and to calculate their distance dwith Eq. 3by means of
the known wave velocity
v
.
v
¼2d
D
tð3Þ
When performing moisture inspections with GPR, the permittivity
of an investigated medium and hence the propagation velocity
(Eq. 1) is obviously unknown. Therefore, a known reflector depth
is one possibility to calculate
v
and eby measuring
D
t. It is usually
performed in laboratory studies where the dimensions of test spec-
imens are given, like in the works of Fernandes et al. [46], Lai et al.
[22] and Laurens et al. [21]. Such set-ups allow an accurate determi-
nation of edepending on the water content hwith a normal com-
mon–offset survey. This approach is also applicable to
multilayered structures, as shown by Grote et al. [20]. Here,
D
tis
the time passing between two reflections from the top and bottom
of a specific layer. In singlelayered mediums,
D
tis often defined as
the time difference between the first peak of the direct and the
reflection wave (see Fig. 2), since the true time-zero is not available
[51]. In the study of Viriyametanont et al. [52], the authors even
propose a delay correction when using the direct wave as a time ref-
erence. This is motivated by a measurable influence of the underly-
ing moisture content on the direct wave velocity, which can vary in
near surface areas. The correction is calculated with a given trans-
mitter to receiver offset and the wave velocity obtained from vari-
ous rebar reflections in known depths.
In practice, usually the propagation velocity, as well as the
reflector depth, are unknown. In this case, ASTM D6432-11 [37]
suggests two techniques to obtain
v
from measured travel times.
The first is called hyperbolic geometry and can be performed in
common–offset configuration. It requires point reflectors such as
pipes or rebars that cause a hyperbolic pattern in the radargram
(B-Scan), from which the propagation velocity can be derived. Che-
ung and Lai [53] recently used this technique to detect water-pipe
leakages by observing significant velocity drops compared to
undamaged dry areas. A quantitative approach was studied by
Koyan et al. [54] who presented a migration-based velocity analy-
sis on multiple rebar reflections, however, this was done with
known reflector depths to conduct a time-zero correction. Here,
occurring uncertainties were mainly caused by interferences due
to a small spacing between the rebars and a limited vertical reso-
lution for shallow rebar depths.
The second way to obtain
v
without a known dis called velocity
sounding which describes the use of the CMP or WARR survey
method, as mentioned in Section 3. CMP measurements were
applied by Cai et al. [45] and Grote et al. [20] to obtain a vertical
velocity characterization for railway and pavement structures,
respectively. The use of such multi-offset configurations also
allows greater spacing between transmitter and receiver. There-
fore, the travel time of the direct wave gets more relevant while
it is barely considered in common–offset configuration. Klysz and
Balayssac [19] suggest the analysis of direct wave travel times with
WARR configuration to estimate the mositure content of concrete
covers. However, it is important to mention that only near surface
moisture can be measured with this technique, since the penetra-
tion depth of the ground wave is limited [55].
5.2. Amplitude and attenuation features
Quantitative estimation of underlying permittivities by analyz-
ing the received signal amplitudes is very challenging compared to
the use of travel times [20]. The theoretical approach is given with
Eq. 2, which suggests the evaluation of occurring reflections on a
boundary of two different permittivities. Besides the need of one
given
e
, this method often leads to inaccuracies due to several
other influences on the amplitude. In complex mediums, like con-
crete, the propagating waves experience a lot of scattering through
heterogeneously distributed electrical properties [25].An
increased moisture content leads to the presence of more water
filled pores and thus to more heterogeneities and a higher conduc-
tivity. Furthermore, attenuation grows with longer travel paths
and rising frequencies, which distorts an amplitude-based
e
-
estimation even more.
The use of an air-launched and, therefore, air-coupled antenna
configuration makes it possible to analyze the reflection that
occurs on the air-material interface. Air, as the overlying medium,
has a known permittivity
e
air
¼1 and causes comparatively low
losses. Thus, the permittivity of the underlying material
e
m
can
be calculated with the following equation:
e
m
¼1þ
A
0
A
m
1
A
0
A
m
"#
2
ð4Þ
Here, the reflection coefficient is defined as r¼A
0
=A
m
with the
reflected air-surface amplitude A
0
, that is scaled by the highest pos-
sible amplitude A
m
. This maximum can be easily obtained with the
use of a metallic reflector in the same distance as the investigated
surface. Benedetto et al. [44] used this technique to map the spatial
variation of soil moisture as a preinvestigation for pavement appli-
cations. However, this approach only covers moisture near the sur-
face and ignores possible permittivity changes in deeper areas. To
capture those, Maser and Scullion [56] also analyzed the reflections
from the asphalt-bottom to estimate the moisture content of the
underlying base layer. Obviously, this method encounters all the
aforementioned uncertainties with the additional risk of error accu-
mulation by the use of previously estimated asphalt permittivities.
Due to the numerous unknown influences for on site investiga-
tions, most of the works that study the correlation between ampli-
tudes and water content were performed under laboratory
conditions. A controlled environment also allows the use of addi-
tional metallic reflectors below the investigated specimens to
emphasize the occurring reflections or to generate reference
amplitudes for scaling/ normalization. As a signal feature, Hugen-
schmidt and Loser [57] used the quotient between the reflected
amplitudes at the concrete surface and those at an aluminum sheet
below the bottom. The authors observed a qualitative correlation
with the water content of concrete as well as with ingressed chlo-
rides that increase the underlying conductivity and therefore cause
T. Klewe, C. Strangfeld and S. Kruschwitz Construction and Building Materials 278 (2021) 122250
5
Loading more pages...