
3rd PLATE Conference
September 18 – 20, 2019
Berlin, Germany
Nils F. Nissen
Melanie Jaeger-Erben (eds.)
Universitätsverlag der TU Berlin
Woidasky, Joerg; Cetinkaya, Esra: Laptop use patterns research on prod-
uct lifetime and obsolescence aspects . In: Nissen, Nils F.; Jaeger-Erben,
Melanie (Eds.): PLATE – Product Lifetimes And The Environment : Proceed-
ings, 3rd PLATE CONFERENCE, BERLIN, GERMANY, 18 – 20 September
2019. Berlin: Universitätsverlag der TU Berlin, 2021. pp. 867 – 872. ISBN
978-3-7983-3125-9 (online). https://doi.org/10.14279/depositonce-9253.
This article – except for quotes, fi gures and where otherwise noted – is
licensed under a CC BY 4.0 License (Creative Commons Attribution 4.0).
https://creativecommons.org/licenses/by/4.0/.
867
3rd PLATE 2019 Conference
Berlin, Germany, 18-20 September 2019
Laptop Use Patterns Research on Product Lifetime and
Obsolescence Aspects
Cetinkaya, Esra; Woidasky, Jörg
Hochschule Pforzheim - Fakultät für Technik, Pforzheim, Germany
Keywords: Laptop Obsolescence; Use Pattern; Survey; Students.
Abstract: The aim of this study is to acquire information on the user behavior of laptop (including
notebooks, laptops, subnotebooks, netbooks, or ultrabooks) users. A questionnaire-based survey was
carried out at a University in Southwestern Germany in 2015, and duplicated in 2018. Results show
amongst others that on average no defect occurs immediately after the manufacturers’ warranty
period. About 80% of all devices worked flawlessly throughout their use phase. Life time expectation
for the devices clearly exceeded 5 years, but the actual use phase duration was found to be only
about 80% of this time span. Almost 2/3 of all predecessor notebooks were stored after the end of
their useful life, and only 11% disposed of.
Introduction and Study Goal
Planned obsolescence is an effect often
discussed but not proven in empirical research.
Portable computers according to literature
typically show use phase lengths between 3
and 6 years (Hennies & Stamminger, 2016).
Research shows that the duration of the first
usage period of electrical products such as
notebooks, TV sets or other household
appliances was observed to become lower in
recent years (Prakash et al., 2016).
The aim of this study is to present the current
state of discussion on the obsolescence of
electrical and electronic devices and to acquire
information on the user behavior of laptop
users by evaluating empirical data, which can
be associated with obsolescence observations.
Research was carried out not only to define the
exact use phase length of portable computers,
but also to identify the user’s expectations and
attitudes towards use patterns, use phase
length expectations, and tentative planned
obsolescence experiences. The hypothesis to
be researched was that laptop users may claim
to have become victims of planned obso-
lescence if their devices fail to meet their use
phase length expectations, regardless of the
actual technical performance of the devices.
Definitions
In this study, all portable computers such as
notebooks, laptops, subnotebooks, netbooks,
or ultrabooks are counted under the term
“laptop”.
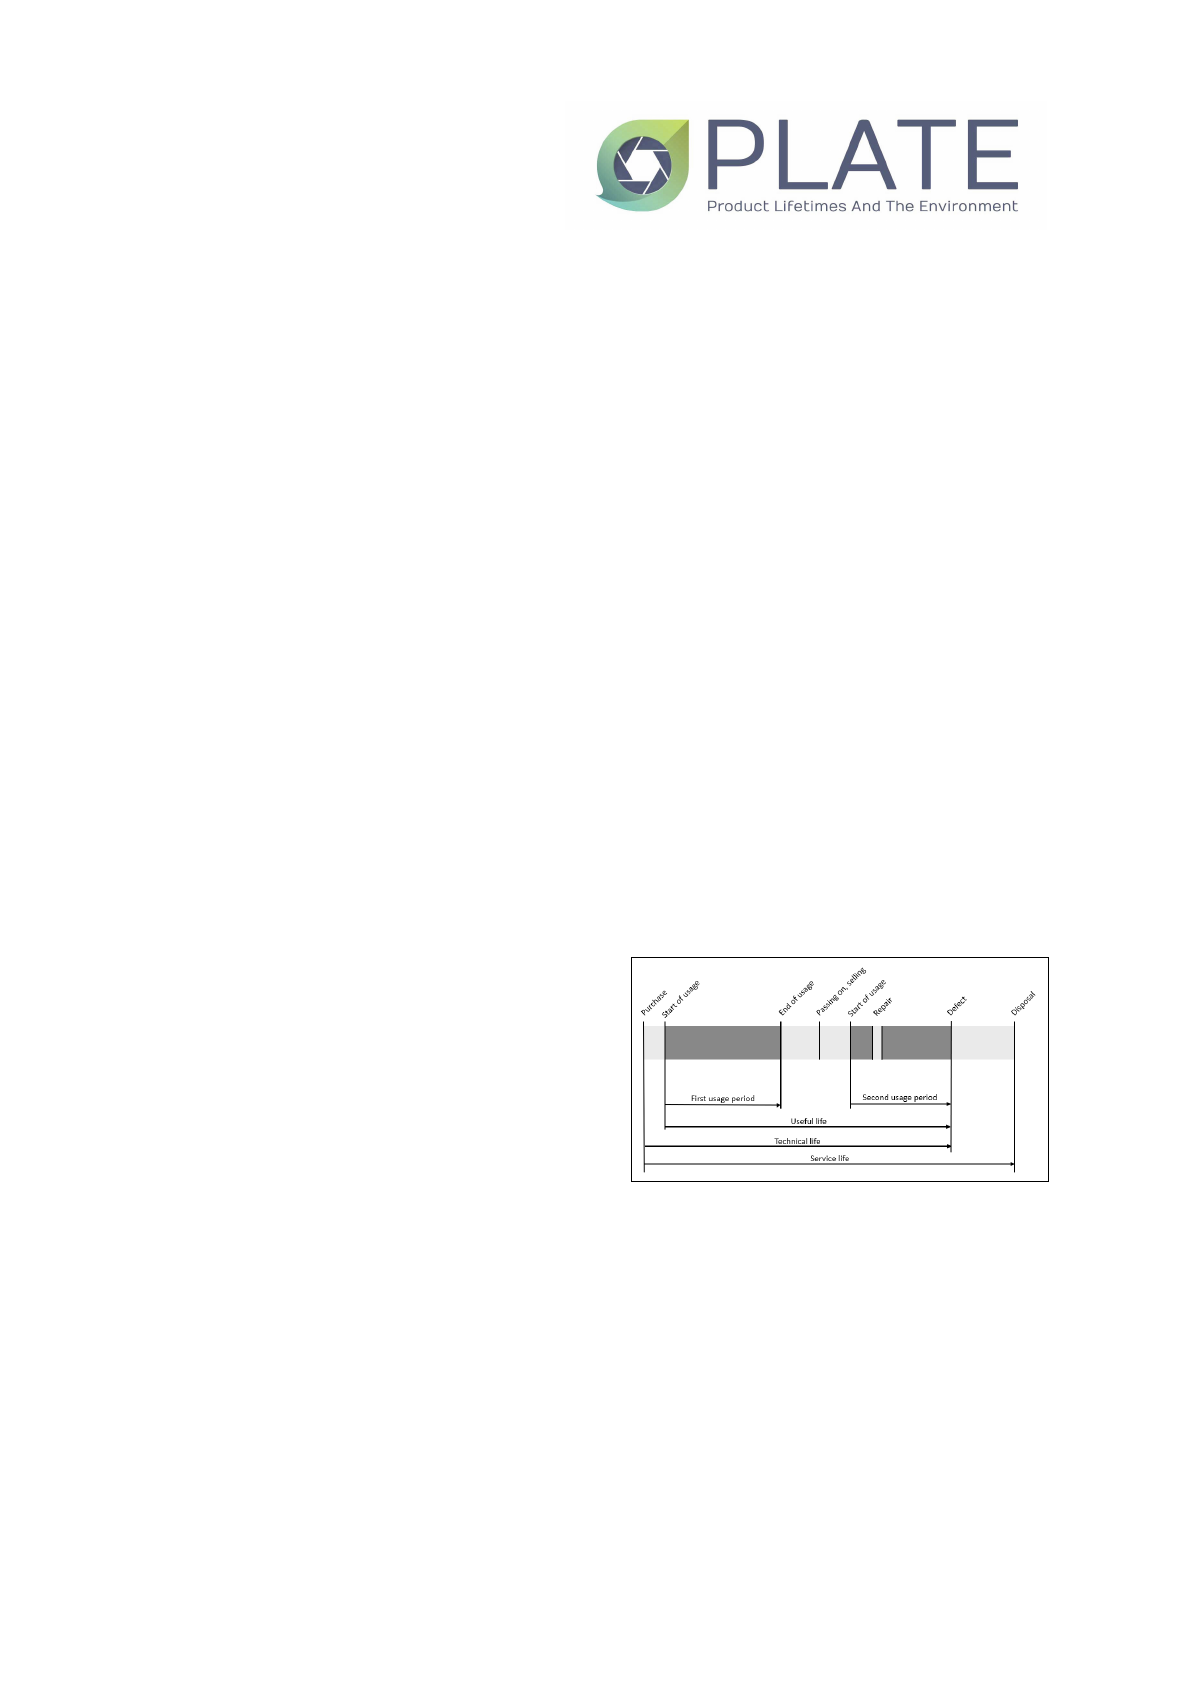
The useful life is defined as the period
between the first and last use of a product. It
may also denote the period of time between
the first and last use of a product by the same
person, family or organization. In this case, it is
referred to as the first/second/ usage period.
Figure 1. Use phase and life time of products
(based on Tröger et al., 2017)
The service life is defined as the period
between the purchase or acquisition of the
product and its disposal. The technical life, on
the other hand, indicates the time between the
purchase and the defect of the device.
Technical life and service life may not be
necessarily identical (Figure 1) (Tröger et al.,
2017).
The term “obsolescence” includes all
processes that lead to the wear and tear,
ageing or loss of value of a product, regardless
868
3rd PLATE Conference Berlin, Germany, 18-20 September 2019
Cetinkaya, Esra; Woidasky, Jörg
Laptop use patterns research on product lifetime and obsolescence aspects
of whether these occur naturally or artificially
(Reuß, 2015; Prakash et al., 2016).
Natural obsolescence expresses ageing due to
normal wear and tear, whereas artificial
obsolescence can be caused either by the
users’ misconduct or intentionally by the
manufacturer or the retailer. The latter is
referred to as "planned obsolescence".
(Hübner, 2013)
State of Technology
In 2018 alone, approximately 164.1 million
notebook devices were sold worldwide (IDC,
2019). Table 1 shows the manufacturers'
market shares of notebook sales worldwide.
The three most successful manufacturers in
recent years have been HP, Lenovo and Dell.
Since 2015, these three manufacturers to-
gether have covered more than half of the
market, and in 2018, their projected market
share was at 60.8%.
Literature research shows a wide range of the
average useful and service life (Table 2) for
laptop computers, in the case of useful life
span ranging from 4 to 6 years, with service
life ranging from 4.1 to 5.6 years.
2013 2014 2015 2016 2017 2018**
HP 17.5 % 20.1 % 20.5 % 22.4 % 24.3 % 24.4 %
Lenovo 15.9 % 17.5 % 19.9 % 21.7 % 20.2 % 20.8 %
Dell 11.3 % 12.3 % 13.7 % 15.4 % 15.2 % 15.6 %
Asus 9.7 % 11.0 % 10.3 % 10.3 % 9.5 % 9.8 %
Apple 6.6 % 9.3 % 10.3 % 8.3 % 9.6 % 10.4 %
Acer 10.4 % 10.0 % 8.9 % 8.1 % 8.0 % 8.2 %
Samsung* 7.7 % 2.7 % 1.7 % - - -
Toshiba* 7.5 % 6.6 % 4.2 % - - -
Sony* 3.7 % 0.6 % - - - -
Other 9.8 % 9.9 % 10.3 % 13.8 % 13.0 % 11.0 %
* The source does not provide information on sales in all quarters.
** Forecast
Table 1. Manufacturers' market shares of notebook sales worldwide (Trendforce, 2017).
Table 2. Useful life and service life of laptops in literature.
Survey Methods
Adrion (Adrion, 2015) carried out a question-
naire-based survey in a student environment in
Southwestern Germany with several hundred
students. A pre-tested questionnaire com-
prising in total 29 questions on the previously
used and on the actual laptop was used.
Details on the interviewees’ attitudes, laptop
use phase lengths and use pattern, repairs,
and also sociological milieus were collected.
Based on multi-stage cluster sampling,
randomly selected groups (courses) of
bachelor students (8 out of 21 bachelor study
programs) and master students (6 out of 12) of
Type of data collection Useful life in
years
Service life in
years
Reference
[* data reference year]
German household survey (2004-2007) 5.4 – 6
(2004-2007*)
(Prakash et al., 2016)
German household survey (2010-2012) 5.1 (2012*) (Prakash et al., 2016)
Consumer survey in the Netherlands verified by
data from recycling facilities
4.1
(2000*)
(Bakker et al., 2014)
Consumer survey in the Netherlands verified by
data from recycling facilities
4.3
(2005*)
(Bakker et al., 2014)
Student survey (2015) 4 (Adrion, 2015)
Online survey in Austria 4.1 (Wieser & Tröger,
2015)
Online survey in Germany (2013/2014) 5 (Hennies &
Stamminger, 2016)
Student survey (2018) 4.7 (Müller et al., 2018)
Life-cycle assessment study 5.6 (IVF, 2007)
Life-cycle assessment study 4 (O’Connell & Stutz,
2010)
Life-cycle assessment study 5 (Prakash et al., 2012)
869
3rd PLATE Conference Berlin, Germany, 18-20 September 2019
Cetinkaya, Esra; Woidasky, Jörg
Laptop use patterns research on product lifetime and obsolescence aspects
the schools of Engineering and Business/Law
were selected as interviewees. After coding of
the answers, SPSS was used for answer pro-
cessing and analysis. This panel study was
carried out in May 2015 by Adrion (Adrion,
2015), and duplicated after small modifications
in June 2018 by Müller et al. (Müller et al.,
2018).
With SPSS, the data were analyzed both
statistically and graphically. For the evaluation
of special cases, minimum scopes, such as at
least 10 valid answers, were defined. In a final
step, all data sets of the 2015 and 2018 works
were checked for consistency.
As recommended by Akremi et al. (2011), the
data window is first viewed, to notice any
unusualness. In the next step, the data values
are compared with the values in the code plan.
Subsequently, questions that are related to
each other are considered. First, all questions
about the current notebook were displayed
and then all questions about the previous
notebook. This is intended to eliminate or
adapt inconclusive answers. The
inconsistencies determined with the help of
Excel are changed and improved in the data
set before the actual evaluation of the data
takes place. The data is then analyzed and
evaluated regarding the user behavior of the
respondents.
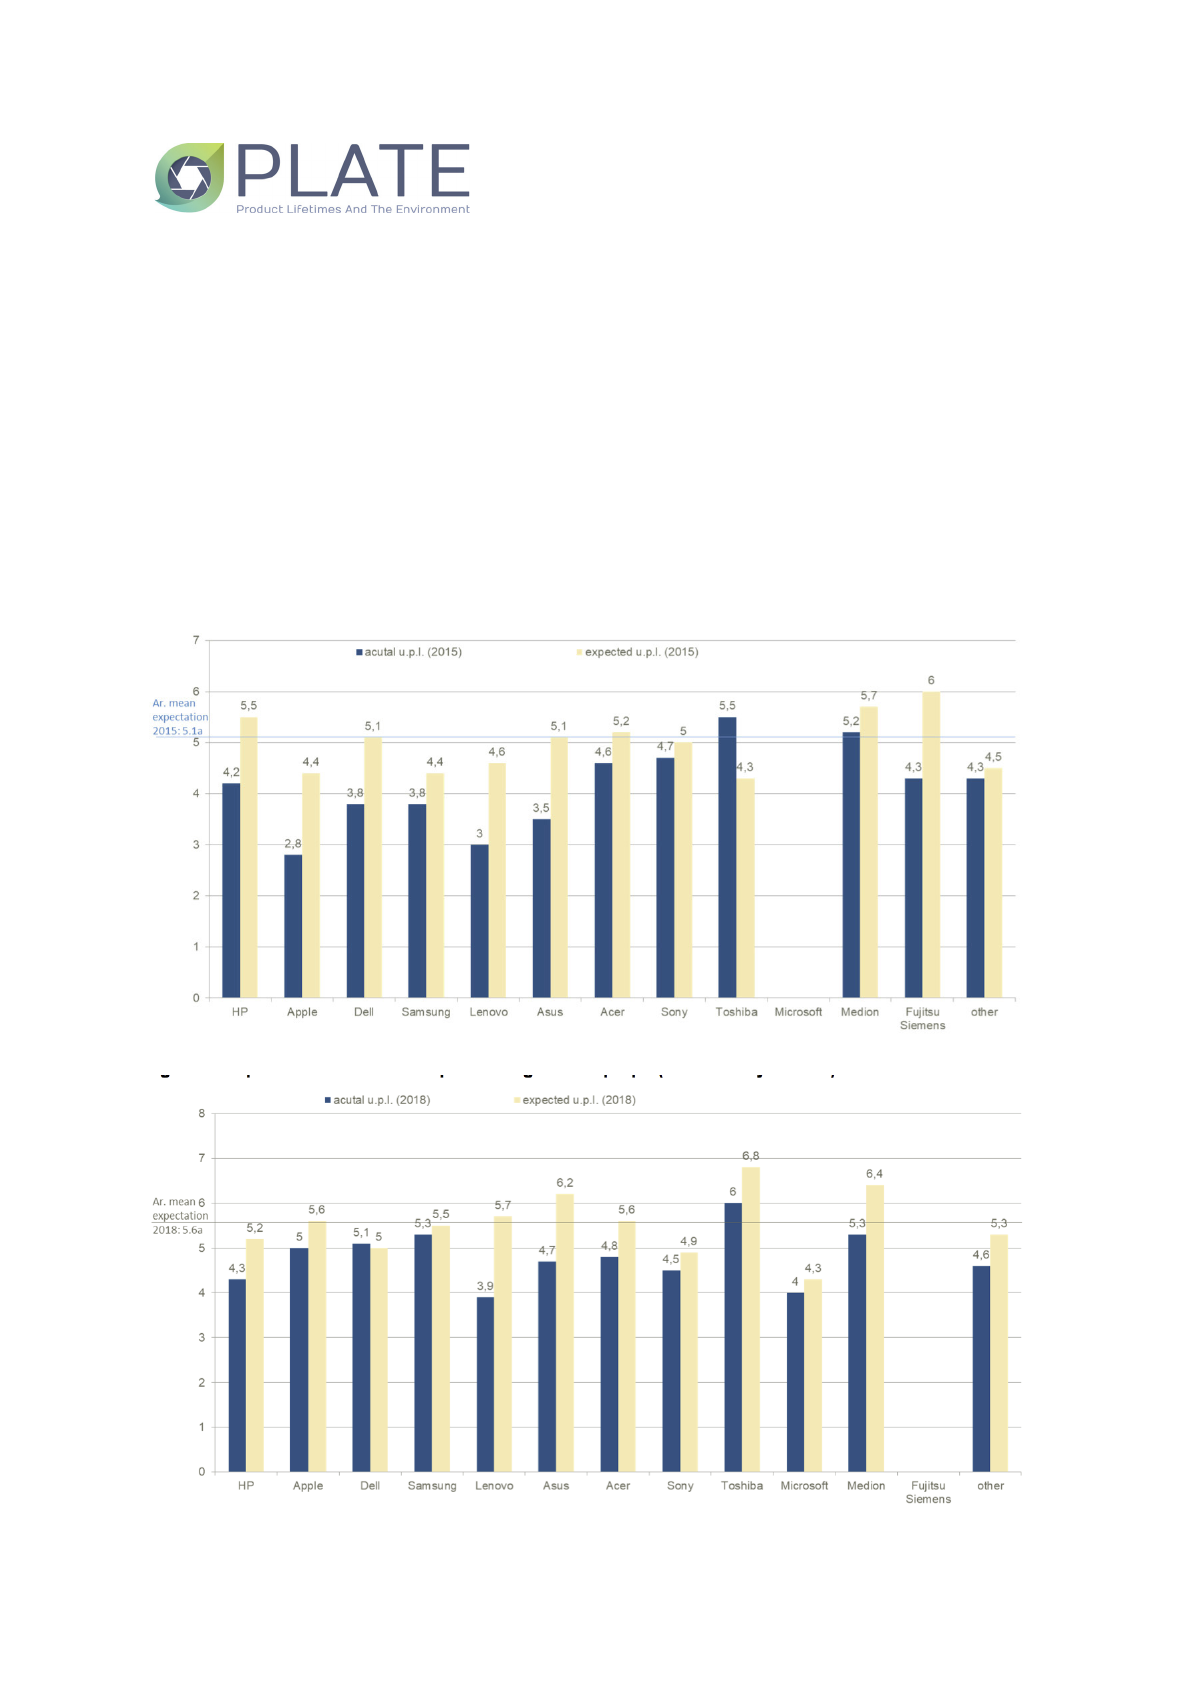
Figure 1. Expected and actual use phase lengths of laptops (2015 survey results).
Figure 2. Expected and actual use phase lengths of laptops (2018 survey results).

870
3rd PLATE Conference Berlin, Germany, 18-20 September 2019
Cetinkaya, Esra; Woidasky, Jörg
Laptop use patterns research on product lifetime and obsolescence aspects
Results and Discussion
The number of interviewees in 2015 was 215
students, and 336 in 2018. In total, 212
evaluable questionnaires (99%) in 2015 were
obtained, and 332 questionnaires in 2018 with
a share of 98.8% evaluable results. The share
of female interviewees in 2015 was 51% and
44.6% in 2018, respectively.
Laptop Useful Life Length
The main result obtained from the surveys was
the mean actual life length of the previous
laptop, i. e. information on the users’ laptop
which is not in use any more: This laptops
useful life has ended and thus it is clearly
defined. The mean actual useful life of these
devices in 2015 was 4.0 years (ranging from
2.8 years of Apple devices to 5.5 years of
Toshiba devices), and 4.7 years in 2018 (from
3.9 years of Lenovo devices to 6.0 years of
Toshiba laptops). Comprehensive brand
specific results are shown in Figure 1 for 2015
and in Figure 2 for 2018, both for actual and
expected useful life length.
The mean expected useful life duration in 2015
was 5.1 years. This expectation was only met
by Toshiba devices (5.5 years actual use
phase length), and Medion devices (5.2
years). The expected useful life in 2018 was
5.6 years, which was only exceeded by the
actual mean useful life duration of Toshiba
devices with 6.0 years.
Brands and Brand Loyalty
In both 2015 and 2018 surveys, Apple (2015:
20.9 %; 2018: 23.8 %) and Lenovo (2015:
20.4 %; 2018: 19.6 %) were the most frequently
named brands among current devices. They
were able to significantly increase the current
number compared to the previous one. ACER
and Asus also lead in both years for the
predecessor models. In the year 2018, the
number of current HP devices (2015: 9.2 %;
2018: 15.6 %) has increased remarkably.
Compared to the global notebook market,
differences can be identified. Worldwide, HP
has the largest market share in all years, while
Apple had a market share of 10.3% in 2015, a
market share of 10.4% was forecasted for
2018. Another difference includes Dell's shares.
In the surveys (2015: 6.3%, 2018: 1.6%), Dell’s
share in the sample is considerably lower than
its global market share (2015: 13.7%, 2018:
15.6%). The differences could originate from
the fact that data originate from a specific
regional market: Students have different
demands and requirements, and they only
cover a narrow range of age.
Looking at the users’ brand changing behavior
from previous and actual devices, brand
loyalty was quantified. The results show that
users are predominantly switching between
the brands. It is noticeable that Apple is the
only manufacturer showing relatively low churn
rates in both surveys (2015: 14.29 %; 2018:
33.33 %). In order to further question the facts,
the importance of the brand prestige was
analyzed. More than 50% of Apple users rate
brand prestige as "important" or "very
important" in both surveys, again
distinguishing it strongly from other users.
Consequently, it can be said that notebook
users tend to have a low level of brand loyalty,
except for Apple users. They seem to value
Apple's brand prestige, which is reflected in
low churn rates from the brand. Moreover,
Apples products form a closed system, which
obstructs brand switching (“lock-in effect”).
Repairs and Warranty Period
In 2015, more than one fifth of the devices in
use were repaired at least once. In the case of
the predecessor models, the value was
approximately one third. If all repairs are taken
together, half of the repairs were carried out
within 2 years. 22% of all repairs took place at
the devices age between two and three years.
(Adrion, 2015)
In 2018, 17.8% of current notebooks and just
over a third of old devices are repaired at least
once. Most repairs are carried out after one to
two years on both the current and the previous
notebook. (Müller et al., 2018)
The respondents were also asked about the
manufacturers’ warranty. Comparison of the
average manufacturers’ warranty duration with
the average useful life shows that on average
no defect occurs immediately after the
manufacturers’ warranty period has ended.
(Adrion, 2015; Müller et al., 2018)
Expected Useful Life vs Actual Useful Life
Asking for expectations about how many years
of use a notebook should provide, average
values of 5.3 years in 2015 and 5.6 years in
2018 were obtained. The average actual
useful life of predecessor devices was 4 years
(2015), or 4.7 years respectively (2018). Thus,
the expected useful life in both cases is
significantly higher than the actual useful life of
the predecessor devices. (Adrion, 2015; Müller
et al., 2018)
Loading more pages...