
ORIGINAL RESEARCH
published: 29 April 2022
doi: 10.3389/fsufs.2022.826437
Frontiers in Sustainable Food Systems | www.frontiersin.org 1April 2022 | Volume 6 | Article 826437
Edited by:
Sören Köpke,
University of Kassel, Germany
Reviewed by:
Elena Lioubimtseva,
Grand Valley State University,
United States
Jaroslav Hofierka,
Pavol Jozef Šafárik University in
Košice, Slovakia
*Correspondence:
Monika Egerer
Specialty section:
This article was submitted to
Water-Smart Food Production,
a section of the journal
Frontiers in Sustainable Food Systems
Received: 30 November 2021
Accepted: 24 March 2022
Published: 29 April 2022
Citation:
Nolte AC, Buchholz S, Pernat N and
Egerer M (2022) Temporal
Temperature Variation in Urban
Gardens Is Mediated by Local and
Landscape Land Cover and Is Linked
to Environmental Justice.
Front. Sustain. Food Syst. 6:826437.
doi: 10.3389/fsufs.2022.826437
Temporal Temperature Variation in
Urban Gardens Is Mediated by Local
and Landscape Land Cover and Is
Linked to Environmental Justice
Alejandro Castillo Nolte1, Sascha Buchholz2,3, Nadja Pernat2and Monika Egerer1,4*
1Department of Life Science Systems, School of Life Sciences, Technical University of Munich, Freising, Germany, 2Institute
of Landscape Ecology, University of Münster, Münster, Germany, 3Berlin-Brandenburg Institute of Advanced Biodiversity
Research (BBIB), Berlin, Germany, 4Department of Ecology, Technische Universität Berlin, Berlin, Germany
The urban heat island (UHI) effect remains a major threat to society as cities densify
and sprawl. Urban greening through local to landscape management is a proposed
strategy to combat UHI and improve environmental justice in city neighborhoods. For
example, urban community gardens are multifunctional green spaces that play an
important role for biodiversity and for civic engagement. But the role of urban gardens in
urban cooling and relieving UHI remain unclear, specifically how temperatures fluctuate
within gardens in relation to garden management factors and city landscape context,
and how this relates to urban heat in city neighborhoods. We investigated diurnal
and nocturnal temperature ranges, and daily maximum and minimum temperatures
in 18 urban gardens over the peak of the summer agricultural growing season. We
then analyzed how temperatures were correlated to local land cover factors within
the garden, to surrounding landscape imperviousness at various spatial scales, and
to environmental justice indicators (stressors) of garden neighborhoods. We found that
nocturnal temperature range is negatively correlated to landscape imperviousness, and
that the relationship decreases in strength with increasing spatial scale. This result
supports the importance of evapotranspiration processes of surrounding green areas
for nocturnal cooling. Some local land cover factors were important for temperatures,
indicating heating or cooling management mechanisms from within urban gardens.
Finally, the mean number of environmental stressors in neighborhoods negatively related
to temperature variation. The results of this work can inform resource use and crop
selection in urban agriculture, as well as how temperature-related ecosystem services
of gardens relate to environmental justice of city neighborhoods.
Keywords: urban green infrastructure, urban agriculture, temperature variability, evapotranspiration, microclimate

Nolte et al. Temporal Temperature Variation in Gardens
INTRODUCTION
Rapid urbanization continues to pose challenges for urban
climate change mitigation, water supply sustainability, and public
health (UN-Habitat, 2017). For example, due to urban heat
island (UHI) effects, urban temperatures are often higher than in
rural surroundings, ranging inside urban areas from 0.5 to 4◦C
higher during the daytime, and 1 to 3◦C higher during the night
(Oke, 1973; Taha, 1997; Stewart, 2011). High temperatures may
reduce the thermal comfort of populations (Robine et al., 2008;
Mohajerani et al., 2017), and increase energy demand; indeed,
for each 1◦C increase in temperature, the energy demand in cities
increases by 2 to 4% (Akbari et al., 1997). As a counter measure
to such urban sustainability challenges, the FAO’s “Green Cities
Initiative” (2020) aimed to improve the urban environment by
increasing the availability of green spaces to improve mitigation
and adaptation strategies of cities to climate change, to reduce
UHI, and also to improve public health (FAO, 2020). Urban
greening may be an optimal and cost-effect strategy for urban
thermal regulation through evapotranspiration as a cooling
process to thereby reduce UHI (Lehmann, 2014; Litardo et al.,
2020).
There is a bi-directional relation between urban green and
urban climate. On the one hand, urban green space serves as
a UHI mitigation strategy due to evapotranspiration rates (Qiu
et al., 2013), on the other hand, temperature increases could
significantly affect plant survival and nutrient cycles, threatening
urban green space functioning and the ecosystem services they
could deliver. The higher complexity and biodiversity in a system
could make systems more resilient to temperature variation (Lin
et al., 2018), highlighting the importance of vegetatively diverse
urban greening. Temperature regulation by urban green is a
dynamic process and differs temporally and spatially according to
differences in land use composition at the local ecosystem scale to
the regional landscape scale. For example, during the night there
is a strong correlation between the land surface composition
and temperature variability with the fraction of built impervious
surface around urban green (Quanz et al., 2018).
An urban ecosystem where temperature variation and
land cover management may be relevant from an urban
cooling perspective and ecosystem service perspective are
urban gardens designed for food and flower production. As a
horticultural system, urban gardens can support urban cooling
and temperature mitigation through vegetation management;
this can work to alleviate UHI, while also alleviating food
insecurities for city residents (Lin and Egerer, 2020). For example,
nocturnal temperature variation in urban allotment gardens
can be lower in gardens closer to city center, suggesting that
impervious land cover acts as a heating factor (Rost et al., 2020).
Furthermore, local impervious cover within gardens can increase
local average garden temperatures by acting as a heating factor,
while grass cover can decrease average temperatures, acting
as a cooling factor; temperatures in turn influenced gardeners
water use management (Lin et al., 2018). Such work provides
preliminary insight into the role of urban gardens as a potential
cooling strategy and for urban ecosystem service provision. Yet
it is still necessary to understand how temperatures vary over
time and how this may be managed through land cover gradients
because temperatures can influence crop selection in urban
agriculture and subsequent food production.
Provision of ecosystem services through community gardens
may also mitigate effects of environmental injustice across the
urban landscape, such as access to green spaces in deprived
neighborhoods (Wolch et al., 2014). Environmental justice relates
to the equitable distribution and access to green spaces and
the services that they provide, from temperature regulation
to recreation. Here, gardens may provide cool temperatures
and shade to recreate and grow food in respective to their
surroundings, which may be especially important for those
without private green space and within especially built-up
neighborhoods where UHI is most extreme. Some studies show
that socio-economic factors of city neighborhoods affect the
distribution of community gardens across urban landscape
(Smith et al., 2013; Butterfield, 2020). However, few investigations
show how other environmental injustices, such as noise or
air pollution, relate to community garden locations and their
functions and services.
The goal of this study was to investigate temperature variation
across the day within urban community gardens and how this
may be influenced by land cover at the local to landscape scale,
and in addition, how temperature variation within gardens and
their distribution may relate to environmental justice factors
associated with garden neighborhoods. In 18 gardens in the
metropolitan region of Berlin, Germany, we asked: (1) How
do temperatures vary over time (diurnal vs. nocturnal time
periods) in gardens? (2) Is there an influence of variation in land
cover within and surrounding gardens at various spatial scales
on temperature variation over time? (3) Is there a relationship
between environmental justice factors of the neighborhoods in
which gardens are embedded and garden temperature variation
and distribution, respectively? The results of the study may
inform mechanisms behind urban temperature attenuation at
different spatial scales, inform urban food production in the
context of the urban climate, and inform how temperature
variation may relate to the socioeconomic conditions of
city neighborhoods.
MATERIALS AND METHODS
Area of Study
This research took place in 18 urban community gardens in
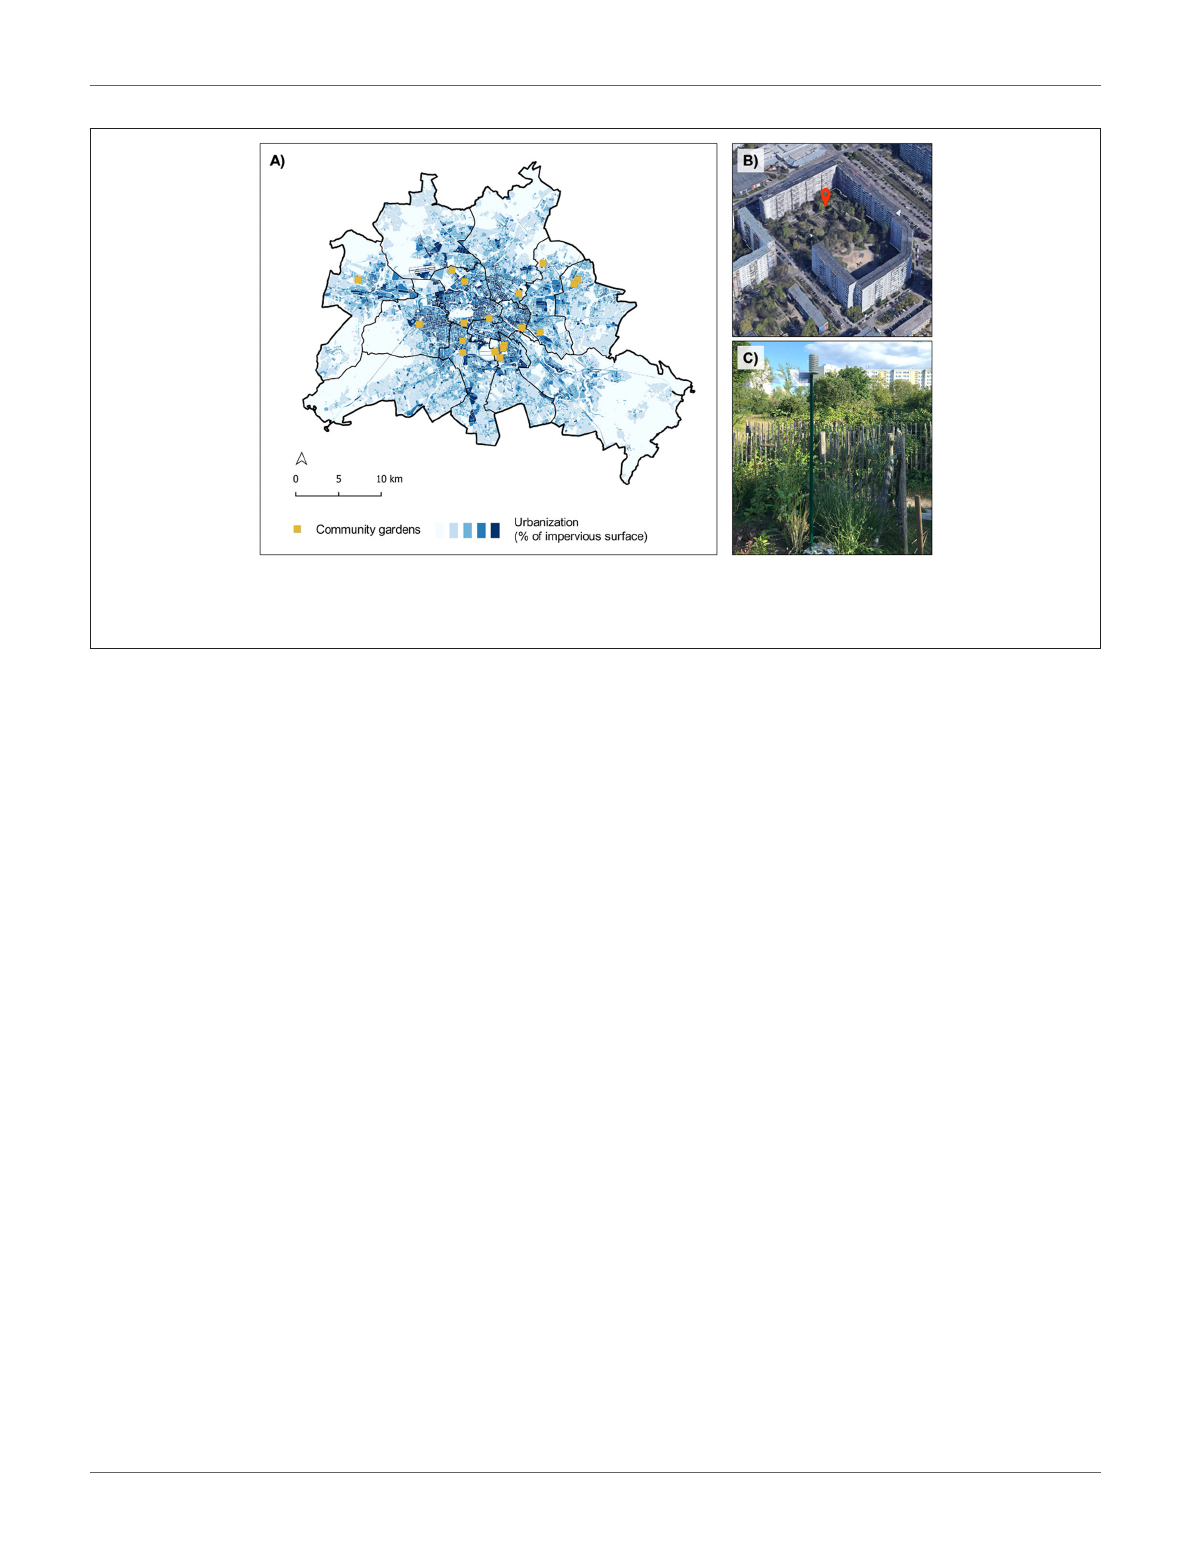
Berlin, Germany in June to July of 2020 (Supplementary Table 1;
Figures 1A,B). With 891.1 km2of total area and almost 3,670
million inhabitants as of 2019 (Das Amt für Statistik Berlin-
Brandenburg, 2019), Berlin is the biggest city in Germany
(Deutsche Welle, 2020). The climate is mainly influenced by
high latitude westerlies and has a Cfb climate classification
according to the Köppen-Geiger climate classification with warm
and humid summers (Kottek et al., 2006).
Temperature and Land Cover Data
Temperatures were recorded at 30-min intervals from weather
stations placed within each garden (Figure 1C). The stations
consisted of temperature sensor loggers (EasyLog EL-USB-2
Frontiers in Sustainable Food Systems | www.frontiersin.org 2April 2022 | Volume 6 | Article 826437
Nolte et al. Temporal Temperature Variation in Gardens
FIGURE 1 | Study system in the metropolitan region of Berlin, Germany where the 18 community gardens examined (yellow squares) and along an urbanization (%
impervious surface) gradient (A); an inset of a garden surrounded by residential housing structures [(B); Photo: Google Inc (2021)]. Photo of the temperature station in
a garden in Marzahn, Germany [(C); Photo: M Egerer].
Temperature and Relative Humidity USB Data Logger) placed
on 2-m metal poles above ground level following (von der Lippe
et al., 2020). The battery-operated sensors can measure >16,000
readings over a −35 to +80◦C and 0 to 100% humidity (RH)
range, and data can be downloaded using a PC’s USB port and
with the EasyLog software. Sensors were also protected by a
passively ventilated plastic shield to reduce sensor overheating
and potential damage from external factors (e.g., solar radiation,
wind, rain). The period of data collection used in this analysis
is between 01.06.2020 and 31.07.2020 for all sites, representing
an important period in agricultural production in Germany.
In some cases, battery life of the temperature loggers led to
short-term data gaps in the temperature data. The 18 gardens,
their period(s) of data recording and location are presented in
Supplementary Table 1.
Land cover within each garden was measured during two field
surveys in June and July 2020. In each survey, within a 20 ×20–
m plot at the center of each garden, we randomly placed eight
1×1-m quadrats across the plot within which to record the
percentage of bare soil cover, mulch cover, rock cover, grass cover,
herbaceous vegetation cover, and wood cover as our local garden
scale land cover variables. Logistical restraints led to missing
land cover data for four gardens in June 2020. We averaged
land cover data from these quadrats for each survey. Land cover
surrounding each garden (landscape scale) was measured at
three different radii from the garden center point with publicly
available data on the surrounding landscape features of each
garden from the Berlin Environmental Atlas (Senatsverwaltung
für Stadtentwicklung und Umwelt, 2016). Here we measured the
proportion of imperviousness at a 2 ×2-m resolution within 500-
m, 1-km and 2-km buffers using the Zonal statistics tool in QGIS
software v. 2.18.0 (QGIS Development Team, 2018).
Environmental Justice Data
To investigate relationships between garden locations,
temperature, and socioeconomic factors, we collected open
access environmental justice data from the Berlin Environmental
Atlas, Environmental Justice Berlin (Senatsverwaltung für
Stadtentwicklung und Umwelt, 2013). This spatial dataset
contains values of five environmental “stressors” that relate
to environmental justice: noise pollution, air pollution, green
space provision, bioclimatic stress, and social problems.
These stressors are defined for 447 structurally connected
neighborhoods (henceforth “blocks”) in Berlin. These variables
are categorical with either three or four categories from low to
high. A sixth variable adds the number of stressors, counting
only the highest or lowest category, respectively.
Data Analysis
We calculated the following variables for each garden: daily
average temperature, daily maximum temperature, daily
minimum temperature, and temperature range (TR =Tmax –
Tmin). To determine whether temperature variation varies over
time, we then calculated each of the five variables for diurnal
(05:00–20:59) and nocturnal (21:00–04.59) periods. We then
calculated monthly averages for each garden for the diurnal,
nocturnal and full-day periods (DTR =diurnal temperature
range; NTR =nocturnal temperature range), which also included
a monthly average TR.
We conducted a regression analysis to test for correlations
between the temperature variables and the five local land cover
variables at each time period and three landscape variables across
all sites. Although not the focus of the study, in our preliminary
analysis we also tested for relationships between land cover
variables and average daily temperatures. We performed the
Frontiers in Sustainable Food Systems | www.frontiersin.org 3April 2022 | Volume 6 | Article 826437

Nolte et al. Temporal Temperature Variation in Gardens
TABLE 1 | Summary temperature parameters for each garden study site.
Garten name Min night Max night NTR Max day DTR Avg daily Min night Max night NTR Max day DTR Avg daily
June July
Gartenarbeitsschule und Freilandlabor Tempelhof-Schöneberg 13.53 21.67 8.13 31.32 17.93 21.18 12.58 20.35 7.77 28.61 15.68 20.27
Gartenarbeitsschule Friedrichshain-Kreuzberg 14.50 21.42 6.92 29.50 15.08 21.30 14.21 19.61 5.40 28.71 14.11 20.86
Gemeinschaftsgarten am Brubacher Weg 13.98 21.42 7.43 28.15 14.35 20.28 13.71 20.84 7.13 26.31 12.50 19.50
Schalottengarten 15.02 21.78 6.77 28.60 13.92 20.35 14.24 20.27 6.03 27.73 13.44 19.78
Kiezgarten Fischerstraße 13.82 21.52 7.70 29.03 15.47 21.10 13.24 19.65 6.40 29.68 16.15 20.95
Himmelbeet 14.83 22.20 7.37 29.90 15.27 21.09 14.34 20.71 6.37 28.79 14.19 20.66
Inselgarten Schoeneberg 15.55 21.70 6.15 27.30 11.93 20.26 15.34 20.98 5.65 26.39 11.15 19.91
KlunkerGarten in der Horstwirtschaft e. V. 15.62 22.92 7.30 28.37 12.88 21.32 15.22 20.78 5.56 26.75 11.19 20.41
Peace of Land 13.22 20.72 7.50 30.95 17.75 21.64 12.85 19.24 6.39 29.54 16.17 20.65
Pflanz Was Vattenfall—Gemeinschaftsgarten Neue Grünstraße 18.55 23.03 4.64 29.02 10.40 22.68 15.10 20.34 5.24 29.76 14.53 21.09
prinzessinnengarten kollektiv berlin 14.28 20.98 6.70 27.73 13.80 20.12 13.50 19.39 5.89 28.10 14.45 19.72
Rote Beete 14.75 21.63 6.88 27.90 13.48 19.82 14.58 21.02 6.44 26.94 12.32 19.71
Spiel/Feld Marzahn 13.35 20.33 6.98 28.35 14.83 20.34 13.42 19.26 5.84 28.35 14.45 20.29
Allmende-Kontor 14.18 21.73 7.55 29.47 15.42 21.11 13.19 20.39 7.19 28.73 14.97 20.58
Vollguter Gemeinschaftsgarten 15.42 22.32 6.90 28.78 13.47 21.28 15.44 21.52 6.08 27.71 12.37 20.74
Gemeinschaftsgarten Wachsenlassen 15.12 21.45 6.33 30.30 15.38 21.03 16.21 20.79 4.57 26.57 10.07 20.47
Nachbarschaftsgarten Wiecker Straße 18.93 25.85 7.41 26.63 8.48 21.95 15.11 21.38 6.27 26.27 11.63 19.49
Garten der Begegnung NA NA NA NA NA NA 14.37 21.15 7.00 29.03 14.39 20.75
Values are the daily values averaged across the recording periods for each respective time period (June, July) (Min =minimum; Max =maximum; Avg =average; NTR =nocturnal temperature range; DTR =diurnal temperature range).
Frontiers in Sustainable Food Systems | www.frontiersin.org 4April 2022 | Volume 6 | Article 826437

Nolte et al. Temporal Temperature Variation in Gardens
analysis for all sites and all time periods to maximize sample sizes
in the analysis. We used Google Earth Pro to qualitatively assess
features around the gardens including water bodies and trees.
The associations between temperature and the average number
of environmental stressors in a 500 m buffer around the gardens
were tested with a linear regression model, applying NTR and
DTR as response variable and the average number of stressors as
predictor. The 500 m radius was set as the maximum catchment
area, both for residents but also for any impacts the garden may
have on environmental stressors. As the buffer overlaps at all
garden locations with more than one block, we calculated the
average of the number of stressors across all covered city blocks as
proxy. In addition, we used logistic regression to test whether the
odds of a garden present in a block is related to the number of or a
specific environmental stressor(s) in that block. Multicollinearity
was excluded by calculation the variation inflation factors (<2).
In addition, a Pearson correlation coefficient was computed to
assess the linear relationship between percentage of impervious
surface and mean number of environmental stressors of the
500 m buffer radius around the garden locations. All analysis
regarding the environmental stressors were conducted in R
version 4.1, applying packages rgdal (Bivand et al., 2018), sf
(Pebesma, 2018), rgeos (Bivand and Rundel, 2021), maptools
(Bivand and Lewin-Koh, 2022), raster (Hijmans, 2015), dplyr
(Wickham et al., 2022), car (Fox and Weisberg, 2019) and forcats
(Wickham, 2021).
RESULTS
Garden Temperatures
Temperatures varied across the gardens and over the season
(Table 1). The average monthly temperature recorded for June
varied between 19.8◦C and 24.6◦C across all gardens, with an
average of 21.2◦C. During July, average temperature among sites
were slightly lower than in June and varied from 19.5 and
21.1◦C, with an average of 20.3◦C. Diurnal temperatures were
on average 22.7◦C across gardens, and the average minimum
and maximum temperatures were 15.3 and 28.7◦C, respectively.
Nocturnal temperatures were on average 18.2◦C across sites
with an average minimum of 15.5◦C and average maximum
of 22.1◦C. Diurnal temperatures in July were on average
21.1◦C, with an average minimum and maximum of 14.5
and 28◦C in July, respectively. The lowest diurnal maximum
temperatures were recorded as 26.3◦C in July, whereas the
highest was recorded in June with 31.3◦C. The nocturnal
average temperature was 16.8◦C with a minimum average of
14.3◦C and a maximum average of 20.4◦C. The highest DTR
during June was 17.9 and 8.1◦C for NTR. Whereas the lowest
values were 8.5 and 4.6◦C for DTR and NTR, respectively.
In July, the smallest DTR and NTR were 10.1 and 4.6◦C,
respectively. Moreover, the highest DTR and NTR during July
were 16.2 and 7.8◦C. The maximum and minimum temperature
in June was recorded at 31.3 and 13◦C, respectively, while the
maximum and minimum temperatures during July were 29.8 and
12.3◦C, respectively.
Local and Landscape Land Cover
Local land cover varied across gardens. Herbaceous vegetation
cover ranged from 15 to 65%, whereas grass ranged from 0.4 to
46%. Bare soil cover ranged from 3 to 62%, mulch cover from 0 to
24%, whereas rock cover varied from 0 to 72%. Within the 500-
meter radius, the landscape imperviousness across all stations
varied from 31 to 86%, with an average of 60%. Within the 1,000-
m radius, imperviousness ranged from 34 to 73%, with an average
of 57%. Finally, within the 2,000 m radius, imperviousness ranged
from 35 to 73%, with an average of 56%.
Relationships Between Temperature
Variation and Land Cover
Land cover significantly predicted temperature variations across
the gardens (Tables 2,3). The higher percentage of landscape
imperviousness within 500 m of the gardens, the lower the
DTR (p<0.05, Figure 2A). For local land cover, the higher
the grass cover, the higher the DTR (p=0.004), whereas
the higher the rock cover the lower the DTR (p=0.045).
Diurnal maximum temperature was negatively correlated with
rock cover (p=0.04) and mulch was positively correlated
(p=0.02). Across all spatial scales, the higher the landscape
imperviousness, the lower the NTR (Table 3;Figure 2B). The
correlation significance and relationship strength decreased with
larger spatial scale; the highest regression coefficient was at 2,000-
m, with a coefficient of −0.038, compared to −0.031 and −0.029
for 1,000-m and 500-m. Minimum nocturnal temperatures were
significantly correlated with landscape imperviousness at 500 m
(p<0.05; other spatial scales not significant), where minimum
temperatures were higher with higher landscape imperviousness.
At the local scale, grass cover negatively correlated with nocturnal
minimum temperatures (p=0.008).
For supporting information, average temperatures did not
vary with landscape imperviousness at any spatial scale, and only
mulch cover was positively correlated wth average temperatures
did not vary with landscape imperviousness at any spatial scale,
and only mulch cover was positively correlated with average
temperatures (Table 2).
Relationships Between Environmental
Stressors, Temperature Variation and
Garden Locations
Environmental stressors significantly negatively associated with
both DTR and NTR, and positively associated with landscape
imperviousness. The higher the number of environmental
stressors within a 500 m radius around the garden locations,
the higher the landscape imperviousness (rpearson =0.740, p
<0.0004) and the lower the temperature ranges (Table 4). To
test whether this result suggests that the presence of community
gardens is related to the level of environmental justice of a block,
we ran a logistic regression with the presence of a garden in a
block as the response and environmental stressors as predictors.
No significant relationship was found for the summed numbers
of stressors. However, for single environmental stressors, we
found significant negative correlations between green space
provision and bioclimatic stress and garden location. Specifically,
Frontiers in Sustainable Food Systems | www.frontiersin.org 5April 2022 | Volume 6 | Article 826437
Loading more pages...