
10318 Phys. Chem. Chem. Phys., 2011, 13, 10318–10325 This journal is cthe Owner Societies 2011
Cite this:
Phys. Chem. Chem. Phys
., 2011, 13, 10318–10325
Effect of ionic strength and type of ions on the structure of water swollen
polyelectrolyte multilayerswz
S. Dodoo,
a
R. Steitz,
b
A. Laschewsky
c
and R. von Klitzing*
a
Received 28th July 2010, Accepted 31st March 2011
DOI: 10.1039/c0cp01357a
This study addresses the effect of ionic strength and type of ions on the structure and water
content of polyelectrolyte multilayers. Polyelectrolyte multilayers of poly(sodium-4-styrene
sulfonate) (PSS) and poly(diallyl dimethyl ammonium chloride) (PDADMAC) prepared at
different NaF, NaCl and NaBr concentrations have been investigated by neutron reflectometry
against vacuum, H
2
O and D
2
O. Both thickness and water content of the multilayers increase with
increasing ionic strength and increasing ion size. Two types of water were identified, ‘‘void water’’
which fills the voids of the multilayers and does not contribute to swelling but to a change in
scattering length density and ‘‘swelling water’’ which directly contributes to swelling of the
multilayers. The amount of void water decreases with increasing salt concentration and anion
radius while the amount of swelling water increases with salt concentration and anion radius. This
is interpreted as a denser structure in the dry state and larger ability to swell in water (sponge) for
multilayers prepared from high ionic strengths and/or salt solution of large anions. No exchange
of hydration water or replacement of H by D was detected even after eight hours incubation time
in water of opposing isotopic composition.
Introduction
Thin polymer films are widely used for modification and
functionalization of surfaces. The adsorption from solution
is a particularly refined technology for modifying surfaces
for advanced applications. It is well documented that the
physisorption or chemisorption of polyelectrolytes or reactive
polymers onto surface-functionalized substrates can lead to
the deposition of molecularly thin surface films.
1–6
Reflectivity techniques, especially neutron and X-ray reflecto-
metry, are well suited for the characterization of multilayer
films, as they allow the determination of the concentration
gradient along the layer normal. X-Ray reflectometry has
only exhibited Kiessig fringes that arise from the interference
of X-ray beams reflected at the substrate–film and film–air
interfaces.
7–9
Neutron reflectivity measurements of polymer
films of a superlattice structure showed that the polyelectrolytes
are deposited as layers with an interdigitation smaller or equal
to a single layer thickness and indicate that there is no distinct
layer-by-layer separation between polyelectrolytes of opposite
charges.
10–12
The main driving force of film assembly is entropy
due to release of counterions. Measurements of the surface
potential resulted in a change of (surface) potential after each
adsorption step, i.e. after each additional single deposited
polyelectrolyte layer.
13–16
For alternating layers of poly(styrene sulfonate), PSS, and
poly(diallyl dimethyl ammonium chloride), PDADMAC,
adsorbed onto smooth surfaces, a roughening of successively
deposited layers leads to a progressively larger number of
adsorption sites for consecutive generations of adsorbed polymers,
and thus to an increase in layer thicknes with increasing
number of deposited layers. The thickness of the deposited
layer may be fine-tuned via the ionic strength of the solutions
used for preparation.
17
The difference in film thickness is explained by different
conformations of the chains: without salt the polyelectrolyte
chains are oriented flat and parallel to the substrate, with
higher salt concentrations of the aqueous solutions the chains
form coils
18,19
which are then adsorbed at the interface.
Because of screening of charges along the polyelectrolyte
chains the polymer is more entangled with larger thickness.
TIRF (Total Internal Reflection Fluorescence) kinetic experi-
ments, where the fluorescence of a fluorescein labeled poly-
electrolyte is measured, indicate an increasing amount of
a
Technische Universita
¨t Berlin, Stranski-Laboratorium, Department
of Chemistry, TU Berlin, Strasse des 17. Juni 124, D-10623 Berlin,
Fax: +49 (0)30 31426602; Tel: +49 (0)30 31423931
b
Helmholtz-Zentrum Berlin fu
¨r Materialien und Energie GmbH,
Hahn-Meitner-Platz 1, D-14109 Berlin, Germany
c
Institut fu
¨r Chemie, Universita
¨t Potsdam, Karl-Liebknecht-Str. 24-25,
D-14476 Potsdam-Golm, Germany
wElectronic supplementary information (ESI) available: See DOI:
10.1039/c0cp01357a
zThis article was submitted as part of a Themed Issue on Scattering
Methods Applied to Soft Matter. Other papers on this topic can be
found in issue 8 of vol. 13 (2011). This issue can be found from the
PCCP homepage [http://www.rsc.org/pccp]
PCCP Dynamic Article Links
www.rsc.org/pccp PAPER
Published on 26 April 2011. Downloaded by TU Berlin - Universitaetsbibl on 01/04/2016 08:41:26.
View Article Online
/ Journal Homepage
/ Table of Contents for this issue

This journal is cthe Owner Societies 2011 Phys. Chem. Chem. Phys., 2011, 13, 10318–10325 10319
adsorbate with increasing salt concentration. Measurements
of the rhodamine transport through the polyelectrolyte
multilayer reveal a higher diffusion coefficient of rhodamine
for multilayers prepared without salt. These findings lead to
the conclusion that the polyelectrolyte density of multilayers
prepared without salt is lower than the polyelectrolyte density
of multilayers prepared with salt additive.
20
The type of
salt
21–24
used in the multilayer preparation influences the
thickness of the multilayer according to the Hofmeister effect.
Due to the high solubility of polyelectrolytes in water
polyelectrolyte multilayers are very sensitive to the water
content of the environment. This is of interest since poly-
electrolyte multilayers are often used as cushions or junctions
between different materials. Further, they present building
blocks for novel stimuli responsive materials. Therefore, it is
necessary to conduct structural investigations for clarifying their
internal structure. Swelling behaviour of polyelectrolyte multi-
layers has been investigated in recent times by ellipsometry,
X-ray and neutron reflectometry. Wong et al.
25
observed an
‘‘odd–even effect’’ which shows outer-layer dependence for a
poly(sodium-4-styrene sulfonate) (PSS)/poly(allylamine hydro-
chloride) (PAH) multilayer in ellipsometric swelling experiments
in 99% relative humidity. Ellipsometrically determined swelling
percentages of PSS/PDADMAC multilayers prepared in 0.5 M
NaCl show that water uptake can vary depending on whether
the capping layer is a polycation or a polyanion.
26
Steitz et al.
27
reported that PSS/PAH systems swell as much as 56% in the
outer layer and 42% in the inner part by neutron reflectometry,
where two boxes of different scattering length densities were
needed to fit the reflectometry curves. PSS/PAH bilayers studied
by X-ray and neutron reflectometry as a function of the type of
salt shows that the PSS/PAH bilayer thickness is independent of
the kind of salt (NaCl or KCl), yet its composition is different
(more bound water for NaCl).
28
Especially in biologically relevant systems like in the presence
of proteins, specific ion effects become important. So far, a
detailed study on specific anion effects on the water content and
the inner structure of polyelectrolyte multilayers is missing. The
problem in many studies is that the water content calculated by
changes in scattering length density differs from the one calcu-
lated by the swelling ratio of multilayer thickness. Here we
report on the structural investigation of PSS/PDADMAC
multilayers by neutron reflectivity. In order to determine the
effect of type of salt and ionic strength on the water content and
swelling behaviour of PSS/PDADMAC multilayers, neutron
reflectometry experiments were conducted at the solid–liquid
and solid–vacuum interfaces.
Experimental section
Materials and multilayer preparation
Linear PDADMAC was synthesized by free-radical polymeri-
zation of positively charged diallyldimethylammonium chloride
(DADMAC) monomers. Details about the synthesis and the
characterization are described elsewhere.
29,30
The molecular
weight of the fully charged PDADMAC is 135 000 g mol
1
and a polydispersity index (PDI) of 1.75. Poly(sodium-4-styrene
sulfonate) (PSS) and branched poly(ethylene imine) (PEI) were
obtained from Aldrich (Steinheim, Germany). The molecular
weight of PEI is 750 000 g mol
1
and 70 000 g mol
1
in the case
of PSS. PEI and PSS were used as purchased. NaF, NaCl, and
NaBr were purchased from Merck. Silicon blocks were supplied
by Silizium Bearbeitung A. Holm, Tann, Germany, and cleaned
for 30 min in piranha solution (H
2
O
2
:H
2
SO
4
;1:1).
The polyelectrolyte multilayers were deposited on the silicon
blocks by immersion for 20 min into aqueous solutions containing
10
2
mono mol l
1
(concentration of monomer units) of the
respective polyelectrolytes in H
2
O and by rinsing three times
with Milli-Q-water for 1 min after each deposition step. First,
the wafer was immersed in aqueous solution of PEI for 30 min
and then rinsed gently in pure water. This extra step was found
to be efficient in the reduction of substrate influence on the
adsorption of the next polyelectrolyte layers.
31
After that
PSS and PDADMAC were deposited consecutively via the
self-assembly technique. The multilayers were dried in a gentle
stream of nitrogen for 3 min after completion of the multilayer
assembly. The polyelectrolyte multilayers fabricated were Si/
PEI/(PSS/PDADMAC100%)
6
at different NaF, NaCl and
NaBr concentrations.
Apparatus and measurement procedure
The homemade sample cell for neutron reflectivity studies of
solid/liquid interfaces represents a modified version of the design
by Satija and co-workers.
32
It consists of a poly(tetrafluoro-
ethylene) trough of inner dimensions with (72 42 3) mm
3
stainless steel inlet and outlet tubes for the fluid mounted in
opposite corners of the trough. It was sealed with a Viton O-ring
against the silicon block. A more detailed description of the
sample cell is given elsewhere.
33
All measurements were con-
ducted at room temperature. Neutron reflectivity measurements
were performed at the V6 instrument at the HZB Berlin. A
detailed description of the instrument can be found in the
literature.
34
A neutron wavelength = 4.66 A
˚was selected by
a graphite monochromator in the incident white beam. The
resolution was set by a slit system on the incident side to DQ=
0.001 A
˚
1
for Qr0.0518 A
˚
1
,andDQ= 0.002 A
˚
1
otherwise.
A beam of rectangular cross section 0.5 40 mm
2
for Qr
0.0518 A
˚
1
and 1 40 mm
2
for Q40.0518 A
˚
1
impinged on
the samples at the solid/vacuum interface through vacuum and
at the solid/liquid interface through the silicon block.
The scattered neutrons were recorded with a
3
He-detector in
single y/2ysteps with a complete run from 0.0047 to 0.1646 A
˚
1
taking typically 6–9 h. Every run was repeated in the low
Q-range to check for changes in the structure during this time.
The off-specular signal was collected simultaneously in a
3
He
counter offset from the specular position by 0.441toward
larger angle 2y. The extinction coefficient of the silicon blocks
was found to be k= 0.0038 mm
1
for the monochromatic
neutrons used in this work. In the neutron reflectivity experi-
ment at the V6 instrument, the background to the measured
intensity was determined to be (1.5 0.5) 10
5
for measure-
ments against both liquid phases and (8 1) 10
6
for
measurements against vacuum. The intensity was normalized
on the measured incident intensity I
0
to obtain the reflectivity
R(Q) of the interface. The centerpiece of the experimental
setup is shown elsewhere.
27
A complete measurement cycle
Published on 26 April 2011. Downloaded by TU Berlin - Universitaetsbibl on 01/04/2016 08:41:26.
View Article Online
10320 Phys. Chem. Chem. Phys., 2011, 13, 10318–10325 This journal is cthe Owner Societies 2011
consisted of four steps: recording neutron reflectivity from
the multilayer (1) against vacuum (pressure: from (0.2–2.7)
10
2
mbar) after preparation i.e. after exposure to H
2
O(H
2
O
vac), (2) against H
2
O(H
2
O liq), (3) against D
2
O(D
2
O liq) and
(4) against vacuum after exposure to D
2
O(D
2
O vac).
Fitting procedure
The neutron reflectivity data were fitted with Parratt’s dynamic
approach
35
using the Parratt32 fitting software (provided by
HZB). Since all the fabricated multilayers are assumed to have
a homogeneous density a so-called one-box model was used to
fit the experimental data. Thereby, the multilayer is described
by a certain thickness, scattering length density (SLD) and
roughness towards the outer medium (vacuum or water). A
SiO
2
layer with thickness between 5 and 25 A
˚and with SLD of
3.475 10
6
A
˚
2
representing the native oxide layer was
established between the Si substrate and PEM. The roughness
of the SiO
2
-interlayer towards silicon and towards the polymer
multilayer was kept at zero. The SLD for Si was fixed at
2.073 10
6
A
˚
2
throughout the fitting. First, the H
2
O vac
data were fitted. Then, the best fit for the SiO
2
thickness was
kept fixed for a particular substrate for all other conditions,
i.e. H
2
O liq, D
2
O liq and D
2
O vac. This fitting procedure was
applied to all the polyelectrolyte multilayers except for the
multilayer prepared from 0.25 M NaCl. In this case, the SiO
2
layer went to thickness values smaller than 5 A
˚, which is
physically senseless. For the very reason the SiO
2
layer was
omitted from the model and replaced by a roughness term
instead. All previously fitted samples were cross-checked with
this second fitting approach and no significant differences were
observed in the derived parameters.
Results
Hydration water in a dry polyelectrolyte multilayer
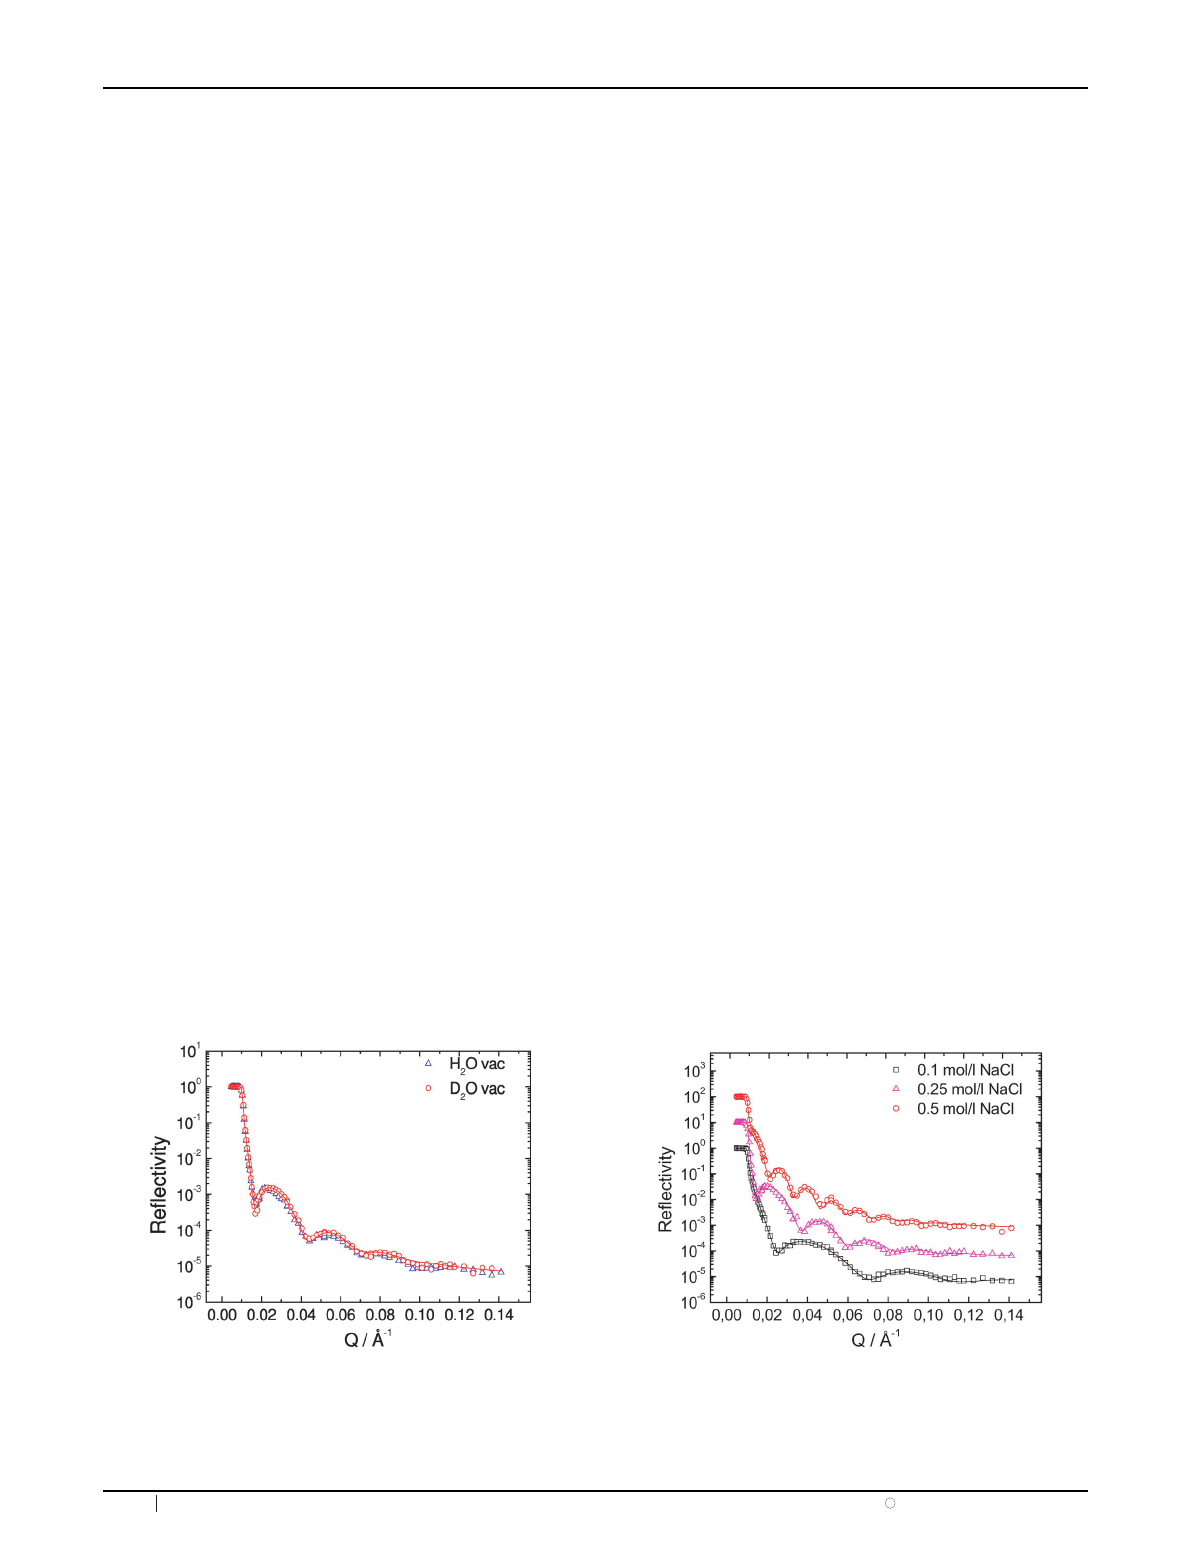
Fig. 1 shows the raw neutron reflectivity data (symbols) of PSS/
PDADMAC sample and the best fit (solid line). The spectra
contain Kiessig oscillations but no Bragg peaks suggesting that
there is no pronounced density variation within the repeat units
of the multilayer.
The sample (PSS/PDADMAC)
6
prepared from aqueous
solution of 0.1 M NaBr was measured against vacuum. The
Kiessig oscillations of the multilayer against H
2
O vac and D
2
O
vac coincide i.e., the oscillation amplitudes and the minima
positions are the same, which means equal thickness, SLD and
roughness of the multilayer. The best fit of the experimental
data results in a thickness of 229 5A
˚, SLD of (1.04 0.02)
10
6
A
˚
2
and roughness of 23 4A
˚for both conditions.
Throughout the experiment there is no difference between
H
2
O vac and D
2
O vac which is consistent with all samples
irrespective of their preparation parameters. This can be
attributed to either no hydration water or strongly bound
hydration water where the displacement of H
2
ObyD
2
O
molecules is suppressed. An isotopic exchange of H by D
atoms in the polyelectrolytes can be excluded since both PSS
and PDADMAC do not possess any displaceable acidic
protons. In case of an exchange of hydration water in the
dry multilayer, it is to be expected that the SLD obtained from
the measurement against vacuum after exposure to H
2
Oor
D
2
O is different. The interpretation that no hydration water is
exchanged in the course of varied environmental conditions is
in agreement with the report of Ivanova et al.,
36
who stated
that most of the H
2
O molecules found in polyelectrolyte
multilayers at 0% relative humidity remain bound at 100%
relative humidity D
2
O.
Effect of ionic strength
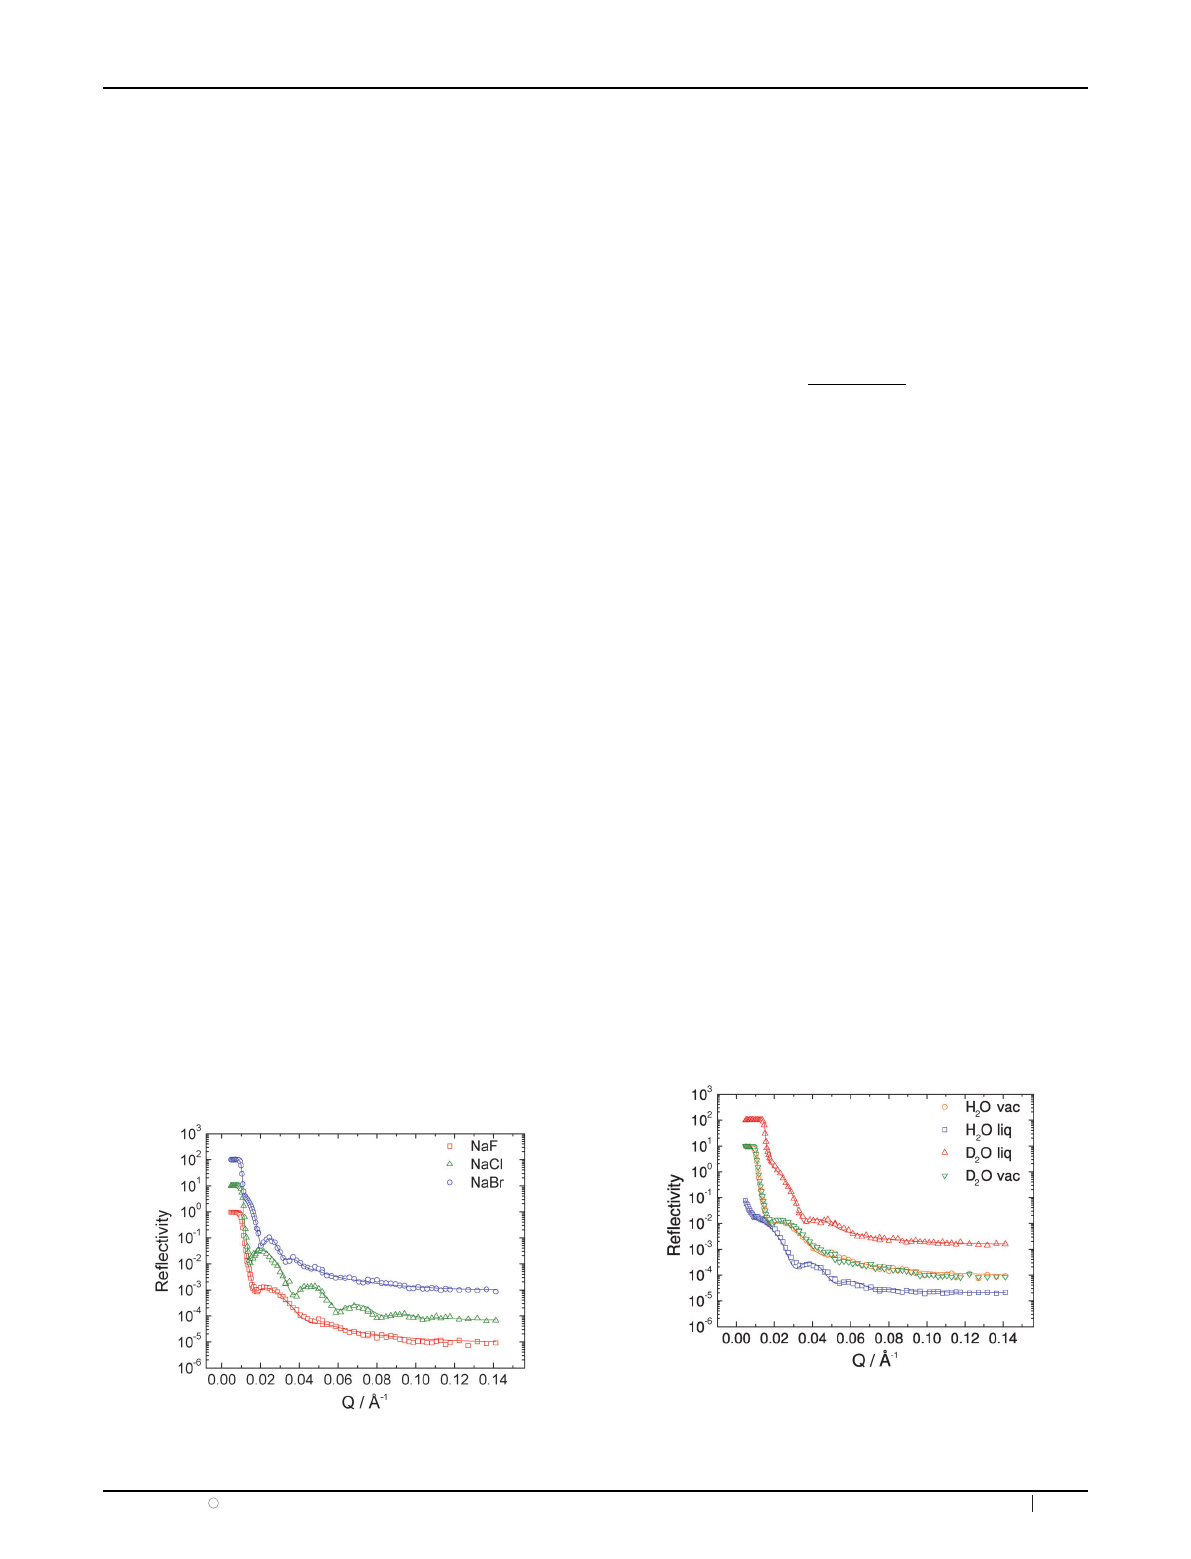
Fig. 2 shows three different spectra of (PSS/PDADMAC)
6
prepared in aqueous NaCl solutions of various ionic strengths
and against vacuum after exposure to H
2
O. Upon adsorption
of polyelectrolytes from solution of higher ionic strength the
minima positions of the Kiessig fringes in the spectra shift
towards low Qand the distance, DQ, between adjacent minima
shrinks. The thicknesses derived from the fits for 0.1 M,
0.25 M and 0.5 M are 144 1A
˚, 267 6A
˚, and 481 3A
˚,
respectively. The smearing out of the oscillations at high Qis
due to the roughness of the samples. The roughness obtained
Fig. 1 Neutron reflectivity against vacuum of (PSS/PDADMAC)
6
prepared in 0.1 M NaBr aqueous solution and measured against
vacuum after exposure to H
2
O and D
2
O, respectively. The data points
are supplemented with a continuous line representing the best fit
model as described in the fitting procedure.
Fig. 2 Neutron reflectivity against vacuum after preparation (H
2
O
vac) showing the effect of ionic strength on multilayer thickness of
(PSS/PDADMAC)
6
prepared from 0.1 M, 0.25 M and 0.5 M NaCl
concentrations. The spectra of 0.25 M and 0.5 M have been multiplied
by 10 and 100, respectively, for clarity.
Published on 26 April 2011. Downloaded by TU Berlin - Universitaetsbibl on 01/04/2016 08:41:26.
View Article Online
This journal is cthe Owner Societies 2011 Phys. Chem. Chem. Phys., 2011, 13, 10318–10325 10321
for different ionic strengths is 10 4A
˚,114A
˚,and225A
˚
in order of increasing ionic strength. Hence, both multilayer
thickness and roughness increase with increasing ionic
strength.
37,38
Addition of salt to the polyelectrolyte solution
during multilayer preparation introduces counterions which
also contribute to complex formation.
39–41
By adsorbing
polyelectrolyte from salt solutions of varying ionic strength,
the layer thickness can be controlled over a wide range.
Screening of the polyelectrolyte charges in a strong electrolyte
solution leads to a smaller radius of gyration. Thus, adsorption
of coils will take place, which occupy a lower surface area per
chain, leading to a larger adsorbed amount of segments and
consequently to a larger layer thickness.
18,42
The pronounced
difference in roughness between 0.25 M and 0.5 M is attributed
to strong interdigitation of more coiled chains caused by higher
ionic strength. The scattering length density does not show any
systematic change with an increasing ionic strength.
Effect of the type of ion
The type of salt used during the multilayer preparation can
affect the growth of the multilayer strongly.
43,44
In order to
investigate this effect (PSS/PDADMAC)
6
was prepared from
NaF, NaCl and NaBr solutions at a fixed ionic strength of
0.25 M. Different anions are chosen since anions are known to
have a significantly larger effect on the thickness of the multi-
layers than their cation counterparts.
45
Ion-specific effects
become more important for cations above an ionic strength of
0.25 M at which stage the influence is not negligible. The results
of the neutron reflectivity measurements are shown in Fig. 3. At
first sight, the distance, DQ, between adjacent minima shrinks as
the size of the anion of the respective salt increases. The position
of the first minimum shifts towards low Qvalues. From the fits
the thickness obtained is 218 3A
˚,2676A
˚and 498 4A
˚
for NaF, NaCl and NaBr, respectively. This shows an increase
in the thickness of the multilayer as the size of the anion gets
larger. The roughness obtained is 25 5A
˚,114A
˚and 50 8A
˚
for NaF, NaCl and NaBr, respectively. The roughness is
expected to show a pattern similar to that of thickness, however,
NaF is seen to produce exceptionally rougher multilayers. That
explains why there is only one Kiessig oscillation and strong
damping of Rat high Qvalues. The effect of the anion on
thickness and of the polyelectrolyte multilayers is due to its
respective position in the Hofmeister Series
46
and coincides with
results of other studies on polyelectrolyte multilayers.
23,24,40,45
Quantitative analysis of water content
A complete set of measurements as shown in Fig. 4, i.e.,H
2
O
vac, H
2
Oliq,D
2
OliqandD
2
O vac, was performed for all
(PSS/PDADMAC)
6
multilayers which were prepared with
different concentrations of NaF, NaCl and NaBr. In the
following the quantitative analysis of the water content is
described. The percentage of swelling in water is determined by:
fswell ¼dswollen ddry
dswollen
100 ð1Þ
where f
swell
is the percentage of swelling, d
swollen
is the thickness
in the water swollen state and d
dry
is the thickness of the
multilayer against vacuum. For example, the percentage of
swelling in water of (PSS/PDADMAC)
6
prepared from
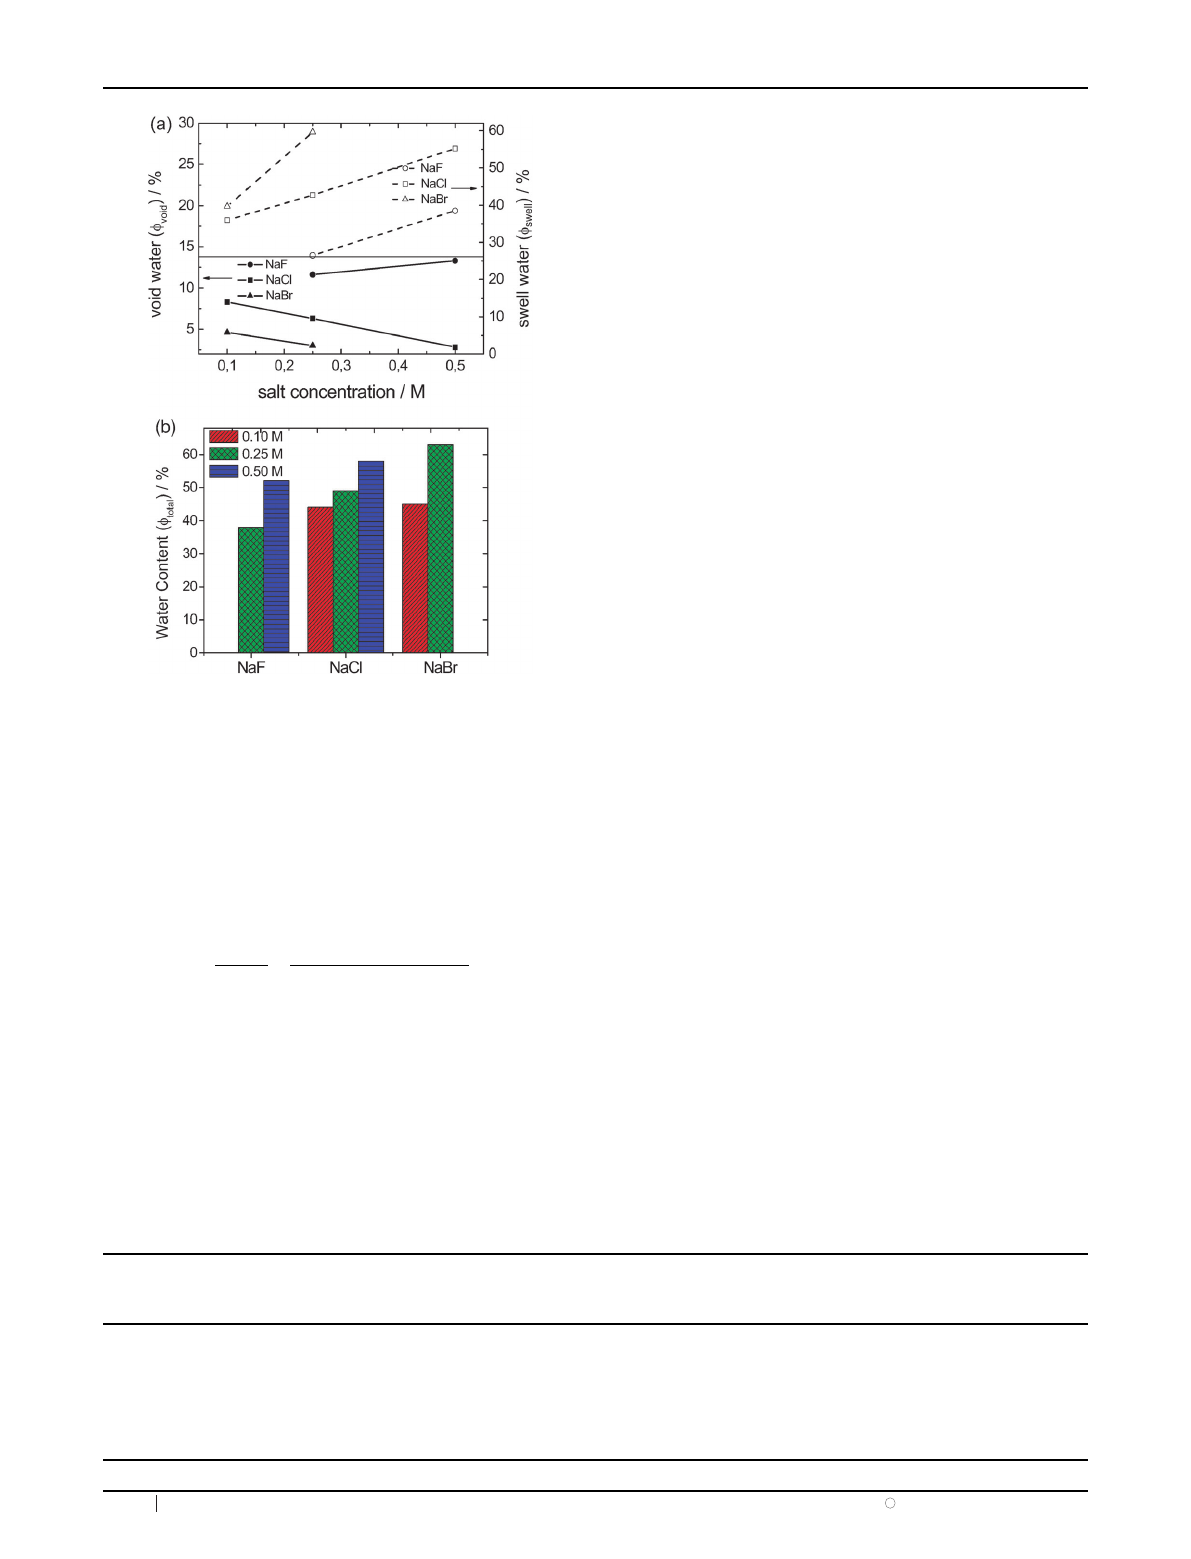
aqueous solution of 0.1 M, 0.25 M and 0.5 M NaCl are 36%,
43% and 55%, respectively (see Fig. 5a). In many former
studies the percentage of swelling was equated with the amount
of water within the polyelectrolyte multilayer. However, it
differs from the amount of water calculated by the concurrent
change in the scattering length density of the multilayers. This
leads to the conclusion that some hidden water exists which
does not contribute to swelling in water but to the change in
scattering length density only.
‘‘Swelling’’ and ‘‘void water’’. Polyelectrolyte multilayers are
deposited as layers that form continuous molecular layers
without distinct layer-by-layer separation between poly-
electrolytes of opposite charges,
10–12
which in turn creates
voids in the multilayer. In vacuum those voids within the
multilayer are empty and the multilayer thickness is termed
d
dry
. Upon swelling the voids are filled with water called ‘‘void
water’’. That water does not contribute to the swelling of the
multilayers but exclusively to the change in scattering length
density. Subsequent water absorbed by the multilayer, called
‘‘swelling water’’ on the opposite directly contributes to the
swelling of the multilayer. The amount of ‘‘void water’’ f
void
,
was retrieved from comparison of the amount of ‘‘swelling
water’’, f
swell
, calculated from eqn (1), with the total water
Fig. 3 Neutron reflectivity spectra of (PSS/PDADMAC)
6
containing
0.25 M concentration of NaF, NaCl and NaBr against H
2
O vacuum.
Fig. 4 Neutron reflectivity spectra of (PSS/PDADMAC)
6
multilayers
prepared from 0.25 M NaF, showing the order of measurements. The
reflectivities of the curves H
2
O vac, D
2
O vac and D
2
O liq have been
multiplied by 10, 10 and 100, respectively.
Published on 26 April 2011. Downloaded by TU Berlin - Universitaetsbibl on 01/04/2016 08:41:26.
View Article Online
10322 Phys. Chem. Chem. Phys., 2011, 13, 10318–10325 This journal is cthe Owner Societies 2011
content, f
total
, calculated from the respective changes in the
scattering length density and appropriate boundary conditions
(see eqn (2)):
f
total
=(1x)(1 f
swell
)+f
swell
=f
void
+f
swell
(2)
where x, the volume fraction of polymer, is given by
x¼Nbdry
Nbwater
Nbswollen fswellNbwater
ð1fswellÞNbwater
þ1ð3Þ
Nb
dry
is the SLD of dry multilayer, Nb
swollen
is the SLD of the
swollen multilayer and Nb
water
is the SLD of the water, D
2
Oor
H
2
O. Hence, the total water content f
total
of a swollen multi-
layer is the sum of the ‘‘void water’’ f
void
and ‘‘swelling water’’
f
swell
. The summary of the results for the amount of ‘‘void
water’’ f
void
, ‘‘swelling water’’ f
swell
and total water f
total
is
represented in Fig. 5. There is no significant difference in the
water content for H
2
O and D
2
O in the multilayer. Therefore,
the values presented in Fig. 5 are the average water content
in the multilayers. We conclude that there is no isotopic effect in
the thickness of the swollen multilayers as well as in the water
content as can be seen from Table 1 and the ESIw, respectively.
For each type of salt 3 different concentrations were used,
i.e., 0.1 M, 0.25 M and 0.5 M. The results for 0.1 M NaF could
not be provided because the multilayer was too thin to
produce any oscillations and for 0.5 M NaBr the multilayer
was unstable. With increasing ionic strength and increasing
ion size the amount of total water and swelling water increases.
The amount of void water shows an opposite effect: it
decreases with increasing ionic strength (exception for NaF).
This means that the two water species (swelling and void
water) partially compensate each other. In case of 0.1 M the
ion type has no effect on the total amount of water but on the
amount of void and swelling water. Obviously, the increasing
ion size has qualitatively the same effect as increasing the ionic
strength.
Discussion
The main findings can be summarized as follows: (i) there is no
displacement of hydration water in the dry polyelectrolyte
multilayers and there is no replacement of H by D. (ii) The
thickness of the polyelectrolyte multilayers increases with
increasing ionic strength of the polyelectrolyte solution. (iii)
The thickness of the multilayers increases in accordance with
the arrangement of the anions in the Hofmeister Series. (iv)
The total water content of the polyelectrolyte multilayers
increases with increasing ionic strength and also the type of
ion. In order to qualitatively explain these findings, we will
discuss the hydrophobic effect and the Hofmeister effect on
polyelectrolyte multilayers.
Hydration water in polyelectrolyte multilayers
The generally accepted model of hydration
47
invokes a cage
of water molecules around a nonpolar solute molecule or
molecular part, i.e. polymer backbone. Hydrogen bonds are
preserved by partial ordering of water (a decrease in entropy),
and contact with the solute can generate favorable, though
small, enthalpies of dissolution. Hydrophobic interactions are
generated when multiple nonpolar solutes, or fragments of
molecules, associate to maximize contact of water with water,
maintaining the structure and hydrogen bonds. Polyelectrolyte
multilayers prepared by alternating adsorption of polyanions
and polycations from aqueous solution are assumed to contain
Fig. 5 (a) Amount of void water and swelling water in dependence of
the salt concentration and type of ion of the preparation solutions. (b)
Total amount of water in dependence of the salt concentration and
type of ion of the preparation solutions.
Table 1 The structure of (PSS/PDADMAC)
6
multilayer prepared from aqueous polyelectrolyte solution of NaF, NaCl and NaBr. Data set H
2
O
vac and D
2
O vac are the same. Error bars are set in accordance to a level of 10% increase in w
2
Concentration of
salt
d(H
2
O) d
dry
(A
˚)
d(H
2
O) d
swollen
(A
˚)
d(D
2
O) d
swollen
(A
˚)
s(H
2
O) s
dry
(A
˚)
s(H
2
O) s
swollen
(A
˚)
SLD(H
2
O)
r
dry
(10
6
A
˚
2
)
SLD(H
2
O)
r
swollen
(10
6
A
˚
2
)
SLD(D
2
O)
r
swollen
(10
6
A
˚
2
)
0.25 M NaF 218 3 295 5 295 6255406 0.95 0.02 0.53 0.03 3.48 0.3
0.5 M NaF 300 5 486 8 495 10 34 6555 1.20 0.03 0.45 0.02 4.04 0.2
0.1 M NaCl 144 1 226 3 226 2104274 1.33 0.02 0.58 0.01 3.47 0.1
0.25 M NaCl 267 6 465 9 480 15 11 43513 1.34 0.03 0.49 0.02 4.00 0.2
0.5 M NaCl 481 3 1041 18 1110 30 22 54819 0.74 0.04 0.23 0.07 4.11 0.1
0.1 M NaBr 229 5 395 6 381 9234369 1.04 0.02 0.34 0.05 3.45 0.2
0.25 M NaBr 498 4 1282 20 1200 40 50 8 123 9 1.05 0.02 0.05 0.01 4.36 0.1
Published on 26 April 2011. Downloaded by TU Berlin - Universitaetsbibl on 01/04/2016 08:41:26.
View Article Online
Loading more pages...