
Benjamin M. Nitsche, Jonathan Crabtree, Gustavo C. Cerqueira, Vera Meyer,
Arthur F.J. Ram, Jennifer R. Wortman
New resources for functional analysis of
omics data for the genus Aspergillus
Article, Published version
This version is available at http://nbn-resolving.de/urn:nbn:de:kobv:83-opus4-70178.
Suggested Citation
Nitsche, Benjamin M. ; Crabtree, Jonathan ; Cerqueira, Gustavo C. ; Meyer, Vera ; Ram, Arthur F.J. ;
Wortman, Jennifer R. : New resources for functional analysis of omics data for the genus Aspergillus. -
In: BMC Genomics. - ISSN 1471-2164 (online). - 12 (2011), art. 486. - doi:10.1186/1471-2164-12-486.
Terms of Use
This work is licensed under a CC BY 2.0 License (Creative
Commons Attribution 2.0 Generic). For more information see
http://creativecommons.org/licenses/by/2.0.
Powered by TCPDF (www.tcpdf.org)

RESEARCH ARTICLE Open Access
New resources for functional analysis of omics
data for the genus Aspergillus
Benjamin M Nitsche
1*
, Jonathan Crabtree
2
, Gustavo C Cerqueira
3
, Vera Meyer
1,4,5
, Arthur FJ Ram
1,4
and
Jennifer R Wortman
3
Abstract
Background: Detailed and comprehensive genome annotation can be considered a prerequisite for effective
analysis and interpretation of omics data. As such, Gene Ontology (GO) annotation has become a well accepted
framework for functional annotation. The genus Aspergillus comprises fungal species that are important model
organisms, plant and human pathogens as well as industrial workhorses. However, GO annotation based on both
computational predictions and extended manual curation has so far only been available for one of its species,
namely A. nidulans.
Results: Based on protein homology, we mapped 97% of the 3,498 GO annotated A. nidulans genes to at least
one of seven other Aspergillus species: A. niger,A. fumigatus,A. flavus,A. clavatus,A. terreus,A. oryzae and
Neosartorya fischeri. GO annotation files compatible with diverse publicly available tools have been generated and
deposited online. To further improve their accessibility, we developed a web application for GO enrichment
analysis named FetGOat and integrated GO annotations for all Aspergillus species with public genome sequences.
Both the annotation files and the web application FetGOat are accessible via the Broad Institute’s website (http://
www.broadinstitute.org/fetgoat/index.html). To demonstrate the value of those new resources for functional
analysis of omics data for the genus Aspergillus, we performed two case studies analyzing microarray data recently
published for A. nidulans,A. niger and A. oryzae.
Conclusions: We mapped A. nidulans GO annotation to seven other Aspergilli. By depositing the newly mapped
GO annotation online as well as integrating it into the web tool FetGOat, we provide new, valuable and easily
accessible resources for omics data analysis and interpretation for the genus Aspergillus. Furthermore, we have
given a general example of how a well annotated genome can help improving GO annotation of related species
to subsequently facilitate the interpretation of omics data.
Background
Gene Ontology (GO) is a framework for functional
annotation of gene products aiming to provide a unique
vocabulary for living systems [1]. It comprises Biological
Process (BP), Molecular Function (MF) and Cellular
Component (CC) ontologies. GO terms are organized as
directed acyclic graphs (DAG) meaning that GO terms
are connected as nodes by directed edges defining hier-
archical parent-child relationships. As a consequence,
the specificity of GO terms increases with increasing
distance from their root node. Enrichment analysis of
GO terms is a well accepted approach to dissecting
omics data in a non-biased manner. It has been used in
many studies to highlight major trends in genomic, tran-
scriptomic or proteomic datasets and describe them
with a controlled vocabulary [2-5]. If the frequency of
specific GO terms in a list of genes or proteins is higher
than expected by chance, it is likely that these enriched
GO terms are related to the biological processes under
investigation.
The genus Aspergillus covers a group of filamentous
fungi that includes saprophytes, human and plant patho-
gens as well as species being exploited in biotechnology.
Whereas A. nidulans has been comprehensively studied
andusedasmodelorganism,A. niger,A. oryzae and A.
terreus are important industrial workhorses for the
* Correspondence: bmnitsche@gmail.com
1
Institute of Biology Leiden, Leiden University, Sylviusweg 72, 2333 BE
Leiden, The Netherlands
Full list of author information is available at the end of the article
Nitsche et al.BMC Genomics 2011, 12:486
http://www.biomedcentral.com/1471-2164/12/486
© 2011 Nitsche et al; licensee BioMed Central Ltd. This is an Open Access article distributed under the terms of the Creative Commons
Attribution License (http://creativecommons.org/licenses/by/2.0), which permits unrestricted use, distribution, and reproduction in
any medium, provided the original work is properly cited.

production of various enzymes and organic acids. In
medical research, A. fumigatus and Neosartorya fischeri
are intensively studied because of their importance as
allergens and pathogens of immunocompromised
patients. The aflatoxin producing fungus A. flavus is
well known to cause spoilage of a great variety of agri-
cultural goods. With genome sequences publicly avail-
able for eight of its species, the genus Aspergillus
provides an important group of related fungal species
for comparative genomics [6]. The exceptional role of
this genus in the genomics of filamentous fungi is
further emphasized by a community sequencing project
(CSP#350), which has recently been initiated by the
DOE Joint Genome Institute (JGI), aiming to sequence
nine additional Aspergillus species. However, despite the
importance of the genus Aspergillus, A. nidulans has so
far been the only species with a genome-scale GO anno-
tation inferred from both orthology mapping and
intense manual curation [7-9], thus providing a valuable
resource for the analysis of omics data.
In this work, we have generated a new central reposi-
tory for functional analysis of omics data for the genus
Aspergillus using GO annotation. Firstly, we extended
the GO annotation of A. nidulans to all Aspergillus spe-
cies with publicly available genome sequences and gen-
erated annotation files compatible with diverse publicly
available tools for GO enrichment analysis. Secondly, we
further improved the accessibility of the GO annotation
for the genus Aspergillus by integrating it into a web
tool for GO enrichment analysis and graph visualization
named Fisher’s exact test Gene Ontology annotation
tool (FetGOat). Finally, we performed two case studies
to demonstrate the value and flexibility of the newly
generated resources for functional analysis of omics data
for the genus Aspergillus.
Results
Mapping of GO annotation
A. nidulans is the only Aspergillus species for which
comprehensive GO annotation based on both computa-
tional prediction and extended manual curation of gene-
specific literature is available [9]. It constitutes a valu-
able resource for GO enrichment analysis, which has
proven to be a powerful tool for dissecting omics data,
for example sets of differentially expressed genes. The
GO annotation of A. nidulans available at the Aspergil-
lus Genome Database (AspGD) [9] covers 33% (3,498)
of its predicted transcripts and associates them with
3,340 GO terms. Including all parental nodes, the list of
GO terms extends to 5,508 comprising 3,061 (55%) BP,
1,753 MF (32%) and 694 (13%) CC terms.
To extend this valuable resource to other species of its
genus, we mapped the A. nidulans GO annotation to all
Aspergillus strains with published genome sequences
(see Table 1). Groups of orthologous and close paralo-
gous proteins were compiled with the Sybil comparative
analysis package [10], which applies a modified recipro-
cal best-hit approach comprising two clustering cycles.
Roughly 89% (99,679) of all predicted proteins from the
ten analyzed Aspergillus strains constituted 13,179 Jac-
card orthologous clusters. For A. nidulans, 9,250 of its
predicted proteins were organized in Jaccard ortholo-
gous clusters, meaning that roughly 80% of all A. nidu-
lans proteins were linked to at least one ortholog of
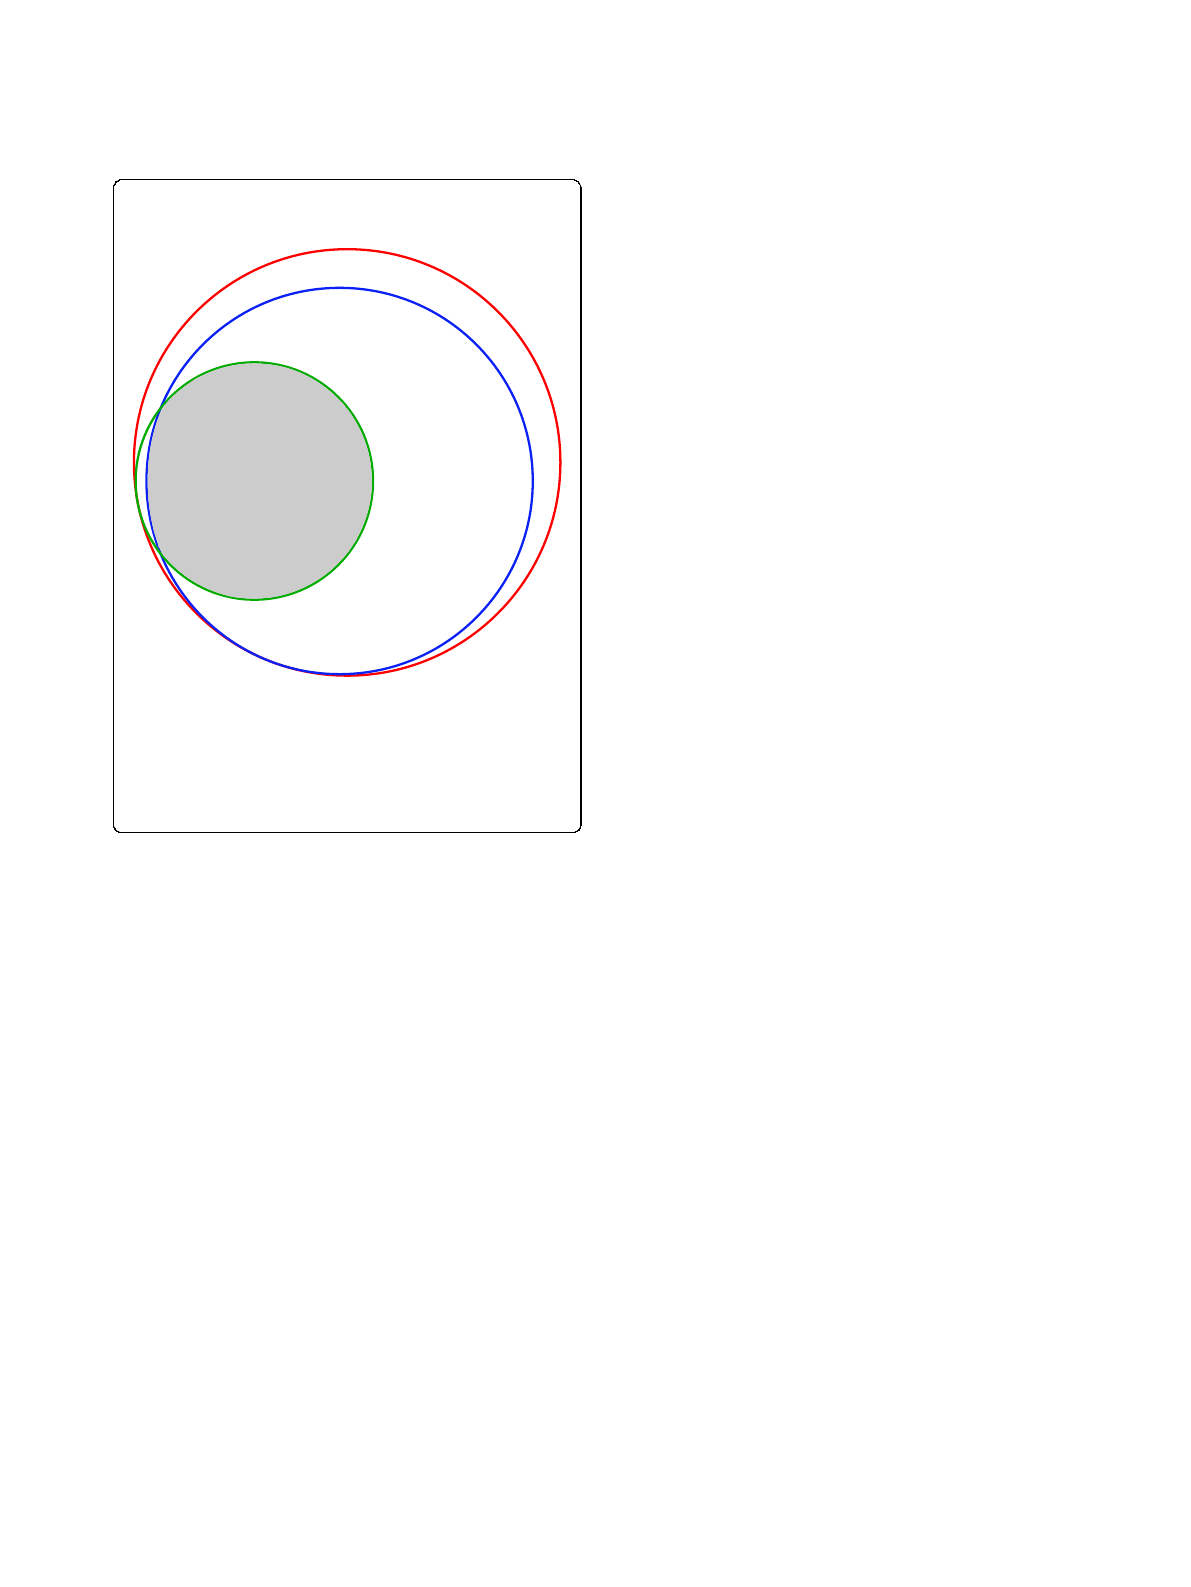
another Aspergillus species. Of the 3,498 GO annotated
A. nidulans genes, 97% were contained in Jaccard ortho-
logous clusters, meaning that their associated annota-
tions could be mapped to at least one other Aspergillus
species (see Figure 1). Overall, mapping resulted in an
average of 3,484 GO annotated transcripts per genome
ranging from 3,403 (A. clavatus) to 3,574 (A. flavus). On
average, their GO annotations comprise 5,436 terms,
(see Table 1). These numbers correspond well to the
GO annotation of A. nidulans and indicate that the
majority (97%) of the A. nidulans GO annotated genes
could be efficiently mapped to the other Aspergilli.
Availability of GO resources for the genus Aspergillus
The newly mapped GO annotations were deposited at
the Broad Institute’s website (http://www.broadinstitute.
org/fetgoat/index.html). Different annotation file formats
were generated that can be used with diverse public
tools for GO enrichment analysis, such as: the Gene Set
Enrichment Analysis tool (GSEA) [11], the functional
annotation suite Blast2GO [12], the Cytoscape plug-in
BiNGO [13] and the Bioconductor package TopGO
[14]. To further improve its accessibility, we have imple-
mented Fisher’s exact test [15], a well-accepted
approach for GO enrichment analysis, in the web appli-
cation FetGOat and integrated the newly mapped GO
annotations. FetGOat can be accessed via a web
Table 1 Mapping of A. nidulans GO annotation
Transcripts
Species Strain Predicted GO annotated (%) GO terms
A. nidulans FGSC A4 10546 3498 (33) 5508
A. fumigatus AF2937 9846 3443 (35) 5445
A. fumigatus A1163 10109 3450 (34) 5446
A. flavus NRRL 3357 13487 3574 (26) 5463
A. niger CBS 513.88 14366 3540 (25) 5430
A. niger ATCC 1015 11200 3487 (31) 5412
A. oryzae RIB40 12319 3502 (28) 5434
A. terreus NIH 2624 10402 3414 (33) 5406
A. clavatus NRRL 1 9379 3403 (36) 5449
N. fischeri NRRL 181 10728 3543 (33) 5445
Summary of mapping A. nidulans GO annotation to seven other Aspergilli. The
number of predicted transcripts were obtained from the Central Aspergillus
Data REpository (CADRE) [40].
Nitsche et al.BMC Genomics 2011, 12:486
http://www.biomedcentral.com/1471-2164/12/486
Page 2 of 11
interface at the Broad Institute’s website (http://www.
broadinstitute.org/fetgoat/index.html). It combines GO
annotations for all Aspergillus species with public gen-
ome sequences and a widely used statistical methodol-
ogy to identify overrepresented GO terms. Via the web
interface, a list of gene identifiers can be uploaded to
the server and statistical parameters can easily be
adjusted with end-user computational skills. After com-
pletion of the analysis on the server-side, the enrich-
ment results are sent by Email. The results consist of
plain text and spreadsheet files as well as scalable vector
graphics representing graphs of enriched GO terms.
Case studies
To demonstrate the flexibility and value of the newly
generated resources for omics data analysis, we per-
formed two case studies analyzing transcriptomic data-
sets recently published for the genus Aspergillus.Inthe
first case study, we demonstrate that the generated
resources can be used with various methods for enrich-
ment analysis. We analyze a set of maltose-induced
genes from A. niger using FetGOat and two alternative
tools for enrichment analysis to subsequently compare
their results. In the second case study, we highlight the
advantage of having GO annotations that are as
comprehensive as possible available for different species.
We use FetGOat to analyze sets of glycerol-induced
genes derived from a three-species microarray study to
highlight major differences in the transcriptional
responses for A. nidulans,A. niger and A. oryzae.
Maltose-induced genes
The first dataset reflects the transcriptomic responses of
A. niger to growth in maltose and xylose-limited chemo-
stat cultures at identical growth rates. From manual
analysis of roughly 700 upregulated genes, Jørgensen et
al. [16] concluded a concerted induction of secretory
pathway genes in maltose compared to xylose-limited
cultures.
Using three alternative approaches, we repeated the
analysis of the maltose induced genes in an automated
and un-biased manner to subsequently compare their
enrichment results. First, we performed the analysis
using the web application FetGOat. We identified 73
enriched GO terms, which were reduced to 19 most-
specific GO terms by removing redundant higher hierar-
chy terms with less detailed annotations. In correspon-
dence to the findings by Jørgensen et al., the enriched
GO terms are related to important steps involved in
protein secretion: Translocation to the endoplasmic reti-
culum, glycosylation and transport between the endo-
plasmic reticulum and the Golgi apparatus (see Table 2).
For comparison of FetGOat with alternative programs,
we used the generated annotation files and repeated the
enrichment analysis with two publicly available tools,
Blast2GO [12] and GSEA [11]. The numbers of enriched
GO terms found with Blast2GO and GSEA are in the
same range compared to the results from FetGOat, they
identified 76 and 47 enriched GO terms, respectively. To
compare the enrichment results from the three tools, we
computed semantic similarity scores with the G-SESAME
tool [17]. For both FetGOat and Blast2GO, the enrich-
ment statistic is based on Fisher’s exact test and thus
their results are theoretically expected to be identical
resulting in a semantic similarity score of 1. A similarity
score of 0.983 confirms that their results are virtually
identical, with minor differences that are likely due to dif-
ferences in their implementations. In contrast to FetGOat
(and Blast2GO), the GSEA results are based on running-
sum statistics computed from the complete expression
data set. Therefore, the similarity between their results
can be expected to be less. Accordingly, G-SESAME
determined a smaller semantic similarity score of 0.863
for the results obtained with FetGOat and the GSEA tool.
In addition to the GO terms identified by both Fish-
er’s exact test based tools, GSEA computed an enrich-
ment of GO terms related to oxidative phosphorylation
(GO:0006119), carbohydrate transport (GO:0008643)
and glucosidase activity (GO:0015926). Comparing mal-
tose to xylose limitation, an enrichment of those GO
A
ll transcripts
(10546)
In Jaccard cluster
s
(9250)
GO annotated
(3498)
5845
3405
93
1203
Figure 1 Mapping A. nidulans GO annotation to Jaccard
orthologous clusters. Area-proportional Venn diagram [39]
showing fractions of all A. nidulans transcripts (red) annotated by
GO (green) and/or associated with Jaccard orthologous protein
clusters (blue). The intersection of all circles (gray), comprising 3405
transcripts, was used to map A. nidulans GO annotation to seven
other Aspergillus species.
Nitsche et al.BMC Genomics 2011, 12:486
http://www.biomedcentral.com/1471-2164/12/486
Page 3 of 11

terms fits our expectations. Under maltose-limitation, A.
niger breaks down the disaccharide into its monomer
glucosebyenzymeshavingglucosidase activity. Subse-
quently, glucose is taken up by carbohydrate transpor-
ters, which can be expected to be different from those
required for the uptake of xylose. Finally, 1 mole of glu-
cose yields more ATP than 1 mole of xylose, thereby
explaining an induction of oxidative phosphorylation.
These differences in the enrichment results are poten-
tially inherited by the statistics applied by Jørgensen et
al. to define the set of maltose-induced genes. In con-
trast to the GSEA tool, which analyzes the complete
expression data, FetGOat and Blast2GO are depending
on a-priori performed statistics that were applied to
generate subsets of genes or proteins of interest.
Jørgensen et al. used the Affymetrix MAS 5.0 algorithm
for data pre-processing in combination with the stu-
dent’s t-test to define their set of maltose induced
genes. In current literature, this approach is critically
discussed [18,19]. To assess the effect of those a-priori
applied statistics on the differences between the results
from FetGOat and the GSEA tool, we generated an
alternative set of maltose-induced genes. We computed
RMA expression data [18] from the raw data (CEL files)
and subsequently applied a moderated t-statistic [20] to
identify upregulated genes (data not shown). Interest-
ingly, FetGOat also identified enriched GO terms related
to glucosidase activity and carbohydrate transport for
this alternative set of maltose-induced genes. However,
no enrichment of genes related to oxidative phosphory-
lation was found. Genes annotated with the GO term
oxidative phosphorylation were only marginally induced
and their FDR values were rather high (data not shown).
Interestingly, similar differences between Fisher’sexact
test based methods and the GSEA tool were reported in
another study. In muscle tissue from diabetics, the
GSEA tool identified a joint downregulation of genes
related to oxidative phosphorylation compared to
healthy controls, while no enrichment was found in the
set of downregulated genes [21]. For tightly regulated
essential cellular processes that show only minor fold
changes, the GSEA tool seems to be superior to gene-
by-gene differential expression studies.
Glycerol-induced genes
In the second case study, we used FetGOat to analyze
transcriptomic data generated by Salazar et al. [22].
Table 2 FetGOat enrichment analysis of maltose-induced genes
Transcripts
GO term Description FDR Ontology Induced Predicted
Translocation to ER
GO:0031204 posttranslational protein targeting 2.7E-04 BP 6 6
GO:0031207 Sec62/Sec63 complex 6.1E-03 CC 3 3
GO:0005787 signal peptidase complex 6.1E-03 CC 3 3
GO:0006616 SRP-dependent cotranslational protein targeting 1.7E-02 BP 4 5
GO:0051605 protein maturation by peptide bond cleavage 1.6E-02 BP 5 8
Glycosylation in ER
GO:0005788 endoplasmic reticulum lumen 3.3E-03 CC 4 5
GO:0008250 oligosaccharyltransferase complex 6.9E-03 CC 4 6
GO:0006487 protein amino acid N-linked glycosylation 4.2E-02 BP 8 24
GO:0016758 transferase activity, transferring hexosyl groups 3.4E-02 MF 14 54
Transport between ER and golgi
GO:0030126 COPI vesicle coat 1.3E-02 CC 4 7
GO:0030127 COPII vesicle coat 6.9E-03 CC 4 6
GO:0006888 ER to Golgi vesicle-mediated transport 4.8E-03 BP 22 92
GO:0030173 integral to Golgi membrane 12.0E-02 CC 5 12
Starch metabolism
GO:0005982 starch metabolic process 4.2E-02 BP 5 10
Miscellaneous
GO:0006066 alcohol metabolic process 4.2E-02 BP 33 199
GO:0003756 protein disulfide isomerase activity 8.2E-03 MF 4 4
GO:0006083 acetate metabolic process 4.2E-02 BP 7 19
GO:0015812 gamma-aminobutyric acid transport 4.2E-02 BP 6 14
GO:0015935 small ribosomal subunit 5.6E-03 CC 12 44
Most specific GO terms identified by FetGOat as being enriched in the maltose-induced gene set. GO terms were grouped in five arbitrary categories:
Translocation into endoplasmic reticulum (ER), glycosylation in ER, transport between ER and golgi, starch metabolism and miscellaneous.
Nitsche et al.BMC Genomics 2011, 12:486
http://www.biomedcentral.com/1471-2164/12/486
Page 4 of 11
Loading more pages...