
ORIGINAL CONTRIBUTION
Modeling elongational viscosity and brittle fracture
of polystyrene solutions
Manfred H. Wagner
1
&Esmaeil Narimissa
2,3
&Leslie Poh
2,3
&Taisir Shahid
4,5
Received: 14 February 2021 /Revised: 13 April 2021 /Accepted: 29 April 2021
#The Author(s) 2021
Abstract
Elongational viscosity data of well-characterized solutions of 3–50% weight fraction of monodisperse polystyrene PS-820k
(molar mass of 820,000 g/mol) dissolved in oligomeric styrene OS8.8 (molar mass of 8800 g/mol) as reported by André et al.
(Macromolecules 54:2797–2810, 2021) are analyzed by the Extended Interchain Pressure (EIP) model including the effects of
finite chain extensibility. Excellent agreement between experimental data and model predictions is obtained, based exclusively
on the linear-viscoelastic characterization of the polymer solutions. The data were obtained by a filament stretching rheometer,
and at high strain rates and lower polymer concentrations, the stretched filaments fail by rupture before reaching the steady-state
elongational viscosity. Filament rupture is predicted by a criterion for brittle fracture of entangled polymer liquids, which assumes
that fracture is caused by scission of primary C-C bonds of polymer chains when the strain energy reaches the bond-dissociation
energy of the covalent bond (Wagner et al., J. Rheology 65:311–324, 2021).
Keywords Polymer melt .Polymer solution .Fracture .Failure .Chain scission .Elongation .EIP model .Interchain pressure .
Finite extensibility
Introduction
Substantial progress in measuring the elongational viscosity
of polymer melts and solutions up to high Hencky strains was
made by the use of the filament stretching rheometer with
locally controlled deformation and deformation rate
developed by Hassager and coworkers (Huang et al. 2016a).
By measuring the local diameter of the polymer sample during
elongation, the true Hencky strain and strain rate can be de-
termined and controlled, while by elongational rheometers
prescribing the global deformation of the filament only nom-
inal values of strain and strain rate can be obtained.
Elongational viscosity measurements with filament stretching
rheometers have revealed surprising differences between the
elongational rheology of polymer melts and solutions (Huang
et al. 2013a,2013b), which in turn has sparked different the-
oretical explanations as discussed, e.g., in Narimissa et al.
(2020a,2021) and Ianniruberto et al. (2020).
Progress in understanding failure of polymer samples in
elongational flow was hampered by the fact that failure of
stretched filaments includes the phenomena of ductile failure
(“necking”) and cohesive failure (“rupture”or “brittle frac-
ture”), and until recently, the experimental separation of these
two fundamentally different failure modes has been difficult
or even impossible. A further achievement of the filament
stretching rheometer as shown by Huang et al. (2016b),
Huang and Hassager (2017) and Huang (2019) was that when
the true Hencky strain rate is controlled rather than nominal
Hencky rate, the four failure zones of the so-called Malkin
plot (Malkin and Petrie 1997) (purely viscous zone,
*Manfred H. Wagner
manfred.wagner@tu-berlin.de
*Esmaeil Narimissa
esmaeiln@technion.ac.il
1
Polymer Engineering/Polymer Physics, Berlin Institute of
Technology (TU Berlin), Ernst-Reuter-Platz 1,
10587 Berlin, Germany
2
Department of Chemical Engineering, Technion–Israel Institute of
Technology (IIT), Technion City, 32 000 Haifa, Israel
3
Department of Chemical Engineering, Guangdong Technion–Israel
Institute of Technology (GTIIT), Shantou 515063, China
4
Bio and Soft Matter, Institute on Condensed Matter and
Nano-science, Université catholique de Louvain,
Louvain-la-Neuve, Belgium
5
DSM Materials Science Center, P.O. Box 18, NL-6160
MD Geleen, The Netherlands
https://doi.org/10.1007/s00397-021-01277-1
/ Published online: 14 June 2021
Rheologica Acta (2021) 60:385–396

viscoelastic zone with failure by necking, rubbery zone,
glassy zone) are reduced to just two possible states: liquid or
solid, and a clear distinction exists between liquid-like behavior
(unlimited steady-state elongation) and solid-like behavior (brit-
tle fracture). A quantitative criterion for brittle fracture of
entangled polymer liquids (Wagner et al. 2018) was recently
extended by taking finite chain extensibility and polymer fraction
of the solutions into account (Wagner et al. 2021). Filament
rupture follows from scission of primary C-C bonds, when the
strain energy of an entanglement segment reaches the bond-
dissociation energy of the covalent bond. Thermal fluctuations
lead to short-time concentration of the strain energy on one C-C
bond of the entanglement segment, and the chain ruptures.
In the present paper, we analyze the elongational viscosity
data of well-characterized solutions of 3–50% mass fraction of
monodisperse polystyrene (PS-820k with a molar mass of
820,000 g/mol) dissolved in oligomeric styrene (OS8.8 with
a molar mass of 8800 g/mol) as reported by Shahid (2018)and
André et al. (2021). The polymer solutions show increasing
strain hardening behavior with decreasing polymer concentra-
tion, which is associated with an increasing tendency of fila-
ment rupture at higher elongation rates. Experimental data of
elongational stress growth coefficient and steady-state
elongational viscosity as well as stress and strain at fracture
are compared to the prediction of the Extended Interchain
Pressure (EIP) model (Narimissa et al. 2020a,2021) including
the effects of finite chain extensibility and a recently devel-
oped fracture criterion for brittle fracture of polymer melts and
solutions (Wagner et al. 2021). Modeling is based exclusively
on linear-viscoelastic characterization of the solutions and the
ratio of carbon-carbon bond energy to thermal energy, and
does not require any fit parameter. The EIP model with the
fracture criterion is the only model presently available for
quantitative modeling of time-dependent nonlinear-viscoelas-
tic flows including brittle fracture of polymer systems.
The paper is organized as follows: We first give a short
report of the experimental data and the linear-viscoelastic
characterization of the polymer systems considered, followed
by a short account of the EIP model and the fracture criterion.
The main focus of the paper is on comparison of experimental
data and model predictions, and on the conclusions that can be
drawn from this comparison.
Experimental data and linear-viscoelastic
characterization
The polymer PS-820k with a molar mass of 820 kg/mol and
polydispersity index of 1.02 was obtained from Polymer
Source, Inc. (Montreal, Canada). Preparation of solutions is
described in detail by Shahid (2018) and André et al. (2021),
and the molecular characteristics of the polystyrene solutions
are summarized in Table 1. The samples are named in the
form of PS-820k/8.8k-X, where 820k characterizes the molar
mass of the polystyrene, 8.8k the molar mass of the oligomeric
styrene solvent with 8.8 kg/mol and with polydispersity index
of 1.1, and X the percentage of mass and (assuming equal
density of PS melt and solution) volume fraction of the PS
in the solution.
Details of mechanical spectroscopy and elongational vis-
cosity measurements are presented in Shahid (2018).
Elongational measurements using a VADER 1000 (Huang
et al. 2016a) were performed at T = 130 °C. Storage (G′)and
loss modulus (G″) were measured at iso-T
g
temperatures T
0
,
i.e., temperatures with equal distance to the glass transition
temperature T
g
with T
0
=T
g
+23.4K,andshiftedtoT=
130 °C by time-temperature shifting (TTS) according to the
WLF equation with shift factor a
Tg
log10aTg¼−c0
1T−T0
ðÞ
c0
2T−T0
ðÞ ð1Þ
and coefficients c0
1¼8:99 and c0
2¼81:53K (Wagner 2014).
From the mastercurves of G′and G′, parsimonious relaxation
spectra were obtained,
GtðÞ¼∑
i
giexp −t=τi
ðÞ ð2Þ
for characterization of the linear viscoelasticity (LVE) in the
experimentally accessible window of all polymer systems
considered here. The partial moduli g
i
and relaxation times
τ
i
as determined by the IRIS software (Winter and Mours
2006) result in excellent agreement with the linear-
viscoelastic data of G′and G″(see Fig. S1and Table S1of
the Support Information).
From the plateau modulus G
N
GN¼ρRT
Með3Þ
the entanglement molar mass M
e
is obtained, and with M
being the molar mass of the polymer, the number of entangle-
ments per chain Zis given by
Z¼M
Með4Þ
The relation between the entanglement molar mass of the
polymer in solution, M
e
, and entanglement molar mass in the
melt, M
em
,isgivenby
Me¼Memφ−αð5Þ
with φbeing the polymer volume fraction in the solution. To
be consistent with earlier works (Huang et al. 2013a,2013b,
2016b;Wagner2014; Narimissa et al. 2020a,2021), we take
G
N
=2.5⋅10
5
Pa and M
em
= 13,300 g/mol for polystyrene in the
melt state. (The index mcharacterizes the melt state in the
386 Rheol Acta (2021) 60:385–396
following.) The value of the dilution exponent αis model
dependent (1 < α< 4/3), and a value of α= 1 is taken here.
The number of Kuhn segments or “monomers”between en-
tanglements is N
e
=M
e
/M
0
, where M
0
= 610 g/mol is the molar
mass of the Kuhn monomer assumed to be independent of
dilution.
According to the Doi-Edwards model, the Rouse time τ
R
,
the disengagement (or reptation) time τ
d
, and the zero-shear
viscosity η
0
are given by (Dealy et al. 2018)
τR¼Z2τeð6Þ
τd¼3ZτRð7Þ
η0¼π
12
2GNτdð8Þ
τ
e
is the entanglement segment equilibration time. We
identify here τ
d
with the mean quadratic average of the relax-
ation times of the discrete relaxation spectrum and calculate η
0
from the discrete relaxation spectrum:
τd¼
∑
i
giτ2
i
∑
i
giτið9Þ
η0¼∑
i
giτið10Þ
We use Osaki’s approach (Osaki et al. 1982; Takahashi
et al. 1993; Isaki et al. 2003; Menezes and Graessley 1982)
for the quantification of the Rouse time τ
R
, which extrapolates
the Rouse time of unentangled polymer systems to the Rouse
time of entangled polymer melts and solutions, and takes into
account the power of 3.4 scaling of the zero-shear viscosity
with molar mass Mand polymer fraction φ(Wagner 2014).
This leads to the relation
τR¼12Mη0
π2ρRTφ
Mcm
Mφ
2:4
ð11Þ
for the Rouse stretch relaxation time. M
cm
denotes the crit-
ical molar mass in the melt state, when the entanglement
effect becomes apparent by a change of the power of 1 to
power of 3.4 scaling of the zero-shear viscosity as a func-
tion of molar mass. For monodisperse polystyrene, we take
the well-documented value of M
cm
= 35kg/mol (Wagner
2014), and Eq. (11) has been used successfully for the
modeling of the transient and steady-state elongational
and shear viscosities of PS melts and well-entangled poly-
mer solutions (Narimissa et al. 2020a,2020b,2021;
Wagner et al. 2021).
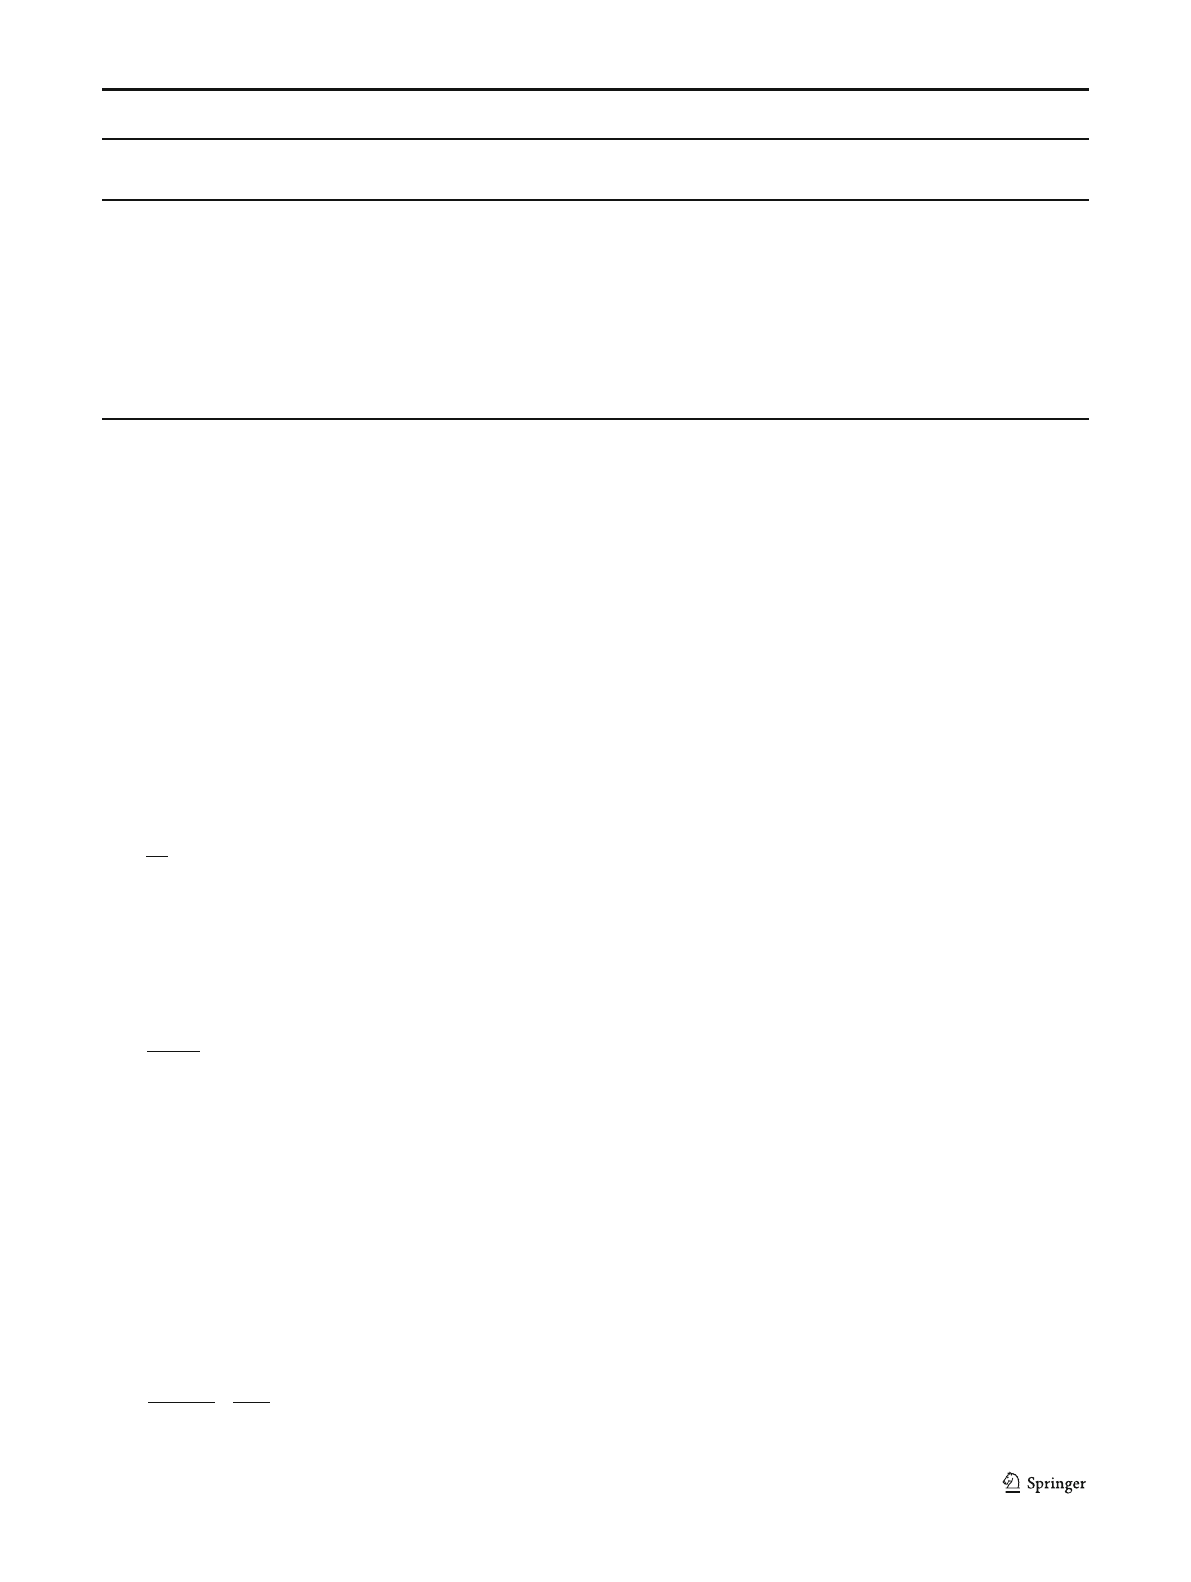
For the solutions of PS-820k in OS8.8k, the power of
3.4 scaling of the zero-shear viscosity of polymer solutions
with polymer fraction φat iso-T
g
temperatures of T
0
=
T
g
+ 23.4 K is shown in Fig. 1. The solutions with polymer
fractions of 50, 40, 30, and 20% (full symbols in Fig. 1)
follow nicely the relation η
0
=η
0m
φ
3.4
with a value of
η
0m
=1.07⋅10
10
Pas for the zero-shear viscosity of the melt,
while for solutions with polymer fractions of 5 and 3%
(open symbols), the zero-shear viscosity is higher than ex-
pected, possibly affected by the viscosity of the solvent
OS8.8k, which has a value of η
0
=1.0⋅10
4
Pas at 130 °C.
Thus, the solutions with polymer fractions φ≤0.1 deviate
fromthescalingpresumedbyEq.(11) and cannot be de-
termined from this relation. To be consistent with previous
investigations (Narimissa et al. 2020a;Wagneretal.2021),
we calculate τ
R
by using Eq. (11) for melt 820k and its
solutions with polymer fractions of 20–50%, while at low-
er polymer concentration, the Rouse time of the solution is
taken as the time-temperature-shifted value of the Rouse
time of the melt.
Table 1shows glass transition temperature (T
g
), shift factor
(aTg), entanglement molar mass (M
e
), number of entangle-
ments per chain (Z), number of Kuhn monomers (N
e
) per
entanglement, zero-shear viscosity (η
0
), disengagement/
reptation time (τ
d
), and Rouse stretch relaxation time (τ
R
)at
T = 130 °C of the monodisperse polymer samples considered
in this study.
Table 1 Sample characterization at T = 130 °C
PS-820k
melt
PS-820k/
8.8k-50
PS-820k/
8.8k-40
PS-820k/
8.8k-30
PS-820k/
8.8k-20
PS-820k/
8.8k-10
PS-820k/
8.8k-05
PS-820k/
8.8k-03
T
g
[°C] 106.6 102.3 101.3 100.7 99.8 98.6 98.4 98.1
a
Tg
[−] 1 0.35 0.28 0.25 0.20 0.16 0.15 0.14
M
e
[kg/mol] 13.3 26.6 33.3 44.3 66.5 133 266 443
Ζ[−] 61.7 30.8 24.7 18.5 12.3 6.2 3.1 1.8
Ν
e
21.8 43.6 54.5 72.7 109 218 436 727
η
0
[Pa s] 1.07Ε+10 3.87Ε+8 1.46Ε+8 4.01Ε+7 8.01Ε+6 6.01Ε+5 1.02Ε+5 3.01Ε+4
τ
d
[s] 429,918 21,461 12,634 6631 4369 1591 906 114
τ
R
[s] 1644 628 505 369 293 259 248 233
387Rheol Acta (2021) 60:385–396
The Extended Interchain Pressure (EIP) model
The molecular stress function (MSF) model is a generalized
tube segment model with strain-dependent tube diameter
(Wagner 1990; Wagner and Schaeffer 1992; Wagner et al.
2001,2003,2005; Narimissa et al. 2021b). The extra stress
tensor σ(t) of the MSF model with consideration of finite
chain extensibility effects (Rolon-Garrido et al. 2006)isgiven
by a history integral of the form
σtðÞ¼ ∫
t
−∞
∂Gt−t0
ðÞ
∂t0fλSIA
DEt;t0
ðÞdt0ð12Þ
tis the time of observation when the stress is measured, and
t′indicates the time when a tube segment was created by
reptation. The strain measure SIA
DErepresents the contribution
to the extra stress tensor originating from the affine rotation of
the tube segments assuming “Independent Alignment (IA)”
(Doi and Edwards 1978,1979), and is given by
SIA
DE t;t0
ðÞ≡5u0u0
u02
o¼5St;t0
ðÞ ð13Þ
with S(t,t′) is the relative second-order orientation tensor.
u'u' is the dyad of a deformed unit vector u0¼u0t;t0
ðÞ,
u0¼F−1
t⋅uð14Þ
F−1
t¼F−1
tt;t0
ðÞis the relative deformation gradient tensor,
and u' is the length of u'. The orientation average is indicated
by <…>
0
,
…
hi
o≡1
4π∯…½sinθodθodϕoð15Þ
i.e., an average over an isotropic distribution of unit vectors
u.
λ=λ(t,t')represents the inverse of the relative tube diame-
ter a/a
0
, and at the same time the relative length of a deformed
tube segment,
λt;t0
ðÞ¼a0
at;t0
ðÞ
¼lt;t0
ðÞ
l0ð16Þ
At time t=t′, the tube segment was created with equilibri-
um tube diameter a
0
and equilibrium length l
0
.
In the Gaussian limit, the molecular stress function f,i.e.,
the relative tension in the chain, is equal to the tube stretch λ.
However, this is valid only as long as λ<0.5λ
max
(Bird et al.
1987), where λmax≅ffiffiffiffiffiffi
Ne
prepresents the maximum stretch (i.e.,
a fully extended chain), and N
e
the number of Kuhn mono-
mers in an entanglement segment. Outside the Gaussian re-
gime, tension in the chain can be described by the inverse
Langevin function, or, due to its mathematical complexity,
approximations like the Padé approximations (Cohen 1991).
Therefore, the nonlinear elasticity caused by finite extensibil-
ity (FENE) is implemented in the EIP theory in the following
way:
f¼cλ
ðÞ
λð17Þ
cis a nonlinear spring coefficient, representing a relative
Padé inverse Langevin function with
c¼
3−λ2
λ2
max
!
⋅1−1
λ2
max
!
3−1
λ2
max
!
⋅1−λ2
λ2
max
! ð18Þ
Maximal stretch λ
max
is defined as
λ2
max ¼Ne¼Nemφ−1ð19Þ
with N
e
given in Table 1.
While SIA
DE is determined directly by the deformation his-
tory according to Eq. (13), λis found as a solution of an
evolution equation considering affine tube segment deforma-
tion balanced by Rouse relaxation and interchain pressure
(Wagner et al. 2021). We modified the evolution equation of
Narimissa et al. (2020a) by including the effect of finite ex-
tensibility into the interchain pressure term in the same way as
explained in detail by Rolon-Garrido et al. (2006),
∂λ
∂t¼λκ:SðÞ−λ−1
τR
1−2
3φ4
−2φ4
9τR
λ2λf2−1
ð20Þ
10
-2
10
-1
10
0
[-]
10
4
10
5
10
6
10
7
10
8
10
9
10
10
10
11
0[Pa s]
ϕ
η
Fig. 1 Zero-shear viscosity of solutions of PS-820k in OS8.8 with
polymer fractions of 50, 40, 30, and 20% (full symbols), and 5 and 3%
(open symbols) at iso-T
g
temperatures T
0
=T
g
+ 23.4 K. Line indicates
the relation of η
0
=η
0m
φ
3.4
with η
0m
=1.07⋅10
10
Pas
388 Rheol Acta (2021) 60:385–396

In Eq. (20), the first term on the right-hand side describes
an affine deformation, the second term Rouse relaxation, and
the third term represents the interchain pressure contribution.
Equation (20) reduces to the evolution equation of the EIP
model of Narimissa et al. (2020a) in the Gaussian limit, i.e.,
when c=1andf=λ.Equations(12)and(20) represent the
EIP model with finite chain extensibility and are solved
numerically.
From Eq. (20) follows at high Weissenberg numbers Wi
¼˙"τR(with elongational strain rate ˙") and large deforma-
tions, when the equilibrium stretch is reached and ∂λ/∂t=0
that the product of molecular stress fand stretchλis propor-
tional to the square root of Wi and inverse proportional to the
square of the polymer fraction,
fλ¼cλ2¼3
2φ−2ffiffiffiffiffiffiffiffi
2Wi
pð21Þ
In this asymptotic limit and neglecting the glass transition,
the tensile stress is expected to reach a value of
σ¼5GNfλ¼15
2GNφ−2ffiffiffiffiffiffiffiffi
2Wi
pð22Þ
From Eq. (22) and considering that G
N
=G
Nm
φ
2
, the uni-
versal relation for the high Wi tensile stress of melts and
solutions of Narimissa et al. (2020a)isrecovered,
σ¼15
2GNm ffiffiffiffiffiffiffiffi
2Wi
pð23Þ
with G
Nm
being the plateau modulus of the melt.
The fracture criterion
The thermal energy w
eq
at a temperature Tof 403 K (130 °C)
is
weq ¼3kT ¼1:67⋅10−20 Jð24Þ
with Boltzmann’sconstantk=1.38⋅10
−23
J/K. On the other
hand, the bond-dissociation energy of a single carbon-carbon
bond in hydrocarbons is (Wagner et al. 2018)
U¼348kJ
NA¼5:78⋅10−19 J≅35weq ð25Þ
with Avogadro’snumberN
A
=6.02⋅10
23
.Thus,thebonden-
ergy Uis about 35 times larger than the thermal energy w
eq
at
130 °C, which is why the polymer chain will not break due to
Brownian motion at equilibrium.
As explained by Wagner et al. (2021), the strain energy of a
chain segment is taken as
wN
em
ðÞ¼3kTfλφ ð26Þ
with N
em
being the number of Kuhn monomers of an en-
tanglement segment in the melt. When the strain energy of the
segment reaches the critical energy
wc¼3kTf cλcφ¼Uð27Þ
the total strain energy of the chain segment will be concentrat-
ed on one C-C bond by thermal fluctuations, and this bond
then ruptures. We recall that stretch and tension are relative
quantities, and therefore, the strain energy w=w(t,t') is also a
relative quantity. Chain segments with long relaxation times,
i.e., those preferably in the middle of the chain, will be the first
to reach the critical energy w
c
and will fracture. Chain seg-
ments closer to the ends of the macromolecule, which due to
reptation processes have shorter relaxation times and see less
stretch and tension within the time interval of t′(creation) and t
(observation), will not reach w
c
and are less likely to fracture.
We assume that as soon as the strain energy w=w(t,t'=0)
accumulated between the start-up of deformation at time t′=0
and time t=t
c
reaches the critical energy w
c
=w(t=t
c
,t' = 0),
a sufficient concentration of locally ruptured chains is reached
and crack initiation will occur. Crack initiation is followed by
crack growth, which leads within a very short time (about
200 ms according to Huang et al. (2016b)) to brittle fracture
of the sample. At time t=t
c
, the critical Hencky strain at frac-
ture, εc¼˙"tc, is reached and the critical tensile stress at frac-
ture, σ
c
=σ(t
c
), is given by the stress equation (Eq. (12)).
Chain fracture preferably in the middle of the polymer chain
is in agreement with earlier findings of Ballauf and Wolf
(1984): They studied the degradation of solutions of 4.9–
20 wt% of polystyrene in trans-decalin by use of a shear cell
at shear rates of 5:0⋅103<
˙
γ<104s−1, and showed that only
a Gaussian breakage probability of C-C bonds with the center
of the probability distribution at the midpoint of the chain can
reproduce the experimentally observed changes in the molar
mass distribution.
From the fracture hypothesis defined by Eq. (27), the max-
imum achievable product of critical molecular stress f
c
and
critical stretch λ
c
is obtained,
fcλcφ¼cλ2
cφ¼U
3kT ≅35 ð28Þ
We called this fracture mode “entropic fracture”(Wagner
et al. 2018), as it is caused by thermal fluctuations, in contrast
to the “enthalpic fracture”hypothesis of Lake and Thomas
(1967)asmodifiedbyMazichandSamus(1990). These au-
thors assumed that all bonds are fully stretched at fracture and
when a chain with NC-C bonds between two entanglement
points ruptures, the strain energy w
c
=NU corresponding to
thebondenergyofall N C-C bonds in the entangled chain
segment is dissipated.
Combining the fracture criterion of Eq. (28) with the as-
ymptotic tensile stress at high Wi and large stretch according
389Rheol Acta (2021) 60:385–396
Loading more pages...