
Satellite Image Search in AgoraEO
Ahmet Kerem Aksoy
TU Berlin
Pavel Dushev∗
pavel.dushev@sap.com
SAP Labs
Eleni Tzirita Zacharatou
IT University of Copenhagen
Holmer Hemsen
holmer.hemsen@dfki.de
DFKI
Marcela Charfuelan
marcela.charfuelan@dfki.de
DFKI
Jorge-Arnulfo Quiané-Ruiz
TU Berlin and DFKI
Begüm Demir
TU Berlin
Volker Markl
volker[email protected]
TU Berlin and DFKI
ABSTRACT
The growing operational capability of global Earth Observation
(EO) creates new opportunities for data-driven approaches to un-
derstand and protect our planet. However, the current use of EO
archives is very restricted due to the huge archive sizes and the lim-
ited exploration capabilities provided by EO platforms. To address
this limitation, we have recently proposed MiLaN, a content-based
image retrieval approach for fast similarity search in satellite image
archives. MiLaN is a deep hashing network based on metric learning
that encodes high-dimensional image features into compact binary
hash codes. We use these codes as keys in a hash table to enable
real-time nearest neighbor search and highly accurate retrieval.
In this demonstration, we showcase the efficiency of MiLaN by
integrating it with EarthQube, a browser and search engine within
AgoraEO. EarthQube supports interactive visual exploration and
Query-by-Example over satellite image repositories. Demo visitors
will interact with EarthQube playing the role of different users
that search images in a large-scale remote sensing archive by their
semantic content and apply other filters.
PVLDB Reference Format:
Ahmet Kerem Aksoy, Pavel Dushev, Eleni Tzirita Zacharatou, Holmer
Hemsen, Marcela Charfuelan, Jorge-Arnulfo Quiané-Ruiz, Begüm Demir,
and Volker Markl. Satellite Image Search in AgoraEO. PVLDB, 15(12): 3646 -
3649, 2022.
doi:10.14778/3554821.3554865
1 INTRODUCTION
Why do two regions in the world feel similar? What are the key
characteristics that determine the fire proneness of a region? The
stakeholders shaping the future of our planet, including scientists,
practitioners, and other policy makers, typically rely on experience,
precedent, and data analyzed in isolation to answer such critical
questions. In this context, the growing operational capability of
global Earth Observation (EO) provides stakeholders with a wealth
∗Work done while the author was at TU Berlin.
This work is licensed under the Creative Commons BY-NC-ND 4.0 International
License. Visit https://creativecommons.org/licenses/by-nc-nd/4.0/ to view a copy of
this license. For any use beyond those covered by this license, obtain permission by
licensed to the VLDB Endowment.
Proceedings of the VLDB Endowment, Vol. 15, No. 12 ISSN 2150-8097.
doi:10.14778/3554821.3554865
of information, creating tremendous opportunities for data-driven
EO approaches. However, users need a significant amount of tech-
nical expertise to validate their assumptions over large EO data
archives and gain actionable insights.
The main obstacle that non-technical users face is the limited
exploration capabilities provided by EO platforms [
1
]. While they
usually allow searching by geographical extent, acquisition time,
or sensor type, they do not support searching by the semantic
content of satellite images. This is crucial for many applications,
such as mapping burnt forests or flooded residential areas. To help
users discover relevant data in today’s deluge of satellite images,
image search engines that extract and exploit the image content
are necessary [
5
]. The goal is to obtain a list of similar satellite
images from a user-selected query satellite image. For example, a
user could select a portion of a satellite image acquired from a burnt
forest area as a query and then let the search engine return images
containing burnt forest and having similar spatial and spectral
information content at a global scale. This functionality can be
crucial for climate change and ecological studies, among others.
To achieve scalable content-based image retrieval (CBIR), hashing-
based approximate nearest neighbor search schemes have become
a cutting-edge research topic due to their high efficiency in both
storage cost and search retrieval speed [
5
]. Furthermore, the suc-
cess of deep neural networks in image feature learning has inspired
research on developing deep learning-based hashing methods (i.e.
deep hashing methods). In our recent work, we developed several
deep hashing methods for CBIR that embed high-dimensional im-
age features into compact binary hash codes based on suitable loss
functions [
3
]. We use these binary codes as keys in a hash table,
thereby enabling real-time nearest neighbor search.
We have also developed the BigEarthNet archive [
4
], a large-scale
multi-label benchmark archive for remote sensing image classifica-
tion and retrieval. We annotated each image in BigEarthNet with
multi-labels that describe the different land cover types using the
CORINE Land Cover (CLC) map of 2018. Yet, this is only a part
of the complete story: Users also need (i) query tools that provide
flexible label-based filtering when navigating the BigEarthNet data,
and (ii) to obtain intuitive visualizations that summarize the dis-
tribution of land cover types in a given area of interest to derive
meaningful insights.
We present EarthQube; a system that allows users to query and
visualize satellite data efficiently and reverse search for satellite
3646
images based on their semantic content. Specifically, EarthQube
supports the fast search for highly similar images given an existing
satellite image. Through a user-friendly interface, our demonstra-
tion lets users select an image of interest and obtain a ranked list
of similar satellite images from a search index that contains all the
images in the BigEarthNet data archive. Furthermore, our demon-
stration lets users filter satellite images based on their land cover
labels and provides an intuitive visualization of the occurrence of
different labels in a given area. Last but not least, our demonstra-
tion also supports standard filter operations, such as searching by
geographical extent and acquisition date.
We note that while this demonstration focuses on scalable EO im-
age search, this work is part of our larger AgoraEO vision [
2
]. Ago-
raEO provides the technical EO infrastructure on top of Agora [
6
],
a data infrastructure for AI innovation. In more detail, AgoraEO
aims at supporting EO ecosystems where one can offer, discover,
combine, and efficiently execute EO-related assets, such as datasets,
algorithms, and tools, to get data-driven insights. EarthQube is a
browser and search engine within AgoraEO providing efficient and
easy access to BigEarthNet data.
2 TECHNICAL OVERVIEW
We start by briefly presenting BigEarthNet, the benchmark archive
that we developed and use in our demo scenarios. Then, we present
MiLaN, which is the core technology behind EarthQube.
2.1 The BigEarthNet Archive
The BigEarthNet archive
1
is a large-scale benchmark archive con-
sisting of 590,326 pairs of Sentinel-1 and Sentinel-2 satellite images
acquired from 10 European countries (i.e., Austria, Belgium, Finland,
Ireland, Kosovo, Lithuania, Luxembourg, Portugal, Serbia, Switzer-
land) between June 2017 and May 2018 [
4
]. The Sentinel-2 satellite
constellation acquires multispectral images with 13 spectral bands
and varying spatial resolutions. BigEarthNet excludes the 10th band
because it does not embody surface information, thus keeping 12
bands per image. Each BigEarthNet Sentinel-2 image is a section
of: (i) 120
×
120 pixels for 10m bands; (ii) 60
×
60 pixels for 20m
bands; and (iii) 20
×
20 pixels for 60m bands. The Sentinel-1 satellite
constellation acquires synthetic-aperture radar data. BigEarthNet
Sentinel-1 images contain dual-polarized information channels (VV
and VH) with a spatial resolution of 10m and are based on the
interferometric wide swath mode, which is the main acquisition
mode over land. Each pair of images in BigEarthNet is annotated
with multi-labels provided by the CLC map of 2018 based on its
thematically most detailed Level-3 class nomenclature. For details
about BigEarthNet, we refer the reader to [4].
2.2 The MiLaN Approach
Given a query image, we aim to retrieve the most similar satellite
images to the query from huge data archives in a highly time-
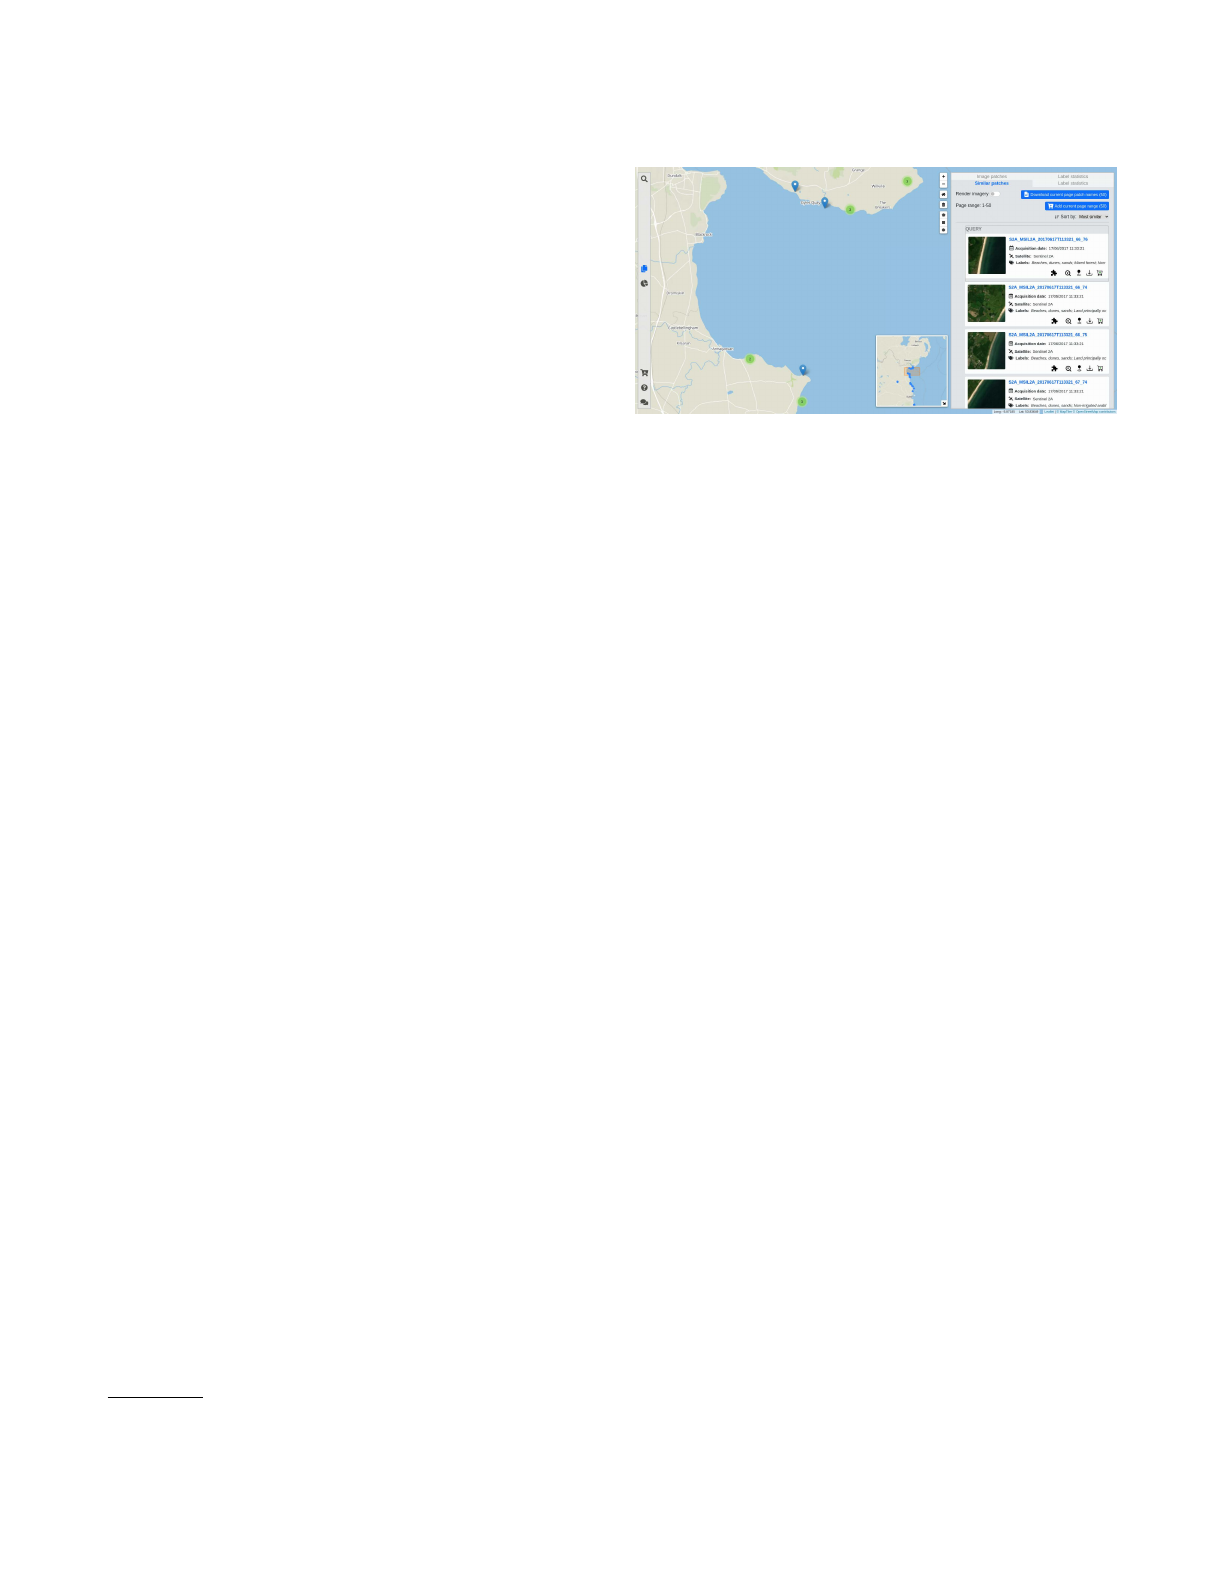
efficient manner. For example, given an image that depicts a beach,
we want to find images of similar beaches in different locations, as
shown in Figure 1. To enable image indexing and scalable search,
we apply deep hashing to BigEarthNet images using our recent
metric learning-based deep hashing network (MiLaN) [
3
]. MiLaN
1https://bigearth.net/
Figure 1: Content-based Image Retrieval in EarthQube.
simultaneously learns: (i) a semantic-based metric space for effec-
tive feature representation; and (ii) compact binary hash codes for
scalable search. To train MiLaN, we use three loss functions: (i) the
triplet loss function to learn a metric space where semantically simi-
lar images are close to each other and dissimilar ones are separated;
(ii) the bit balance loss function that forces the hash codes to have
a balanced number of binary values (i.e., each bit has a 50% chance
to be activated) and makes the different bits independent from each
other; and (iii) the quantization loss function that mitigates the
performance degradation of the generated hash codes through bi-
narization on the deep neural network outputs. As proven in [
3
], the
learned hash codes based on the above loss functions can efficiently
characterize the complex semantics in satellite images.
After obtaining the binary hash codes of the archive images, we
generate a hash table that stores all images with the same hash code
in the same hash bucket. Then, we perform image retrieval through
hash lookups, i.e., we retrieve all images in the hash buckets that
are within a small hamming radius of the query image.
In this demonstration, we integrate MiLaN into EarthQube, thus
allowing users to perform fast image-based similarity search on the
BigEarthNet data archive.
3 EARTHQUBE
We now introduce EarthQube by first explaining its interface and
then outlining its overall architecture. Finally, we describe the inte-
gration of MiLaN to enable CBIR.
3.1 User Interface
The visual interface of EarthQube is composed of a map rendering
component (see Figure 2). EarthQube overlays various menus and
panels on the map for easy configuration and hides them when not
needed for better map navigation. Users perform operations on the
map (e.g., zoom in/out) through mouse interactions.
Query Panel. Users can issue queries through the main search
menu (left side of the map in Figure 2-1). Specifically, the coordinates
subsection allows users to define a geospatial area by choosing
a shape (i.e., rectangle or circle) and manually typing the area
coordinates. Alternatively, users can draw an arbitrary rectangle,
circle, or polygon directly on the map. In addition, users can filter
the data based on the acquisition date range, satellites, seasons, and
labels (land cover classes).
3647
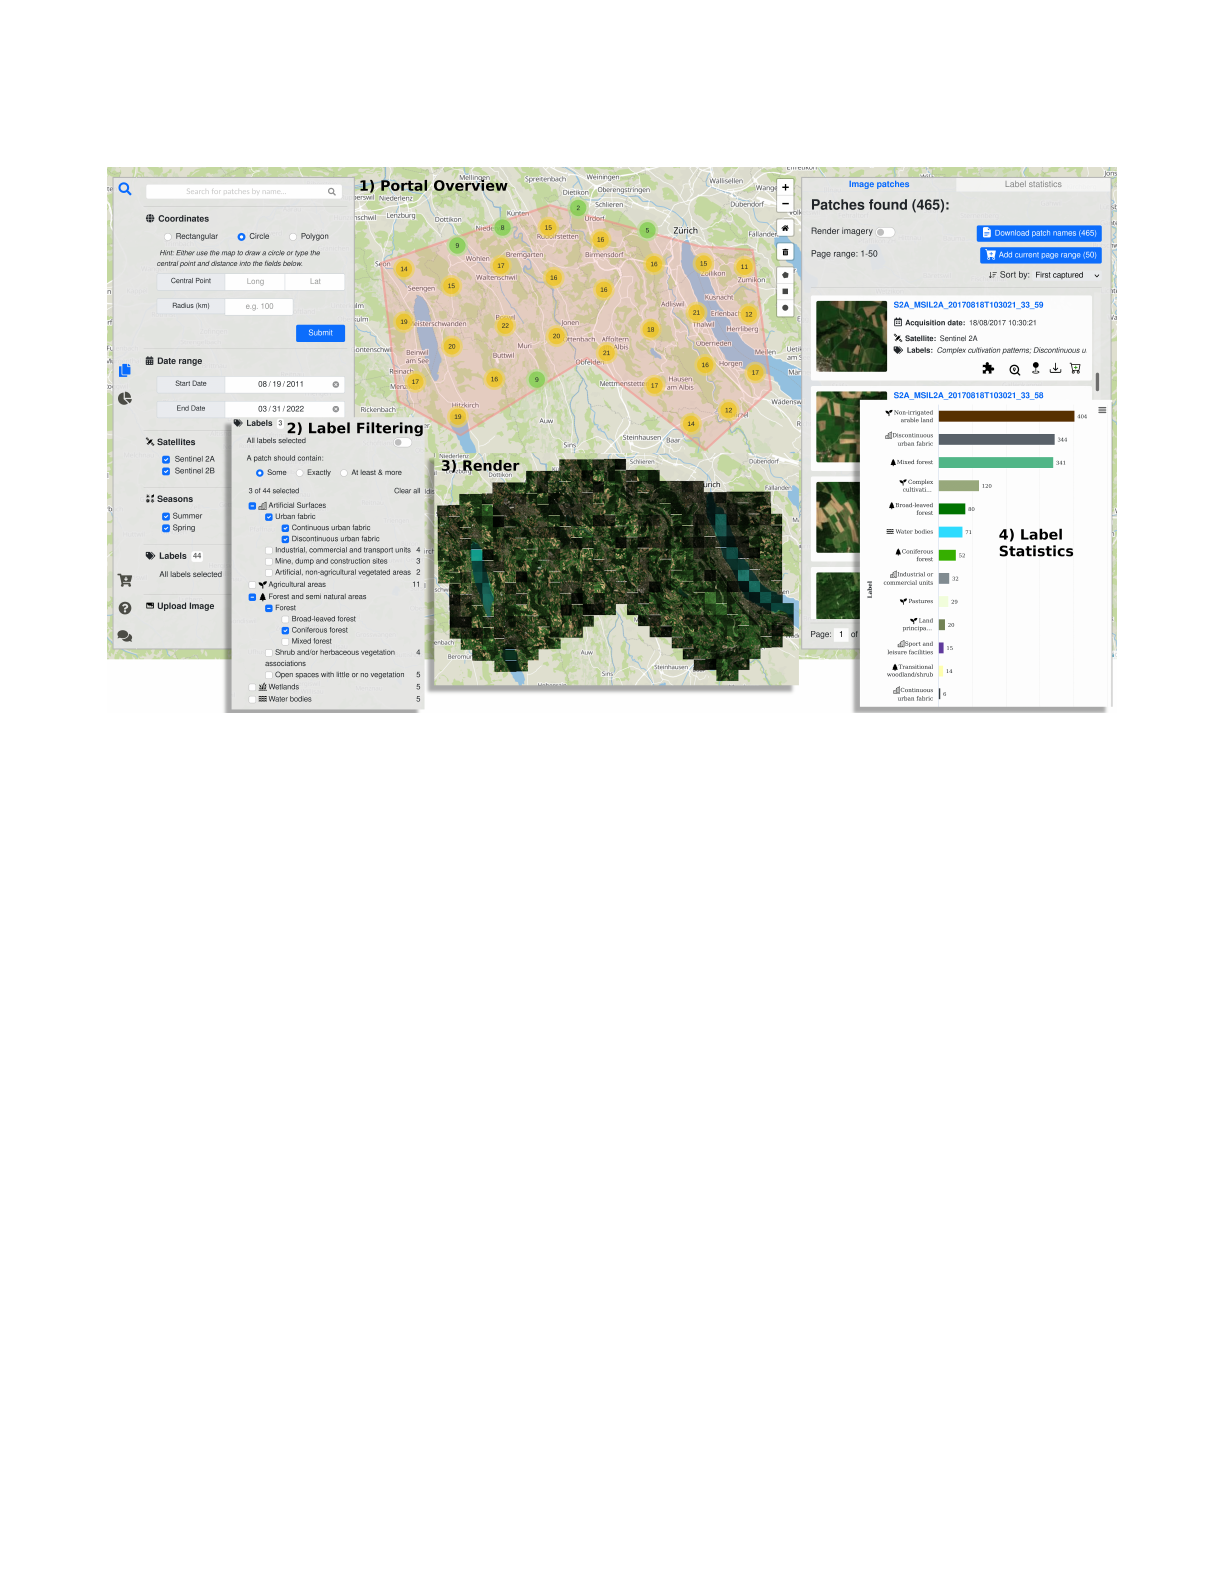
Figure 2: The visual interface of EarthQube. Users can: 1) overview the portal; 2) select query labels; 3) render result images; 4)
see land cover class distribution for the query.
Users can control the labels using a switch button, which is ini-
tially turned on (i.e., no label-based filtering applies). Turning the
button off provides complete control over the label filtering criteria,
as shown in Figure 2-2. EarthQube groups the labels in a three-level
hierarchy following the structure of the CLC land cover classes
nomenclature. Furthermore, it supports three filtering operators:
Some,Exactly, and At least & more. The Some operator retrieves
all relevant images that have at least one of the selected labels.
For example, to retrieve images with forests, the user can select
the Level-2 class Forest that comprises of three types of Level-3
forest labels (i.e., Broad-leaved,Coniferous, and Mixed). The Exactly
operator returns images with the exact same labels as the selected
ones. This can be useful when a user is looking for very specific in-
formation, e.g. finding all airports in a provided area. The At least &
more operator retrieves images that have all the selected labels and
potentially some additional ones. For example, if a user is looking
for sea or ocean beaches located near coniferous forests, then she
is mainly interested in the labels Coniferous forest,Beaches, dunes,
sands, and Sea and ocean. However, images with some additional
labels, such as Bare rock or Coastal lagoons, could also be relevant.
Overall, thanks to its expressive operators and the easy-to-follow
hierarchical layout of the labels, EarthQube provides a powerful
tool for querying EO data based on land cover classes.
Finally, the last subsection of the query panel allows users to
upload a BigEarthNet image and search for similar images in the
archive using our deep hashing based index.
Map View. The map displays the locations of the retrieved images
as markers (zoomed-in view) and marker cluster groups (zoomed-
out view). Markers have several features, such as hovering anima-
tions, tooltips, pop-ups, and pinpointers. Specifically, hovering over
a marker changes its color and shows its labels in a tooltip, while
clicking on the marker opens a popup that contains metadata. The
pop-up also exposes a button that locates the image in the result
panel that we describe next. Furthermore, the user can choose a
set of markers to pinpoint on the map. Lastly, the bottom right of
the screen shows a minimap (see Fig. 1), which can be toggled on
or off and allows users to keep an overall perspective even when
they are zoomed into a particular area. As a next step in the visual
exploration, we allow users to render RGB images directly on the
map, as shown in Figure 2-3.
Result Panel. The result panel (right side of the map in Figure 2)
presents metadata, additional features, and label statistics regarding
the latest retrieval. It consists of two views: Image patches and Label
statistics. The top of the panel in the Image patches view shows
the total number of image patches that match the query criteria.
Furthermore, it allows users to enable image rendering on the map
(up to 1000 images), download the names of the retrieved images
as a plain text file, and add the current page range of images (up to
50) to the download cart. The cart allows users to combine images
from different searches and download them together as a single
collection. The window below displays the full list of images. Each
image has a brief description and five buttons that allow to: (i)
retrieve similar images, (ii) navigate to the image on the map, (iii)
3648

pinpoint the image, (iv) download the image as a zip, and (v) add
the image to the download cart.
The view Label statistics summarizes the occurrence of land
cover labels in the retrieved images, which is a unique feature of
EarthQube. Specifically, as shown in Figure 2-4, it consists of a bar
chart that shows the number of occurrences of each label present
in the retrieval. To facilitate the identification of dominant land
types in a given area, we map each label to a predefined color that
is representative of the land cover type.
To display the results of a similarity search, EarthQube opens
two new tabs for the image patches and label statistics, respectively.
These views are the same as described above, with the only differ-
ence that the image patches view displays the query image at the
top in addition to the retrieved similar images (see Fig. 1).
3.2 System Architecture
EarthQube follows a three-tier architecture consisting of a data tier,
a back-end server, and a user interface. As we discussed the user
interface in Section 3.1, here we focus on the remaining two tiers.
Data Tier. EarthQube uses MongoDB as a database server to store
four data collections: (i) metadata, (ii) image data, (iii) rendered
images, and (iv) user feedback. The metadata collection is central
to EarthQube as it enables efficient search and retrieval of images
based on their geospatial coordinates and other attributes. Specifi-
cally, metadata documents have a location attribute that represents
the bounding rectangle of an image and a properties attribute that
encompasses other queryable image features, such as the image
name, labels, season, and acquisition date. To improve query per-
formance, we index the location attribute using MongoDB’s built-in
2D geohashing index. Furthermore, to improve the performance of
label-based filtering, we map each (potentially multi-word) CLC
label to an ASCII character, thereby avoiding the manipulation of
long strings. The image data collection stores the actual binary
representations of the 12 bands of the BigEarthNet images. Each
document has an image patch name attribute that serves as primary
key and is automatically indexed by MongoDB. The rendered im-
ages collection contains the binary representations of the rendered
displayable images. We acquire those images by combining the
RGB bands. Finally, the collection feedback stores anonymous user-
provided text feedback, such as public reactions and comments.
Back-end Server. The back-end server provides the means to
submit geospatial queries, filter the images based on different search
criteria, and perform CBIR. To this end, EarthQube invokes different
services that validate and process the user query.
3.3 Integrating with MiLaN
To provide the CBIR functionality, we infer a 128-bit binary hash
code for each image in the BigEarthNet archive using MiLaN (see
Section 2.2). EarthQube supports both querying by an existing
archive image and by an external one. To perform a similarity
search based on an archive image, we maintain an in-memory hash
table that maps each image patch name to the corresponding binary
code. For queries based on an external image, the deep learning
model produces a binary code for the query on-the-fly. Given the
binary code of the query image, EarthQube retrieves all images
with binary codes within a small hamming radius. Finally, the back-
end server further processes the retrieved images before displaying
them on the user interface.
4 DEMONSTRATION
Visitors can: (i) interact with the BigEarthNet satellite images
through our unified, easy-to-use dashboard, and (ii) select or up-
load satellite images to search for similar satellite images backed
by machine learning methods. They can also explore Europe and
its land cover through querying and visualizing satellite images. In
particular, visitors will play the following scenarios:
Label-based Exploration. Visitors can search for industrial areas
adjacent to inland water bodies using the label filtering functionality
to detect possible water pollution by industrial waste in 10 different
European countries. By inspecting the label statistics view, visitors
can discover other land cover classes that fit the query description.
They may then find out that certain areas include land principally
occupied by agriculture whose irrigation may come from nearby
polluted water bodies.
Spatial Exploration and Query-by-Existing-Example. Visitors
can search for urban areas or vegetation in 10 European countries
that are typical of a certain region. For example, visitors can submit
a geospatial query covering the southwestern tip of Portugal. Then,
they can visualize the images in the query area using the render
functionality. Finally, they can select an image and perform content-
based image retrieval to display similar images in the 10 countries.
Query-by-New-Example. Sentinel satellites constantly collect
new images of earth’s surface. Unfortunately, these newly collected
images do not have any land cover class labels in the metadata.
Therefore, visitors can upload such images to EarthQube to search
for other images with similar semantic content. Based on the seman-
tic search results, one could design an automatic labeling process.
ACKNOWLEDGMENTS
This work is funded by the European Research Council through the ERC-
2017-STG BigEarth Project (Grant 759764) and the German Ministry for
Education & Research as BIFOLD - Berlin Institute for the Foundations of
Learning & Data (ref. 01IS18025A and 01IS18037A).
REFERENCES
[1]
[n.d.]. DIAS Platforms. Retrieved March 15, 2022 from https://www.copernicus.
eu/en/access-data/dias
[2]
Arne de Wall, Björn Deiseroth, Eleni Tzirita Zacharatou, Jorge-Arnulfo Quiané-
Ruiz, Begüm Demir, and Volker Markl. 2021. Agora-EO: A Unified Ecosystem for
Earth Observation – A Vision for Boosting EO Data Literacy –. In Proc. Big Data
from Space (BiDS).
[3]
Subhankar Roy, Enver Sangineto, Begüm Demir, and Nicu Sebe. 2021. Metric-
Learning-Based Deep Hashing Network for Content-Based Retrieval of Remote
Sensing Images. IEEE Geoscience and Remote Sensing Letters 18, 2 (2021), 226–230.
[4]
Gencer Sumbul, Arne de Wall, Tristan Kreuziger, Filipe Marcelino, Hugo Costa, Pe-
dro Benevides, Mário Caetane, Begüm Demir, and Volker Markl. 2021. BigEarthNet-
MM: A Large-Scale, Multimodal, Multilabel Benchmark Archive for Remote Sens-
ing Image Classification and Retrieval. IEEE GRSS Magazine 9, 3 (2021), 174–180.
[5]
G. Sumbul, J. Kang, and B. Demir. 2021. Deep Learning for Image Search and
Retrieval in Large Remote Sensing Archives. In Deep Learning for the Earth Sciences:
A Comprehensive Approach to Remote Sensing, Climate Science and Geosciences.
John Wiley & Sons, Hoboken, NJ, USA, Chapter 11, 150–160.
[6]
Jonas Traub, Zoi Kaoudi, Jorge-Arnulfo Quiané-Ruiz, and Volker Markl. 2020.
Agora: Bringing Together Datasets, Algorithms, Models and More in a Unified
Ecosystem [Vision]. SIGMOD Rec. 49, 4 (2020), 6–11.
3649
Loading more pages...