fnut-09-808346 May 18, 2022 Time: 6:47 # 1
ORIGINAL RESEARCH
published: 19 May 2022
doi: 10.3389/fnut.2022.808346
Edited by:
Tyler A. Churchward-Venne,
McGill University, Canada
Reviewed by:
Patrick Tso,
University of Cincinnati, United States
Hidetaka Hamasaki,
Hamasaki Clinic, Japan
Errol Marliss,
McGill University, Canada
*Correspondence:
Jiudan Zhang
Andreas F. H. Pfeiffer
Specialty section:
This article was submitted to
Nutrition and Metabolism,
a section of the journal
Frontiers in Nutrition
Received: 03 November 2021
Accepted: 27 April 2022
Published: 19 May 2022
Citation:
Zhang J, Pivovarova-Ramich O,
Kabisch S, Markova M,
Hornemann S, Sucher S, Rohn S,
Machann J and Pfeiffer AFH (2022)
High Protein Diets Improve Liver Fat
and Insulin Sensitivity by Prandial but
Not Fasting Glucagon Secretion
in Type 2 Diabetes.
Front. Nutr. 9:808346.
doi: 10.3389/fnut.2022.808346
High Protein Diets Improve Liver Fat
and Insulin Sensitivity by Prandial but
Not Fasting Glucagon Secretion in
Type 2 Diabetes
Jiudan Zhang1*, Olga Pivovarova-Ramich1,2,3, Stefan Kabisch1,2,3, Mariya Markova2,3,
Silke Hornemann2,3, Stephanie Sucher2, Sascha Rohn4,5, Jürgen Machann3,6,7 and
Andreas F. H. Pfeiffer1,3*
1Department of Endocrinology, Diabetes and Nutrition, Charité – Universitätsmedizin Berlin, Berlin, Germany, 2Department
of Clinical Nutrition, German Institute of Human Nutrition Potsdam-Rehbruecke (DIfE), Potsdam, Germany, 3Deutsches
Zentrum für Diabetesforschung (DZD), Neuherberg, Germany, 4Hamburg School of Food Science, Institute of Food
Chemistry, University of Hamburg, Hamburg, Germany, 5Faculty of Process Sciences, Institute of Food Technology
and Food Chemistry, Technical University of Berlin, Berlin, Germany, 6Section on Experimental Radiology, Department of
Diagnostic and Interventional Radiology, University Hospital, Tübingen, Germany, 7Institute for Diabetes Research and
Metabolic Diseases (IDM) of the Helmholtz Center Munich at the University of Tübingen, Tübingen, Germany
Glucagon (GCGN) plays a key role in glucose and amino acid (AA) metabolism
by increasing hepatic glucose output. AA strongly stimulate GCGN secretion which
regulates hepatic AA degradation by ureagenesis. Although increased fasting GCGN
levels cause hyperglycemia GCGN has beneficial actions by stimulating hepatic lipolysis
and improving insulin sensitivity through alanine induced activation of AMPK. Indeed,
stimulating prandial GCGN secretion by isocaloric high protein diets (HPDs) strongly
reduces intrahepatic lipids (IHLs) and improves glucose metabolism in type 2 diabetes
mellitus (T2DM). Therefore, the role of GCGN and circulating AAs in metabolic
improvements in 31 patients with T2DM consuming HPD was investigated. Six weeks
HPD strongly coordinated GCGN and AA levels with IHL and insulin sensitivity as shown
by significant correlations compared to baseline. Reduction of IHL during the intervention
by 42% significantly improved insulin sensitivity [homeostatic model assessment for
insulin resistance (HOMA-IR) or hyperinsulinemic euglycemic clamps] but not fasting
GCGN or AA levels. By contrast, GCGN secretion in mixed meal tolerance tests
(MMTTs) decreased depending on IHL reduction together with a selective reduction of
GCGN-regulated alanine levels indicating greater GCGN sensitivity. HPD aligned glucose
metabolism with GCGN actions. Meal stimulated, but not fasting GCGN, was related to
reduced liver fat and improved insulin sensitivity. This supports the concept of GCGN-
induced hepatic lipolysis and alanine- and ureagenesis-induced activation of AMPK by
HPD.
Keywords: glucagon, insulin sensitivity, liver fat content, alanine, type 2 diabetes, non-alcoholic fatty liver disease
(NAFLD), high protein diet
Frontiers in Nutrition | www.frontiersin.org 1May 2022 | Volume 9 | Article 808346

fnut-09-808346 May 18, 2022 Time: 6:47 # 2
Zhang et al. Glucagon and Fatty Liver Disease
INTRODUCTION
Glucagon (GCGN) increases glucose production in the liver,
stimulates insulin release from beta cells and contributes to
maintaining normal levels of glucose in a close interplay
with insulin in healthy subjects (1,2). Hyperglucagonemia
was proposed as an early driver of hyperglycemia and as an
initial step in the pathogenesis of type 2 diabetes mellitus
(T2DM) (3,4) although the causes of hyperglucagonemia
remain controversial (5). Insulin resistance of the alpha-cell
was proposed to impair the inhibition of glucagon secretion by
insulin and may thereby increase GCGN levels (3). Glucagon
release is directly and acutely stimulated by amino acids (AA)
(6) and drives their hepatic degradation in the urea cycle (7,8),
which generates a liver-alpha-cell feedback loop. Non-alcoholic
fatty liver disease (NAFLD) is a frequent consequence of obesity
and associated with increased levels of AA (9) which was
proposed to result from fatty liver-induced hepatic resistance
to the GCGN-induced degradation of AA. The ensuing hyper-
aminoacidemia may in turn stimulate GCGN-release and induce
fasting and postprandial hyperglucagonemia in obesity and
diabetes mellitus. The increase of fasting GCGN is thought to
increase glucose production and to induce hyperinsulinemia
which will further aggravate NAFLD and insulin resistance (10).
The product of GCGN and alanine was recently proposed as an
indicator of hepatic GCGN resistance and was associated with
hepatic fat content (11). Fatty liver is closely linked to insulin
resistance and increased levels of AAs, such that the overlap
and interdependence of both phenomena make it difficult to
separate the causes.
Although GCGN antagonists reduced blood glucose levels in
T2DM patients they increased hepatic transaminases, induced
fatty liver and dyslipidemia (5,12–14). This raised awareness of
the positive actions of GCGN such as the induction of lipolysis
and lipid oxidation, inhibition of appetite and increase in energy
expenditure (5,15,16). Moreover, recent work unraveled an
important role of intra-islet GCGN release from alpha cells in
maintaining beta cell responses (5,17,18). This work was backed
by the development of GCGN agonists in peptide polyagonists
combining GCGN, GLP-1, and/or GIP to treat T2DM (5). As
AAs are potent inducers of GCGN secretion, high protein diets
(HPDs) might be used to increase GCGN release and thereby
profit from its benefits (16). Indeed, we recently tested HPDs
without restriction of calorie intake in patients with T2DM and
observed improvements of insulin sensitivity, hepatic fat content,
circulating fatty acids, uric acid, and markers of inflammation
and redox metabolism (19–23).
This raises the question, whether (a) fatty liver is quantitatively
linked to fasting glucagon secretion and hepatic GCGN
resistance in T2DM as reflected by elevated fasting AA
and the GCGN–alanine index and (b), whether a reduction
of liver fat would improve the hepatic GCGN resistance
in people with T2DM as might be expected if NAFLD
is a primary cause of hyperglucagonemia. As NAFLD is
also closely linked to insulin resistance, the reduction of
liver fat should improve alpha-cell insulin sensitivity and
may thereby reduce fasting and postprandial GCGN release.
Because alpha-cell-GCGN-stimulated insulin secretion is largely
mediated by GLP-1 receptors, GCGN-resistance might not alter
the response to protein- and AA intake-induced insulin secretion
in mixed meal tolerance tests (MMTTs).
A second aspect arises from potential beneficial effects
of GCGN in obesity and T2DM: GCGN specifically drives
intrahepatic lipolysis and lipid oxidation through a recently
discovered inositol trisphosphate-receptor-1 (INSP3-R1)
dependent signal pathway and thereby is a powerful stimulus
to reduce liver fat (24). Preclinical studies moreover suggest a
centrally mediated inhibition of hepatic lipogenesis by GCGN
(16). Indeed, isocaloric HPDs which strongly stimulate GCGN
release, have been used to reduce liver fat in patients with T2DM
by over 40% which most likely was mediated by the increase
in GCGN-induced hepatic lipolysis (19,20). This raises the
question whether GCGN resistance of the liver would impair the
action of GCGN and thereby serve as a marker of the prospective
effectiveness of HPD for the reduction of liver fat in people
with NASH/NAFLD.
This analysis was performed to assess the interplay of
intrahepatic lipids (IHLs) with plasma levels of GCGN and
hepatic GCGN-resistance in study participants with T2DM
before and after extensive loss of liver fat achieved by the intake of
HPDs (30%E of protein) for 6 weeks. We assessed whether there
is (a) a correlation of IHL with insulin sensitivity and GCGN
resistance determined by the GCGN–alanine index at baseline
and after the intervention, (b) whether an extensive reduction of
IHL by isocaloric HPD affects insulin or GCGN sensitivity, (c)
whether GCGN sensitivity at baseline determines the effect of the
HPD on loss of IHL, and whether (d) GCGN sensitivity affects
the secretion of insulin induced by a mixed meal, i.e., whether the
ultra-short loop feedback between alpha- and beta-cells changes.
MATERIALS AND METHODS
The analysis is based on the “LeguAN” intervention trial
in subjects (18–80 years) with T2DM, which was registered
at ClinicalTrials.gov (NCT02402985). Participants with orally
treated T2DM, matched for age, sex, body mass index
(BMI), glycated hemoglobin A1c (HbA1c), and anti-diabetic
medications, were randomized using computer algorithm to
6 weeks of isocaloric diets which contained 30% of energy
intake (%E) as protein, 40%E as carbohydrates, and 30%E as
fat (20). All participants received individually adapted dietary
instructions and meal plans by an experienced dietician and
Master in Nutrition (SS) and were partially supplied with foods
during the 6 weeks. The overall composition of SAFA (10%E),
MUFA (10%E), and PUFA (10%E) was kept similar as much as
possible and dietary intake was calculated with the computer
program PRODI as described in detail in the supplements of
refs (19,20). The study participants completed MMTTs before
and at the end of the study which consisted of breakfast
(MMTT1) and lunch (MMTT2) with detailed profiles of insulin,
GCGN, glucose, and AA over 360 min. The original study
compared plant vs. animal protein rich diets which showed
similar improvements of IHL, insulin sensitivity, fasting glucose,
Frontiers in Nutrition | www.frontiersin.org 2May 2022 | Volume 9 | Article 808346

fnut-09-808346 May 18, 2022 Time: 6:47 # 3
Zhang et al. Glucagon and Fatty Liver Disease
HbA1c, visceral adipose tissue (VAT), inflammatory, liver, and
redox markers ref (19–23). The groups were therefore combined
in the current analysis. The separation into two groups with
changes of liver fat above vs. below the median comprised
animal/plant protein of 7/8 in the higher and 9/7 in the lower
liver fat change groups. Changes of protein intakes, blood
urea nitrogen (BUN) and urinary nitrogen excretion relative
to changes in IHL, GCGN, and homeostatic model assessment
for insulin resistance (HOMA-IR) are shown in Supplementary
Figures 2–4. The free fatty acid (FFA) in serum showed a decrease
of all saturated fatty acids (C14–C22), no change of linoleic
acid and a small increase of alpha-linoleic acid as reported
previously (20). All subjects signed informed consent prior to
participation. A total of 31 subjects were included who performed
proton magnetic resonance spectroscopy (1H-MRS) of the liver
and MRI for VAT on a 1.5 T whole body imager (Magnetom
Avanto, Siemens Healthcare, Erlangen, Germany) at baseline
and after 6-weeks of high-protein dietary intervention (19–21).
Body composition (fat mass and lean mass) was determined
by Air Displacement Plethysmography (BOD POD, COSMED,
Italy). Routine parameters were measured in serum using ABX
Pentra 400 (Horiba, Japan). Insulin and glucagon in serum
samples were measures by ELISA (Mercodia, Sweden). Plasma
AA levels were determined by liquid chromatography tandem
mass spectrometry analysis.
Calculations
Index of whole-body insulin resistance (HOMA-IR) was
calculated as: fasting insulin (mU/L) ×fasting glucose in
(mmol/L)/22.5 (25). Matsuda index was calculated according to
Matsuda and DeFronzo (26).
The GCGN–alanine index and the GCGN–AA-index
were calculated as fasting glucagon ×fasting alanine or
other AA, respectively, according to the previous publication
(12). The glucose disposal rate (M-value) was calculated
from the infusion rate of exogenous glucose during steady
state of the hyperinsulinemic euglycemic clamp (HEC) as
previously described.
Statistical Analysis
For statistical analysis, all variables are described as mean ±SD.
Normal distribution was evaluated by Shapiro–Wilk-test.
According to the normal or non-normal distribution, statistical
comparison of variables at baseline and after 6-weeks high
protein intervention between two groups was performed by
independent t-test or Mann–Whitney U-test; Paired t-test
or Wilcoxon signed rank test was used within groups. The
repeated measures ANOVA was used to analyze differences at
different time-points.
For correlation analysis, non-normally distributed data
(GCGN–AA index, IHL, and HOMA-IR) were logarithmically
transformed to approximate a linear distribution. Spearman’s
non-parametric rank or Pearson correlations were conducted
depending on the normality of data distribution. Areas under
the curve (AUC) and incremental areas under the curve (iAUC)
were calculated by GraphPad prism 8 (CA, United States) using
the trapezoid rule.
Ap-value <0.05 was considered statistically significant. All
statistical calculations were performed using SPSS 26.0 (IBM,
United States). All graphs were generated by GraphPad prism 8
(CA, United States).
RESULTS
We studied 31 study participants with orally treated T2DM
whose characteristics are shown in Table 1. The intrahepatic lipid
content (IHL) was 15.4 ±9.8% determined by 1H-MRS and
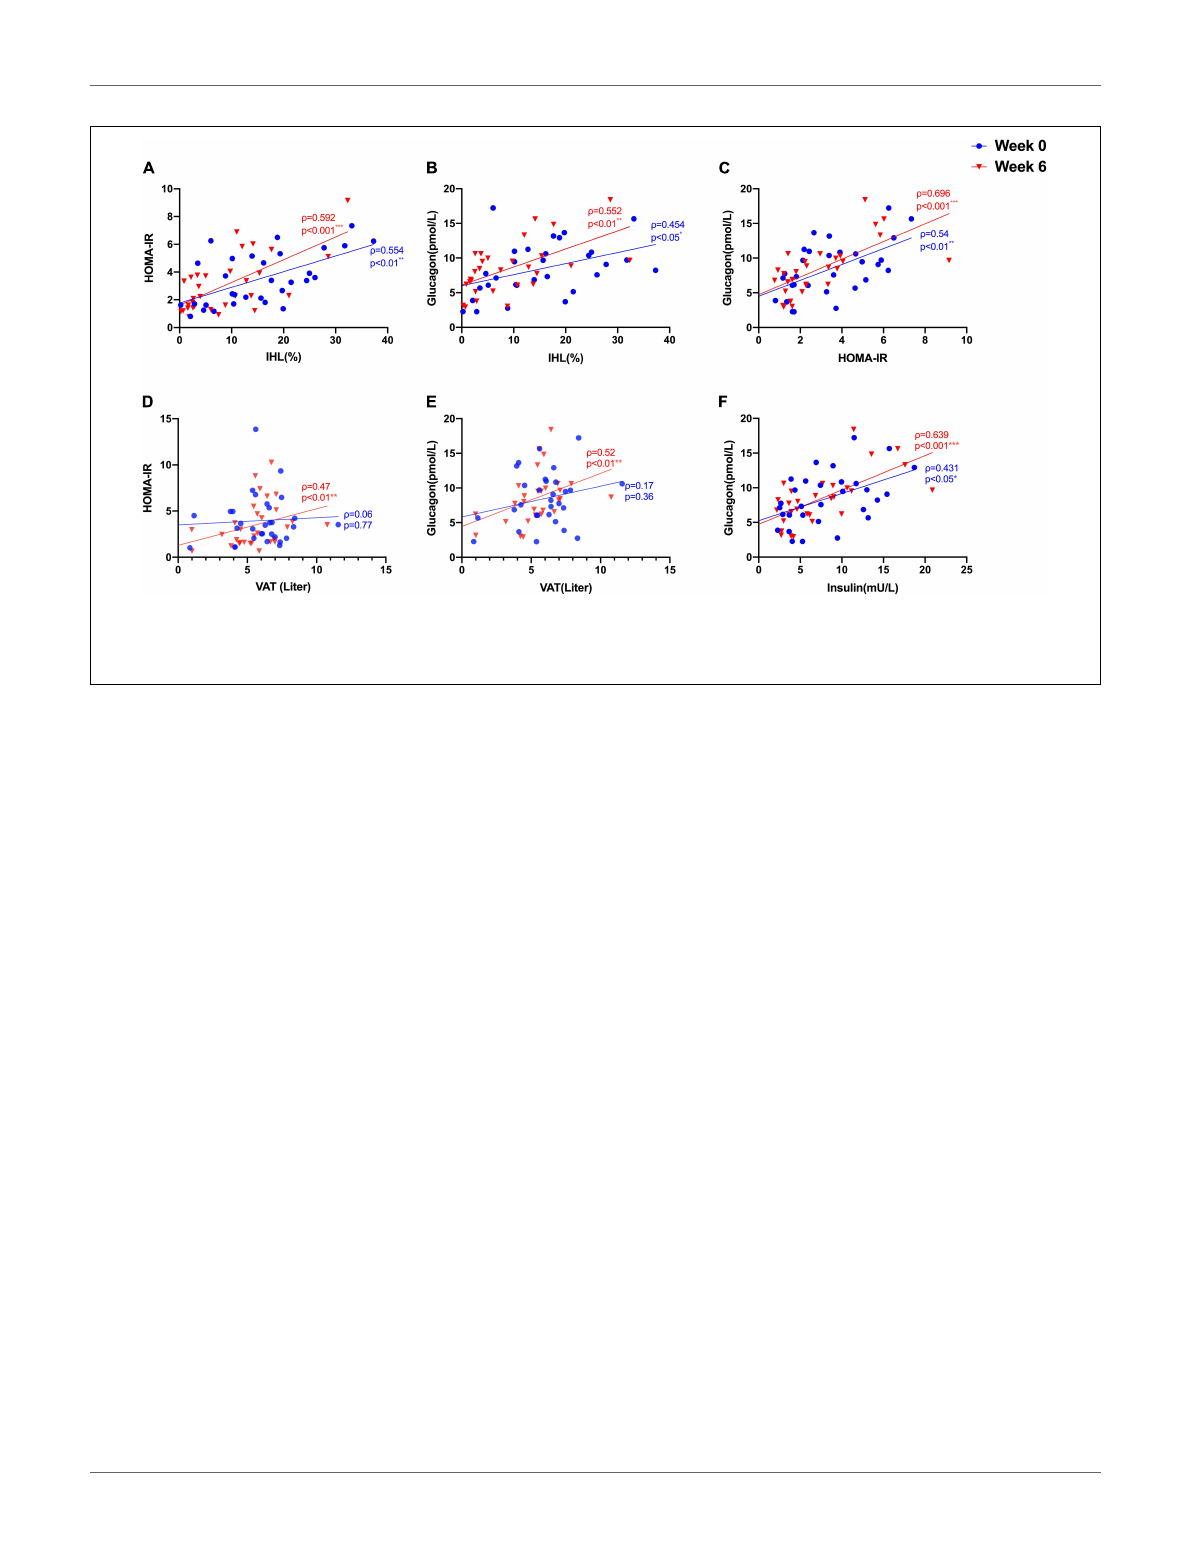
correlated highly with insulin sensitivity measured as HOMA-IR
(ρ= 0.554, p= 0.001) (Figure 1A) and with fasting GCGN levels
(ρ= 0.454, p= 0.012) (Figure 1B). VAT, determined by MRI,
TABLE 1 | Parameters at baseline (Week 0) and after the HPD intervention of all
study participants (Week 6).
Parameter (n= 31) Week 0 Week 6 p-Value
Age (years) 64.6 ±6.0
Gender (male/female) 19 m/12 f
Liver fat content (MR-S; %) 15.4 ±9.8 8.8 ±8.1 <0.001***
Body weight (kg) 89.4 ±14.2 87.4 ±14.0 <0.001***
BMI (kg/m2) 30.6 ±3.7 29.9 ±3.5 <0.001***
Waist circumference (cm) 102.9 ±10.9 100.6 ±10.7 <0.01**
Fasting glucose (mmol/L) 9.6 ±1.5 8.8 ±1.5 <0.001***
Fasting insulin (mU/L) 8.4 ±4.7 7.9 ±5.4 0.16
Fasting glucagon (pmol/L) 8.2 ±3.5 8.4 ±3.7 0.63
Fasting C-P (µg/L) 1.9 ±0.8 1.9 ±0.9 0.40
Insulin/glucagon ratio 1.1 ±0.72 0.89 ±0.42 0.056
C-P/glucagon ratio 0.27 ±0.17 0.23 ±0.08 0.23
iAUC glucagon (pmol/L) 992.1 ±577.4 829.3 ±502.3 0.313
HbA1c 6.8 ±0.70 6.4 ±0.69 <0.001***
HOMA-IR 3.5 ±1.9 3.1 ±2.0 <0.05*
Matsuda index 4.5 ±3.1 5.0 ±2.9 <0.05*
M-value 4.9 ±2.1 5.5 ±1.9 <0.01**
AST (U/L) 25.2 ±8.7 21.8 ±6.1 <0.01**
ALT (U/L) 28.2 ±9.9 26.5 ±8.4 0.13
AST/ALT ratio 0.87 ±0.21 0.84 ±0.19 0.54
GGT (U/L) 44.1 ±26.2 30.8 ±15.9 <0.001***
TG (mmol/L) 1.7 ±0.59 1.6 ±0.66 0.22
TC (mmol/L) 5.3 ±0.97 4.62 ±0.95 <0.01**
LDL-C (mmol/L) 3.4 ±0.89 2.9 ±0.85 <0.01**
HDL-C (mmol/L) 1.1 ±0.26 0.96 ±0.17 <0.01**
CREA (µmol/L) 81.3 ±16.2 77.5 ±16.7 <0.05*
BUN (mmol/L) 6.0 ±0.95 7.8 ±1.8 <0.001***
eGFR (mL/min/1.73 m2) 78.6 ±15.2 82.6 ±15.2 <0.05*
Urine urea (mmol/24 h) 403.0 ±134.2 564.0 ±200.2 <0.001***
VAT (L) 6.0 ±2.1 5.8 ±1.9 <0.01**
Fat mass (%) 35.8 ±7.3 33.9 ±7.0 <0.05*
Lean mass (%) 64.0 ±7.3 66.2 ±7.0 <0.05*
BMI, body mass index; C-P, C-peptide; iAUC, incremental area under curve;
HbA1c, glycated hemoglobin A1c; HOMA-IR, homeostatic model assessment for
insulin resistance; AST, aspartate aminotransferase; ALT, alanine aminotransferase;
GGT, gamma-glutamyl transferase; TG, triglycerides; TC, total cholesterol; CREA,
creatinine; BUN, blood urea nitrogen; eGFR, estimated glomerular filtration rate;
VAT, visceral adipose tissue. *p <0.05; **p <0.01; ***p <0.001.
Frontiers in Nutrition | www.frontiersin.org 3May 2022 | Volume 9 | Article 808346
fnut-09-808346 May 18, 2022 Time: 6:47 # 4
Zhang et al. Glucagon and Fatty Liver Disease
FIGURE 1 | Correlations between (A) IHL (%) and insulin sensitivity (HOMA-IR); (B) IHL (%) and GCGN; (C) HOMA-IR and GCGN; (D) visceral adipose tissue (VAT)
and HOMA-IR; (E) VAT and GCGN; (F) correlations between fasting insulin and GCGN before (Week 0, blue) and after high protein intake intervention in the entire
study group (Week 6, red). *p<0.05; **p<0.01; ***p<0.001.
did not correlate with GCGN (ρ= 0.17, p= 0.36) (Figure 1E).
The intervention resulted in markedly reduced liver fat content
by 6.6%, slightly but significantly reduced VAT and significant
improvements of HbA1c, fasting glucose, and insulin sensitivity
(HOMA-IR, Matsuda index, and M-value) (Table 1) (19,20). The
levels of fasting GCGN did not change significantly (Table 1).
Correlation of Glucagon,
Glucagon–Alanine Index, and Insulin
Sensitivity With Intrahepatic Lipid and
Visceral Adipose Tissue
Glucagon levels correlated with IHL and insulin sensitivity before
and after the intervention (Figures 1B,C) and with VAT after
the intervention (ρ= 0.52, p= 0.004) (Figure 1D). In order
to assess hepatic GCGN sensitivity, we calculated the GCGN–
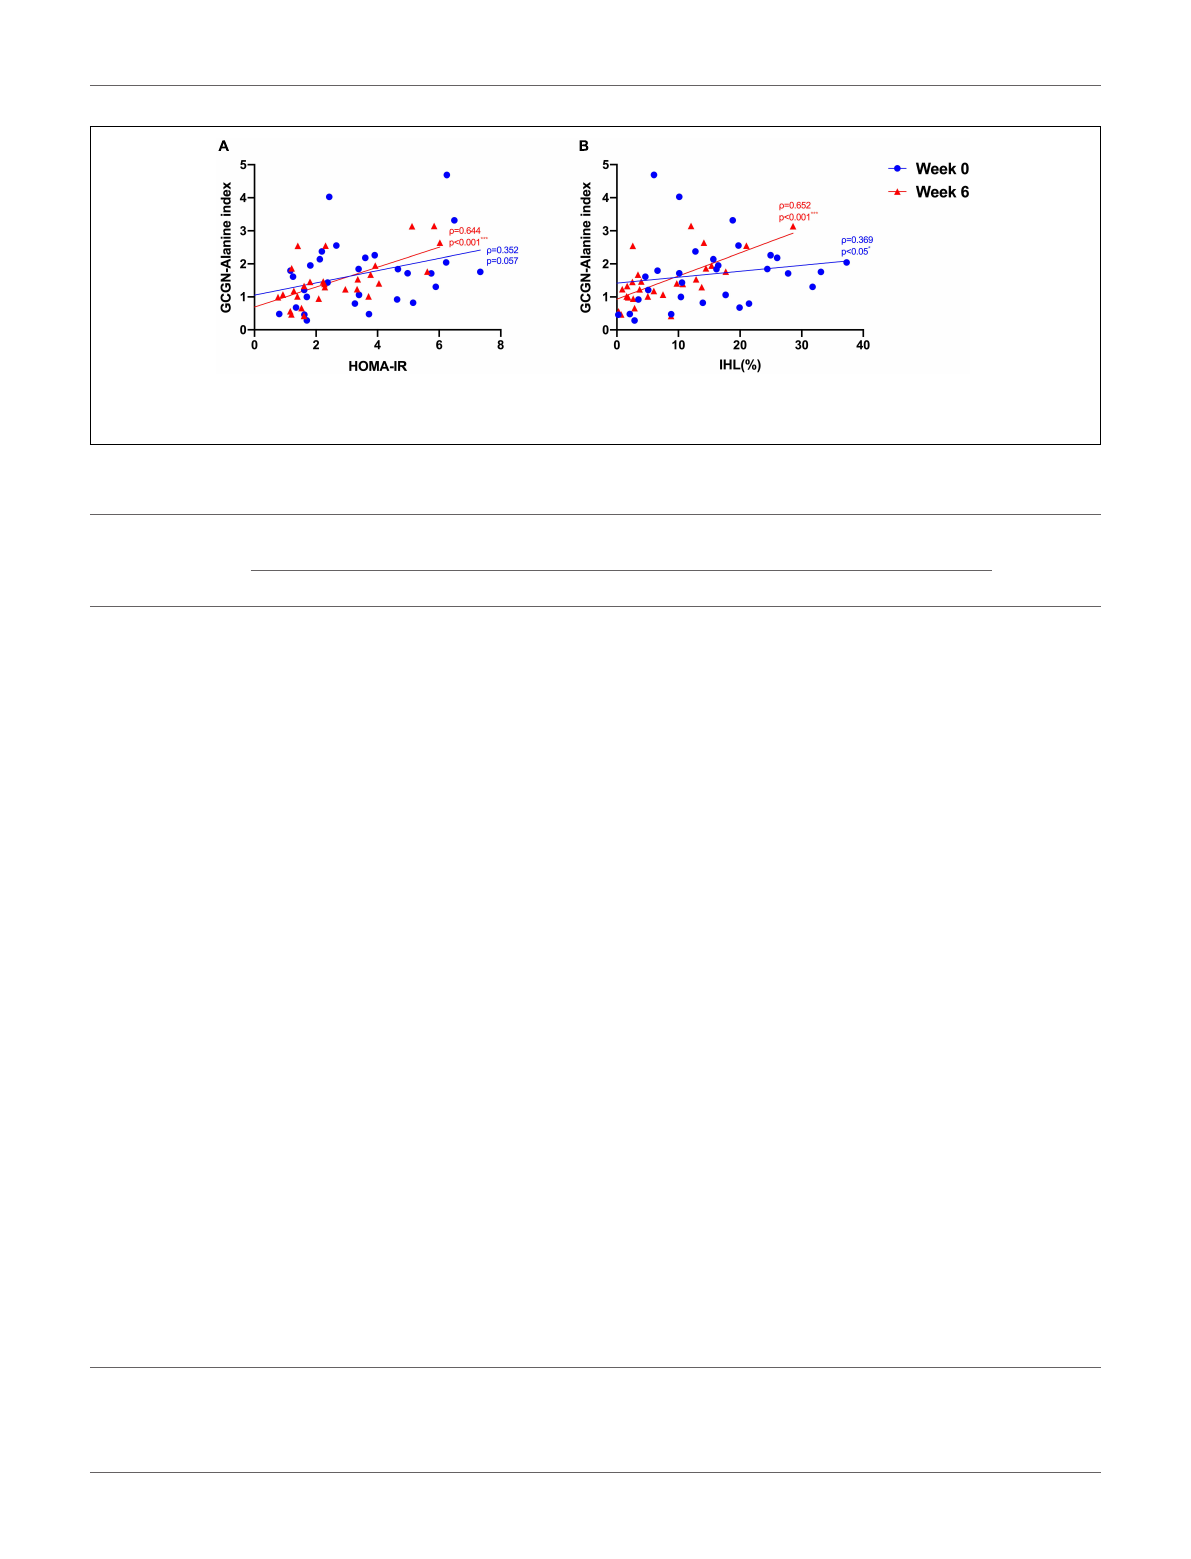
alanine index as proposed (12) which correlated modestly with
IHL at baseline (ρ= 0.369, p<0.05). Insulin sensitivity calculated
by HOMA-IR correlated trendwise and non-significantly with
the GCGN–alanine index at baseline (ρ= 0.352, p= 0.057)
(Figure 2A). Remarkably, the correlations of the GCGN–alanine
index became highly significant upon the high protein intake for
6 weeks for IHL (ρ= 0.652, p<0.001) (Figure 2B) and for insulin
sensitivity (ρ= 0.644, p<0.001) (Figure 2A). Similarly, increased
correlations were observed between GCGN–alanine index and
BCAA, glutamine, or histidine as well as between total AAs and
with IHL or HOMA-IR (Supplementary Table 3). The intake
of the high-protein diet thus greatly increased the alignment of
GCGN and AA as reflected by their increasing correlation with
liver fat and insulin sensitivity.
Improvements of Insulin Sensitivity Upon
Reduction of Liver Fat Are Dissociated
From Changes of the Glucagon–Alanine
Index
Glucagon is likely a key player in the protein-induced reduction
of liver fat by high protein intake (24). The reductions of liver fat
in our study showed large differences between individuals. We
therefore hypothesized that these differences might be related to
hepatic GCGN resistance resulting in impaired GCGN-induced
hepatic lipolysis and induction of ureagenesis.
We therefore analyzed the participants according to changes
above or below the median of liver fat change. This resulted
in a significant difference of liver fat reduction between the
groups although baseline levels of IHL did not differ significantly
(Table 2). The lesser liver fat reduction group shifted from 17.4
to 12.7% IHL and thus maintained a high liver fat content even
after the relative reduction by 27%. The greater liver fat reduction
group decreased IHL by 65% from 13.3 to 4.6 ±3.8% and thus –
in average – below the defined threshold of fatty liver of 5.56%
IHL. The modest reduction of weight and waist circumference
was around 2 kg and 2 cm, respectively, identical in both groups
as were modest reductions of visceral and total adipose tissue and
modest increases in muscle mass (Table 2).
Fasting glucose decreased significantly in both groups while
fasting insulin decreased significantly in the greater liver fat
reduction group only. Fasting GCGN did not change significantly
in either group. Insulin sensitivity expressed by HOMA-IR,
Matsuda index, or M-value improved significantly in the group
with greater IHL reduction but not in the lesser IHL-reduction
group resulting in a significant difference between the groups.
Frontiers in Nutrition | www.frontiersin.org 4May 2022 | Volume 9 | Article 808346
fnut-09-808346 May 18, 2022 Time: 6:47 # 5
Zhang et al. Glucagon and Fatty Liver Disease
FIGURE 2 | Correlations between (A) GCGN–alanine index and HOMA-IR; (B) GCGN–alanine index and IHL (%) before (Week 0, blue) and after the intervention in
the entire study group (Week 6, red). *p<0.05; ***p<0.001.
TABLE 2 | Parameters at baseline (Week 0) and after HPD intervention (Week 6) of study participants with lower (below median) and higher (above median) reduction of
intrahepatic lipid content (IHL).
Parameter Lower liver fat reduction (n= 16)
below median
Higher liver fat reduction (n= 15)
above median
pweek 6 vs
week 0
Week 0 Week 6 pWeek 0 Week 6 p
Age (years) 63.0 ±5.7 66.3 ±6.0
Gender (male/female) 8 m/8 f 11 m/4 f
Liver fat content (MR-S; %) 17.4 ±10.7 12.7 ±9.2 <0.001*** 13.3 ±8.6 4.6 ±3.8 <0.001*** <0.05*
Body weight (kg) 89.0 ±14.0 86.7 ±13.6 <0.001*** 89.6 ±15.6 86.8 ±15.4 <0.001*** 0.96
BMI (kg/m2) 31.0 ±4.1 30.2 ±4.0 <0.001*** 30.2 ±3.3 29.5 ±3.1 <0.001*** 0.96
Waist circumference (cm) 102.5 ±10.4 100.7 ±10.3 0.07 103.2 ±11.8 100.6 ±11.5 <0.01** 0.54
Fasting glucose (mmol/L) 9.3 ±1.0 8.8 ±1.1 <0.05* 10.0 ±1.8 8.9 ±1.8 <0.01** 0.12
Fasting insulin (mU/L) 8.4 ±4.9 8.9 ±6.4 0.28 8.3 ±4.6 6.9 ±4.1 <0.05* <0.05*
Fasting glucagon (pmol/L) 8.2 ±3.2 9.2 ±4.0 0.24 8.7 ±4.5 7.6 ±3.4 0.51 0.18
Fasting C-P (ug/L) 1.9 ±0.9 1.9 ±1.0 0.59 1.8 ±0.8 1.7 ±0.8 0.07 0.11
AUC insulin (MMT1) 8915.3 ±6880.0 9039.2 ±7201.4 0.75 10163.1 ±6425.7 8503.3 ±4852.5 <0.05* <0.05*
AUC insulin (MMT2) 6322.0 ±4262.6 5923.3 ±3508.7 0.14 6062.9 ±4109.5 4926.7 ±2844.5 0.06 0.35
AUC glucagon (MMT1) 2917.4 ±869.5 3051.3 ±1018.9 0.35 2925.1 ±1004.8 2672.3 ±1046.9 <0.05* 0.08
AUC glucagon (MMT2) 2988.1 ±829.9 2755.9 ±831.8 0.08 2651.7 ±1089.3 2439.4 ±1181.6 0.08 0.98
HbA1c 6.7 ±0.54 6.3 ±0.47 <0.01** 7.0 ±0.81 6.6 ±0.84 <0.05* 0.80
HOMA-IR 3.4 ±1.9 3.4 ±2.4 0.77 3.6 ±2.0 2.6 ±1.5 <0.01** <0.05*
Matsuda index 4.8 ±3.7 4.7 ±2.9 0.72 4.2 ±2.5 5.4 ±3.0 <0.01** <0.05*
M-value 5.0 ±2.4 5.3 ±2.0 0.28 4.8 ±1.8 5.8 ±1.7 <0.01** 0.11
AST (U/L) 26.4 ±9.7 21.8 ±5.8 <0.05* 24.0 ±7.7 21.7 ±6.5 0.16 0.34
ALT (U/L) 29.9 ±12.7 27.8 ±9.4 0.15 26.4 ±5.5 25.1 ±7.2 0.48 0.42
AST/ALT ratio 0.88 ±0.24 0.82 ±0.16 0.61 0.87 ±0.18 0.86 ±0.22 0.81 0.67
GGT (U/L) 48.4 ±23.6 36.0 ±17.9 <0.001*** 39.5 ±28.7 25.2 ±11.5 <0.05* 0.81
TG (mmol/L) 1.7 ±0.54 1.8 ±0.74 0.33 1.7 ±0.66 1.4 ±0.52 <0.05* <0.05*
TC (mmol/L) 5.2 ±0.88 4.8 ±1.0 <0.01** 5.4 ±1.1 4.5 ±0.88 <0.001*** <0.05*
LDL-c (mmol/L) 3.3 ±0.86 3.0 ±0.91 <0.05* 3.5 ±0.94 2.9 ±0.82 <0.01** 0.58
HDL-c (mmol/L) 1.1 ±0.27 0.95 ±0.14 <0.01** 1.2 ±0.27 0.96 ±0.21 <0.001*** 0.18
Creatinine (µmol/L) 82.6 ±17.5 79.9 ±18.5 0.41 79.9 ±15.2 74.9 ±14.7 <0.05* 0.49
BUN (mmol/L) 6.0 ±1.0 7.8 ±1.7 <0.01** 5.9 ±0.94 7.8 ±1.9 <0.01** 0.38
eGFR (mL/min/1.73 m2) 77.1 ±16.1 80.2 ±15.9 0.38 80.3 ±14.6 85.1 ±14.6 <0.05* 0.61
Urine urea (mmol/day) 377.6 ±79.3 507.6 ±158.5 <0.01** 430.4 ±175.0 624.7 ±227.9 <0.01** <0.05*
VAT (L) 6.0 ±2.2 5.6 ±2.1 <0.01** 5.9 ±2.1 5.5 ±1.9 0.12 0.92
Fat mass (%) 36.4 ±9.0 34.8 ±8.9 <0.01** 35.2 ±4.9 32.6 ±3.8 0.11 0.52
Lean mass (%) 63.6 ±9.0 65.2 ±8.9 <0.01** 64.8 ±4.9 67.4 ±3.8 0.11 0.52
BMI, body mass index; C-P, C-peptide; HbA1c, glycated hemoglobin A1c; HOMA-IR, homeostatic model assessment for insulin resistance; AST, aspartate
aminotransferase; ALT, alanine aminotransferase; GGT, gamma-glutamyl transferase; TG, triglycerides; TC, total cholesterol; CREA, creatinine; BUN, blood urea nitrogen;
eGFR, estimated glomerular filtration rate. *p <0.05; **p <0.01; ***p <0.001.
Frontiers in Nutrition | www.frontiersin.org 5May 2022 | Volume 9 | Article 808346
Loading more pages...