
metals
Article
Process Induced Preheating in Laser Powder Bed Fusion
Monitored by Thermography and Its Influence on the
Microstructure of 316L Stainless Steel Parts
Gunther Mohr 1,2,*, Konstantin Sommer 1,3, Tim Knobloch 1,2, Simon J. Altenburg 1, Sebastian Recknagel 1,
Dirk Bettge 1and Kai Hilgenberg 1
Citation: Mohr, G.; Sommer, K.;
Knobloch, T.; Altenburg, S.J.;
Recknagel, S.; Bettge, D.; Hilgenberg,
K. Process Induced Preheating in
Laser Powder Bed Fusion Monitored
by Thermography and Its Influence
on the Microstructure of 316L
Stainless Steel Parts. Metals 2021,11,
1063. https://doi.org/10.3390/met
11071063
Academic Editor: Sergey N. Grigoriev
Received: 7 June 2021
Accepted: 29 June 2021
Published: 1 July 2021
Publisher’s Note: MDPI stays neutral
with regard to jurisdictional claims in
published maps and institutional affil-
iations.
Copyright: © 2021 by the authors.
Licensee MDPI, Basel, Switzerland.
This article is an open access article
distributed under the terms and
conditions of the Creative Commons
Attribution (CC BY) license (https://
creativecommons.org/licenses/by/
4.0/).
1Bundesanstalt für Materialforschung und-prüfung (BAM), Unter den Eichen 87, 12205 Berlin, Germany;
2Institute of Machine Tools and Factory Management, Technische Universität Berlin, Straße des 17. Juni 135,
10623 Berlin, Germany
3Institute of Materials Science and Technology, Chair of Metallic Materials, Technische Universität Berlin,
Straße des 17. Juni 135, 10623 Berlin, Germany
*Correspondence: gunther[email protected]
Abstract:
Undetected and undesired microstructural variations in components produced by laser
powder bed fusion are a major challenge, especially for safety-critical components. In this study,
an in-depth analysis of the microstructural features of 316L specimens produced by laser powder
bed fusion at different levels of volumetric energy density and different levels of inter layer time is
reported. The study has been conducted on specimens with an application relevant build height
(>100 mm). Furthermore, the evolution of the intrinsic preheating temperature during the build-up
of specimens was monitored using a thermographic in-situ monitoring set-up. By applying recently
determined emissivity values of 316L powder layers, real temperatures could be quantified. Heat
accumulation led to preheating temperatures of up to about 600
◦
C. Significant differences in the
preheating temperatures were discussed with respect to the individual process parameter combina-
tions, including the build height. A strong effect of the inter layer time on the heat accumulation was
observed. A shorter inter layer time resulted in an increase of the preheating temperature by more
than a factor of 2 in the upper part of the specimens compared to longer inter layer times. This, in
turn, resulted in heterogeneity of the microstructure and differences in material properties within
individual specimens. The resulting differences in the microstructure were analyzed using electron
back scatter diffraction and scanning electron microscopy. Results from chemical analysis as well as
electron back scatter diffraction measurements indicated stable conditions in terms of chemical alloy
composition and austenite phase content for the used set of parameter combinations. However, an
increase of the average grain size by more than a factor of 2.5 could be revealed within individual
specimens. Additionally, differences in feature size of the solidification cellular substructure were
examined and a trend of increasing cell sizes was observed. This trend was attributed to differences in
solidification rate and thermal gradients induced by differences in scanning velocity and preheating
temperature. A change of the thermal history due to intrinsic preheating could be identified as the
main cause of this heterogeneity. It was induced by critical combinations of the energy input and
differences in heat transfer conditions by variations of the inter layer time. The microstructural
variations were directly correlated to differences in hardness.
Keywords:
additive manufacturing; laser powder bed fusion; selective laser melting; laser beam melting;
in-situ process monitoring; thermography; heat accumulation; inter layer time; cellular substructure
1. Introduction
Additive manufacturing (AM) technologies provide promising advantages for the
production of highly individual and complex structures, mass customization, the integra-
Metals 2021,11, 1063. https://doi.org/10.3390/met11071063 https://www.mdpi.com/journal/metals

Metals 2021,11, 1063 2 of 26
tion of functional designs, and the reduction of lead times [
1
,
2
]. The working principles
of various metallic AM processes are described, e.g., by DebRoy et al. [
3
]. Although laser
powder bed fusion (L-PBF) is the most prevalent AM technology for metal part produc-
tion [
4
], the homogeneity of the material produced is still problematic. Inhomogeneity of
the microstructure, defect density, and resulting mechanical properties within parts or in
comparison of different parts have been alluded by several authors [
3
,
5
–
7
]. Microstruc-
tural variations in AM components are a major challenge, especially for safety-critical
components [6,8,9].
A high degree of freedom in design in L-PBF offers the chance to produce complex
shaped geometries. However, the geometry itself can influence the thermal history of a
part during manufacturing as it might change the conditions of heat
dissipation [10–12].
A
detrimental change of the heat conduction through the part towards the base plate, as well
as a significant change of the inter layer time (ILT), can lead to severe heat accumulation
of the part or areas of local overheating. This, in turn, results in deviations of the thermal
history and eventually affects part quality [
5
,
10
,
13
]. In addition to the geometry, there are
many other influencing factors on the thermal history of a L-PBF component. These com-
prise, for instance, processing parameters, scanning strategies, support design, or ratio of
area exploitation [
3
,
5
,
11
,
12
]. The thermal history of an L-PBF process is an important factor
for the development of the microstructure, as it is influenced by the transient temperature
fields during manufacturing. It is well known that variations of temperature gradients can
significantly affect the microstructural development. Lower cooling rates are generally
expected to develop a coarser microstructure than higher cooling rates [1,14].
The microstructure of 316L processed by L-PBF typical shows features that can be
observed over a broad range of length scales. The features include melt pool boundaries,
grains and sub-grains, cellular substructures of grains, segregations, dislocation networks
at the boundaries of cell structures, and nanoscale precipitations [
15
–
18
]. The shape of melt
pool boundaries is influenced by the scanning strategy and process parameters. Their shape
and penetration depth strongly depend on the melting mode [
19
]. Patel und Vlasea [
20
]
reported on the occurrence of deep penetration mode welding (keyhole mode welding) and
transition mode welding over a broad range of process parameters in L-PBF processing of
316L. According to Krakhmalev et al. [
16
], the grains consist of cellular substructures due to
high cooling rates, whereby the cells grow epitaxially, starting at melt pool boundaries. The
cellular substructures grow competitively based on their crystallographic orientation and
the local thermal gradients inside the melt pool [
16
]. The growth of cellular substructures in
316L processed by L-PBF typically leads to segregation of Mn, Mo, and Cr and dislocation
networks at cell boundaries [
15
,
16
]. The features of these cellular substructures, namely, the
cell size and the occurrence of micro-segregations, strongly depend on the local directional
solidification conditions [
9
]. Pinomaa et al. [
9
] recently quantified the influence of the local
thermal gradient and local melt pool solidification rate on these features as well as on the
mode of growth by conducting phase field simulations.
David et al. [
21
] investigated the effect of rapid solidification on the weld metal mi-
crostructures in different stainless steel compositions in the late 1980s. They integrated the
influence of the cooling rate into the Schaeffler diagram [
21
]. It can be derived from
their work that 316 stainless steel solidifies as fully austenitic at cooling rates above
0.28 ×10⁶K·s−1.
Due to the lower austenite stabilizing carbon content in 316L stainless
steel, these cooling rates might shift to slightly higher values for 316L. Bajaj et al. [
22
]
conducted an intense review on steels in L-PBF and direct energy deposition. They re-
ported fully austenitic phase for 316L when processed by L-PBF. Krakhmalev et al. [
16
]
also mentioned a fully austenitic phase with some very exceptional cases of the occurrence
of a ferritic phase.
Additionally, the occurrence of spherical nano-sized oxide inclusions has been re-
ported for 316L produced by L-PBF [
16
]. Lou et al. [
23
] investigated the influence of these
Si- and Mn-rich oxide inclusions. They concluded that these oxide inclusions can be re-
sponsible for the initiation of micro-voids with detrimental effects on impact toughness.

Metals 2021,11, 1063 3 of 26
They compared the measured impact toughness with values from literature for specimens
produced by powder metallurgy route and wrought material, revealing distinct beneficial
effects when the oxygen content was below 0.02%.
In addition to these crystallographic features of the microstructure, internal defects
such as delamination, cracks, and pores can occur [
24
]. Pores can be categorized into
so-called lack-of-fusion defects and gas porosity [
25
]. Lack of fusion defects are irregularly-
shaped pseudo pores, which essentially are cavities resulting from insufficient melting and
insufficient material cohesion due to deficient melt pool dimensions or inadequate choice
of processing parameters such as the hatch distance between single melt tracks [
25
,
26
].
A main source of spherical gas porosity can be found in detached and entrapped vapor
bubbles of the vapor capillary in an instable keyhole welding mode [25,27].
The possibility to influence the temperature gradients occurring in the process has
been shown in different studies. On the one hand, there are approaches to tailor a mi-
crostructure during the L-PBF process by adjusted sets of processing parameters [
28
,
29
]
or modifications of the laser beam shape and intensity profile [
30
,
31
]. On the other hand,
there are approaches to decrease residual stresses or crack susceptibility by, e.g., remelting
or platform preheating adjustments [
32
,
33
]. These approaches have in common the aim to
purposely influence the initial resulting microstructure of an L-PBF specimen or compo-
nent either throughout the entire geometry or within particular regions. However, there
are further situations where variations of microstructures in L-PBF processes should be
considered. This includes unplanned microstructural variations that are induced due to
heat accumulation during the process.
The accumulation of heat during the build-up of an L-PBF part essentially alters
the preheating condition at the surface to be coated by the new powder layer which is
subsequently exposed by laser radiation. Therefore, the initial thermal conditions prior to
the exposure by laser radiation are altered. As a result, the thermal gradients during melting
and solidification might change with varying initial preheating temperature. A significant
change of the preheating temperature of the part can alter the melt pool dimensions and
their solidification conditions [
5
,
34
]. As pointed out by Krakhmalev et al. [
16
], the cellular
mode of solidification in 316L processed by L-PBF occurs at high solidification rates and
steep thermal gradients. The resulting microstructural feature sizes such as cell spacing
depend on these conditions [
16
]. They might change when the preheating temperature
increases due to heat accumulation. Depending on the magnitude of the variation in
preheating condition, the induced variations on the microstructure can be strong enough
to affect the mechanical properties of a component [
5
]. In addition to potential changes
of the melt pool shape and the melt pool dimensions, as well as potential changes of
crystallographic features, an increase of the preheating temperature may also be able
to shift the melting mode to an unstable region with propensity to develop detrimental
keyhole porosity [5].
The authors [
5
] investigated process conditions where heat accumulation was pro-
voked to occur during the L-PBF fabrication of simple cuboid specimens of 316L stainless
steel at application relevant build heights, i.e., the specimens height was bigger than
100 mm.
Using a mid-wavelength infrared thermography camera as an in-situ thermal
monitoring device, significant differences in cooling behavior were revealed. Specimens
were produced applying three distinct ILT and three distinct volumetric energy densities
(VED). The build height was also identified as an affecting factor. The authors correlated
the differences in cooling conditions with differences in apparent sub-grain sizes measured
by light microscopy, melt pool depths, and hardness values. To refine the knowledge of
process-property-relationship and to prove the relationships measured by light microscopy,
a more detailed analysis of the influence of in-situ heat accumulation on the microstructure
of 316L components is required. Therefore, this study pursues the examinations of the
same specimens used in [
5
] and investigates the microstructure by means of electron back
scattered diffraction (EBSD) in greater detail. In addition, scanning electron microscopy
(SEM) is used to compare the feature size of the cellular substructure. The alloy composition

Metals 2021,11, 1063 4 of 26
of the produced specimens as well as a potential oxygen intake is measured by different
methods of chemical analysis. By applying recently conducted temperature adjustments of
the infrared (IR) monitoring set-up [
35
], real temperatures of the powder surfaces could be
quantified. The layer-wise increase of the preheating temperatures of the specimens was
measured in-situ over the entire build process of the specimens. The results are discussed
with respect to recent publications. Results of hardness measurements were taken from [
5
].
Although there have been extensive investigations on L-PBF of 316L, a quantification
of process-induced preheating of the specimens during manufacturing and its correlation
to changes in crystallographic features is currently missing. Information about the mag-
nitude of microstructural changes induced by critical but still realistic process conditions
is important. It will help to improve the evaluation of a real part of the production and
the comparability of test coupons that are manufactured under certain processing condi-
tions. Effects of processing parameters such as scanning velocity or laser power have been
studied extensively. However, the build height and the ILT are often not considered. Their
influence may not be considered significant in the case of typical 10 mm cubic specimens or
in the case of high ratios of area exploitation within the powder bed. They may become an
affecting factor in the case of complex real part geometries with varying area exploitations
over the build height. Additionally, the current trends in the development of new L-PBF
machines (e.g., multi laser machines) are expected to decrease the ILT, which increases the
need for reliable data about potential microstructural heterogeneity.
2. Materials and Methods
2.1. Material and Specimen Manufacturing by L-PBF
In this section, the key facts about the L-PBF processing conditions and specimens
are mentioned. Details were published in [
5
] where the same set of specimens was exam-
ined. Upstanding cuboid-shaped specimens of the dimensions (13
×
20
×
114.5) mm
3
were manufactured on a commercial L-PBF single laser system of type SLM280HL (SLM
Solutions Group AG, Lübeck, Germany) using a commercial 316L stainless steel powder.
Table 1shows the chemical composition of the powder material according to supplier’s
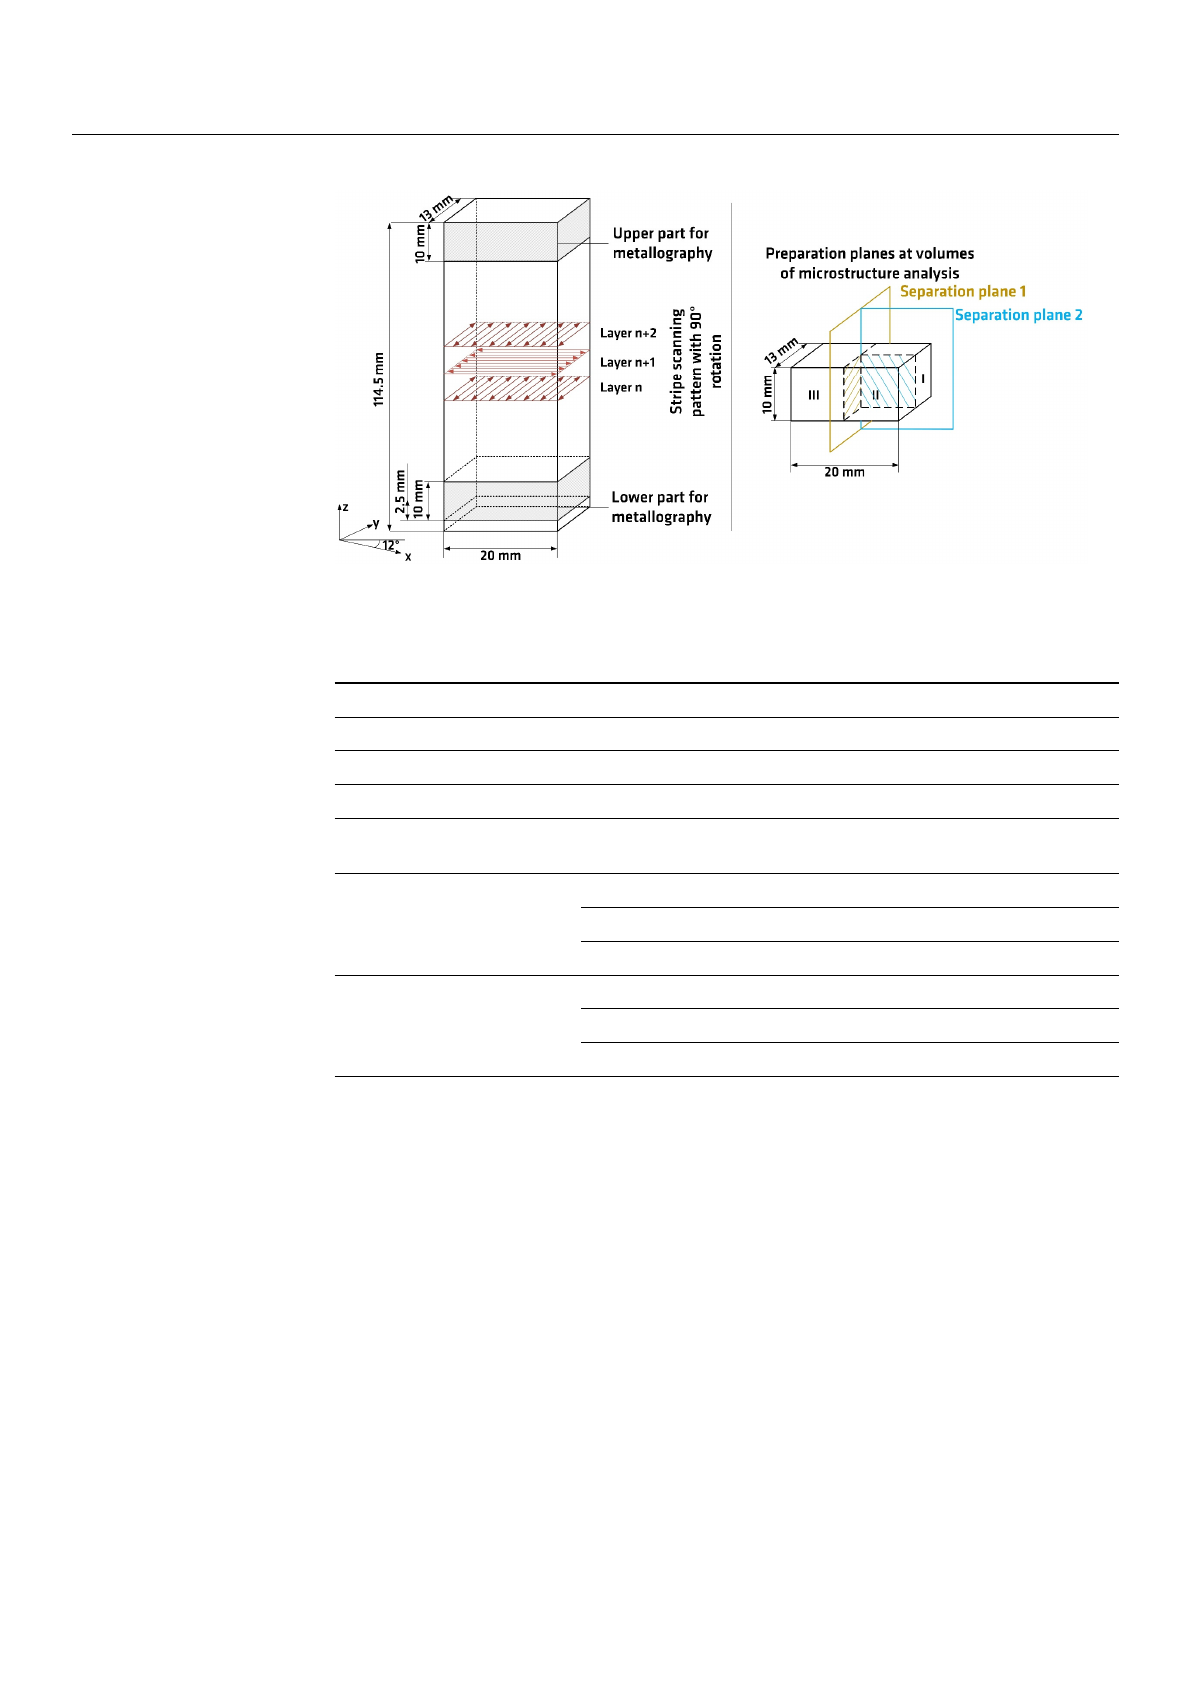
information. Figure 1depicts the geometry of the specimens and contains a schematic
of the applied bidirectional scanning strategy with 90
◦
rotation between layers. It also
highlights the parts of the specimen that were taken for the deeper analysis in this study
in grey color. These were basically the volumes of the lower 12.5 mm (including excess
material for part removal) and of the upper 10 mm of each specimen.
Table 1.
Chemical composition of the 316L raw powder material according to supplier’s information
and the respective min. and max. values as per the material specification by DIN EN 10088-3 [
36
].
The figures express mass fractions in %.
Specification C Si Mn P S Cr Mo Ni N Fe
Min. - - - - - 16.5 2.0 10.0 - bal.
Max. 0.03 1.0 2.0
0.045
0.03 18.5 2.5 13.0 0.1 bal.
Powder
0.017
0.6 0.92
0.012 0.004
17.7 2.35 12.6 0.1 bal.
The specimens were manufactured at three distinct ILT and at each ILT at three distinct
levels of VED by varying the scanning velocity v
s
, i.e., nine different types of specimens
were built. Each specimen type was built up twice, as stated in [
5
]. The other manufacturing
parameters were kept constant. All process parameters are summarized in Table 2.
Metals 2021,11, 1063 5 of 26
Metals 2021, 11, x FOR PEER REVIEW 5 of 27
Figure 1. Specimens’ geometry. Grey volumes were designated for microstructure analysis and
were cut according to the preparation planes in the schematic. Adapted from ref. [5].
The specimens were manufactured at three distinct ILT and at each ILT at three distinct
levels of VED by varying the scanning velocity vs, i.e., nine different types of specimens were
built. Each specimen type was built up twice, as stated in [5]. The other manufacturing
parameters were kept constant. All process parameters are summarized in Table 2.
The ILT of layer number n was defined in [5] and is explained by Equation (1).
ILT = time for powder recoating + time for laser exposing in layer n (1)
The ILT values for specimen production were chosen according to calculated values
from a real part production as compared in [5]. The basis VED parameters represent
parameters for the machine and material recommend by the machine’s manufacturer but
with a simplified scanning strategy. Low VED and high VED parameters were chosen to
broaden the energy input, adjusting the VED by plus 25% and minus 25%.
Table 3 gives an overview of the combinations of variable parameters used for
specimen production. It also contains the applied methods of analysis, which are
described in the following subsections.
The specimens were heat-treated under argon gas atmosphere before removal from
the base plate. The heat treatment was conducted at 450 °C for 4 h after the process to
relieve residual stresses without changing the as-built microstructure.
Table 2. Processing parameters.
Processing Parameters Level
Layer thickness 0.05 mm
Laser power 275 W
Hatch distance 0.12 mm
Platform preheating temperature 100 °C
Inter layer time
Short: 18 s
Intermediate: 65 s
Long: 116 s
Volumetric energy density
Low: 49.12 J∙mm−3 vs = 933 mm∙s−1 (75% of basis VED)
Basis: 65.48 J∙mm−3 vs = 700 mm∙s−1
High: 81.85 J∙mm−3 vs = 560 mm∙s−1 (125% of basis VED)
Figure 1.
Specimens’ geometry. Grey volumes were designated for microstructure analysis and were
cut according to the preparation planes in the schematic. Adapted from ref. [5].
Table 2. Processing parameters.
Processing Parameters Level
Layer thickness 0.05 mm
Laser power 275 W
Hatch distance 0.12 mm
Platform preheating
temperature 100 ◦C
Inter layer time
Short: 18 s
Intermediate: 65 s
Long: 116 s
Volumetric energy density
Low: 49.12 J·mm−3vs= 933 mm·s−1(75% of basis VED)
Basis: 65.48 J·mm−3vs= 700 mm·s−1
High: 81.85 J·mm−3
v
s
= 560 mm
·
s
−1
(125% of basis VED)
The ILT of layer number nwas defined in [5] and is explained by Equation (1).
ILTlayer n=time for powder recoating +time for laser exposing in layer n(1)
The ILT values for specimen production were chosen according to calculated values
from a real part production as compared in [
5
]. The basis VED parameters represent
parameters for the machine and material recommend by the machine’s manufacturer but
with a simplified scanning strategy. Low VED and high VED parameters were chosen to
broaden the energy input, adjusting the VED by plus 25% and minus 25%.
Table 3gives an overview of the combinations of variable parameters used for speci-
men production. It also contains the applied methods of analysis, which are described in
the following subsections.
Loading more pages...