
Citation: Kim, J.; Kowal, J. A Method
for Detecting the Existence of an
Over-Discharged Cell in a
Lithium-Ion Battery Pack via
Measuring Total Harmonic
Distortion. Batteries 2022,8, 26.
https://doi.org/10.3390/
batteries8030026
Academic Editor: Carlos Ziebert
Received: 11 February 2022
Accepted: 17 March 2022
Published: 21 March 2022
Publisher’s Note: MDPI stays neutral
with regard to jurisdictional claims in
published maps and institutional affil-
iations.
Copyright: © 2022 by the authors.
Licensee MDPI, Basel, Switzerland.
This article is an open access article
distributed under the terms and
conditions of the Creative Commons
Attribution (CC BY) license (https://
creativecommons.org/licenses/by/
4.0/).
batteries
Article
A Method for Detecting the Existence of an Over-Discharged
Cell in a Lithium-Ion Battery Pack via Measuring Total
Harmonic Distortion
Jonghyeon Kim * and Julia Kowal
Department of Energy and Automation Technology, Electrical Energy Storage Technology, Technical University of
*Correspondence: [email protected]
Abstract:
This paper deals with a method to detect the existence of an over-discharged cell in a
lithium-ion battery (LIB) pack by measuring the total harmonic distortion (THD) rate in the voltage
response. Over-discharge of the LIB cell reduces the available capacity by irreversible chemical
reactions, resulting in serious safety risks such as explosions. Even if only one over-discharged cell
exists in the battery pack, it accelerates the decomposition of other cells. In general, the measurement
of each cell voltage in a battery pack is required to detect one over-discharged cell. This is because
if only the voltage of the battery pack is measured, it cannot be distinguished whether the voltage
of each cell is uniformly low or one specific weak cell is over-discharged. The proposed method
measures the frequency response through the voltage at only two terminals of the battery pack to
detect the presence of one over-discharged cell. When the battery cell is discharged beyond a certain
level, the system nonlinearity of the battery pack increases, and it can be detected from the increased
THD rate of the battery pack. The proposed method is verified by simulation and measurement.
Keywords: lithium-ion battery; over-discharge; total harmonic distortion
1. Introduction
Interest in eco-friendly energy sources is increasing around the world. The reason
for this may be that rapid industrialization and the use of fossil fuel resources accelerate
climate change, such as greenhouse effects caused by carbon dioxide. Secondary batteries
are considered eco-friendly because they can be recharged, unlike primary batteries, which
cannot be reused after a complete discharge. The use of a secondary battery not only
reduces the consumption of resources required for making additional cells but also reduces
the generation of environmental substances in the disposal process. Lithium secondary
batteries use lithium ions as charging carriers in electrodes and electrolytes. They are widely
used in a variety of applications [
1
–
3
] because they not only have a high energy density,
but also show little self-discharge and memory effects and have a stable performance and
long cycle life. However, batteries with high energy have a high safety risk against battery
failure [
4
,
5
], thus there is a growing demand to improve battery management system
(BMS) technology.
Lithium-ion battery (LIB) cells are connected as a battery pack or module. They are
connected in series to reach the required voltage level and in parallel to reach a sufficient
capacity. When the battery pack is used, the probability of failure is higher than when a
single battery cell is used, and the probability of failure of a battery pack to which n cells
are connected exceeds n times that of the single-cell failure. Moreover, the management of
battery packs in which cells are connected in series is particularly important, since each cell
connected in series suffers a different load even if the same current flows, resulting in a
voltage deviation, while battery cells connected in parallel always have the same voltage.
Batteries 2022,8, 26. https://doi.org/10.3390/batteries8030026 https://www.mdpi.com/journal/batteries

Batteries 2022,8, 26 2 of 14
Factors affecting cell imbalance are divided into intrinsic factors and extrinsic fac-
tors [
6
,
7
]. Intrinsic factors are related to the manufacturing process, such as capacity,
impedance, amount of active material, and self-discharge rate, while extrinsic factors are
related to the cell connection method, charge/discharge current, and heat dispersion. A
temperature deviation of cells in the battery pack affects cell characteristics, including the
self-discharge speed, resulting in performance deviation, and an external circuit connected
to the cells for management also exacerbates the cell imbalance. The series-connected
cells in the battery pack are charged and discharged at different rates, and the deviation
of individual cells gradually increases, making them vulnerable to being overcharged or
over-discharged [
8
–
10
]. Consequently, the capacity of the battery cell is gradually lost, the
cycle life is shortened [
11
–
13
], and fatal failures may occur [
14
,
15
]. Even though one cell in
the battery pack is over-discharged or over-charged, the degradation of connected cells is
sequentially accelerated due to the imbalance [12,16,17].
In general, the BMS monitors whether each cell voltage in the LIB pack is within a safe
range. This is because the battery pack voltage may still remain in the normal range while
one weak cell is being over-discharged. This can be explained by Figure 1.
Batteries 2022, 8, x FOR PEER REVIEW 2 of 14
a voltage deviation, while battery cells connected in parallel always have the same volt-
age.
Factors affecting cell imbalance are divided into intrinsic factors and extrinsic factors
[6,7]. Intrinsic factors are related to the manufacturing process, such as capacity, imped-
ance, amount of active material, and self-discharge rate, while extrinsic factors are related
to the cell connection method, charge/discharge current, and heat dispersion. A tempera-
ture deviation of cells in the battery pack affects cell characteristics, including the self-
discharge speed, resulting in performance deviation, and an external circuit connected to
the cells for management also exacerbates the cell imbalance. The series-connected cells in
the battery pack are charged and discharged at different rates, and the deviation of indi-
vidual cells gradually increases, making them vulnerable to being overcharged or over-
discharged [8–10]. Consequently, the capacity of the battery cell is gradually lost, the cycle
life is shortened [11–13], and fatal failures may occur [14,15]. Even though one cell in the
battery pack is over-discharged or over-charged, the degradation of connected cells is se-
quentially accelerated due to the imbalance [12,16,17].
In general, the BMS monitors whether each cell voltage in the LIB pack is within a
safe range. This is because the battery pack voltage may still remain in the normal range
while one weak cell is being over-discharged. This can be explained by Figure 1.
(a) (b)
Figure 1. (a) Battery cells having a uniform voltage; (b) battery cells having a non-uniform voltage.
Suppose that the total voltages of the connected cells in Figure 1a,b are the same. It is
ideal if the voltages of the cells connected in series are uniform as illustrated in Figure 1a,
but in real applications, the voltage deviation of each cell gradually increases as illustrated
in Figure 1b, i.e., from the measured voltage of the battery pack, it may be considered that
cells could be further discharged as illustrated in Figure 1a, but some cells may be in dan-
ger of being over-discharged as illustrated in Figure 1b. However, measuring the voltage
of each cell in a battery pack/module with hundreds to thousands of cells connected in-
creases the complexity of the circuit.
This paper aims to detect the over-discharge of a weak cell in a battery pack in ad-
vance without measuring the voltage of each cell. The presence of a cell facing the risk of
over-discharge can be detected by measuring the total harmonic distortion (THD) of the
battery pack because cells increase the nonlinearity of the battery system at a low state of
charge (SoC).
THD analysis belongs to a non-invasive method that uses frequency responses for
system analysis. An understanding of electrochemical and physical processes is required
to obtain a better performance and safer operation of LIBs, and electrochemical impedance
spectroscopy (EIS) is well known as a non-destructive measurement technique used for
this purpose [18,19]. EIS is used to determine the dynamic behavior of electrochemical
systems [20,21] by obtaining a characteristic impedance spectrum at a wide range of fre-
quencies from several mHz to several kHz [22–25]. Because a specific characteristic fre-
quency range is related to each specific process [18], a model structure can be used to
measure the parameters of a battery cell, in which the model structure is determined by
the cell SoC, state of health (SoH), aging, temperature, internal defect, etc. [26–28]. With
the improvement of the EIS analysis technique, the impedance during the operation of the
LIB cell is measured to monitor cell states such as SoH and SoC [29–34]. However, since
Figure 1. (a) Battery cells having a uniform voltage; (b) battery cells having a non-uniform voltage.
Suppose that the total voltages of the connected cells in Figure 1a,b are the same. It is
ideal if the voltages of the cells connected in series are uniform as illustrated in Figure 1a,
but in real applications, the voltage deviation of each cell gradually increases as illustrated
in Figure 1b, i.e., from the measured voltage of the battery pack, it may be considered that
cells could be further discharged as illustrated in Figure 1a, but some cells may be in danger
of being over-discharged as illustrated in Figure 1b. However, measuring the voltage of
each cell in a battery pack/module with hundreds to thousands of cells connected increases
the complexity of the circuit.
This paper aims to detect the over-discharge of a weak cell in a battery pack in
advance without measuring the voltage of each cell. The presence of a cell facing the risk of
over-discharge can be detected by measuring the total harmonic distortion (THD) of the
battery pack because cells increase the nonlinearity of the battery system at a low state of
charge (SoC).
THD analysis belongs to a non-invasive method that uses frequency responses for
system analysis. An understanding of electrochemical and physical processes is required
to obtain a better performance and safer operation of LIBs, and electrochemical impedance
spectroscopy (EIS) is well known as a non-destructive measurement technique used for
this purpose [
18
,
19
]. EIS is used to determine the dynamic behavior of electrochemical
systems [
20
,
21
] by obtaining a characteristic impedance spectrum at a wide range of
frequencies from several mHz to several kHz [
22
–
25
]. Because a specific characteristic
frequency range is related to each specific process [
18
], a model structure can be used to
measure the parameters of a battery cell, in which the model structure is determined by
the cell SoC, state of health (SoH), aging, temperature, internal defect, etc. [
26
–
28
]. With
the improvement of the EIS analysis technique, the impedance during the operation of the
LIB cell is measured to monitor cell states such as SoH and SoC [
29
–
34
]. However, since
EIS analysis is only valid in linear systems, the pseudo-linearity of electrochemical systems

Batteries 2022,8, 26 3 of 14
must be premised. The operation of LIBs belonging to electrochemical battery cells involves
nonlinear processes, thus EIS is not suitable for the analysis of such dynamic information.
Behavior due to nonlinear dynamics of LIBs can be measured through THD analysis.
THD is defined as the ratio of the total power of all harmonic components to the power
of fundamental frequencies, also known as a distortion factor. When
ω
is input as a
fundamental frequency into a nonlinear system, additional n
ω
components, which are
multiples of the fundamental frequency, appear in the frequency response. These additional
components are called harmonics. THD represents the ratio of the harmonics to the
fundamental frequency, indicating the degree of nonlinearity of the system. In particular,
the THD used in this paper is THD + N, which is the addition of noise to THD to make it
more suitable for use in devices and is expressed by Equation (1).
THD +N=q∑V2
n+∑Noise2
qV2
1
×100 (%)(1)
where V
n
is the RMS of the n-th harmonic components and V
1
is the RMS of the fundamen-
tal component.
THD is one of the nonlinearity analysis methods applied to various research fields.
In general, it is used in acoustic research for noise detection [
35
], and it can be applied
as a quality standard for linearity evaluation and is used to measure nonlinearity that
reduces the reliability of EIS measurements [
36
,
37
]. Additionally, it is used to characterize
the electrode material and electrochemical reaction of the redox systems [
38
–
41
]. When
THD is used for methanol oxidation kinetics and methanol concentration analysis in direct
methanol fuel cells, it shows better results than when EIS is used [
42
,
43
], and THD is also
used to estimate the SoC of the lead-acid battery [
44
]. Harting et al. [
45
] analyzed the aging
of lithium-ion battery cells by applying the nonlinear frequency response analysis (NFRA).
According to this study, harmonics due to nonlinearity are measured as larger at lower
frequencies and are not well revealed at frequencies higher than 200 Hz.
In this paper, a 1 Hz frequency is used as the fundamental frequency, i.e., the over-
discharge of a cell in the battery pack can be monitored every 1 s. The higher the test
frequency, the smaller the magnitude of the harmonics becomes, which causes a problem
in the signal-to-noise ratio (SNR) and thus makes it difficult to measure THD. Conversely,
the use of lower test frequencies increases the magnitude of harmonics, which can benefit
from the SNR, but increases the interval for monitoring.
1.1. Definition of Key Terms
1.1.1. Definition of SoC
In this paper, the SoC of the battery cell is defined as the ratio of the capacity when
fully charged under the appropriate charging conditions proposed by the manufacturer to
the residual capacity of the cell. This is expressed by Equation (2).
SoC =Cresidual/Cfull ×100 (%)(2)
where
Cresidual
is the residual cell capacity, and
Cfull
is the cell capacity when fully charged.
In contrast, the depth of discharge (DoD) is defined as (100%–SoC), i.e., a cell of 60%
SoC has the same meaning as a cell of 40% DoD.
1.1.2. Definition of SoH
The battery cycle life refers to the total number of full charge/discharge cycles that
can be achieved, and in this paper, SoH is defined as the ratio of the nominal capacity of
the cell to the maximum available capacity in the present cell state. This is expressed by
Equation (3).
SoH(%)=Qpresent
Qnominal
×100 (%)(3)
Batteries 2022,8, 26 4 of 14
where
Qpresent
is the maximum available cell capacity of the present condition and
Qnominal
is the nominal capacity.
2. Simulation and Measurement
2.1. THD Simulation of a LIB Cell Being Discharged
The LIB cell simulation model of reference [
30
] is used to verify the proposed method.
This model is an electrical equivalent circuit model of an LIB developed to simulate the
frequency response of LIB cells during discharge. Three parallel RC networks are used
in this model, and cell SoC, SoH, temperature, and operating current are considered for
voltage response simulation.
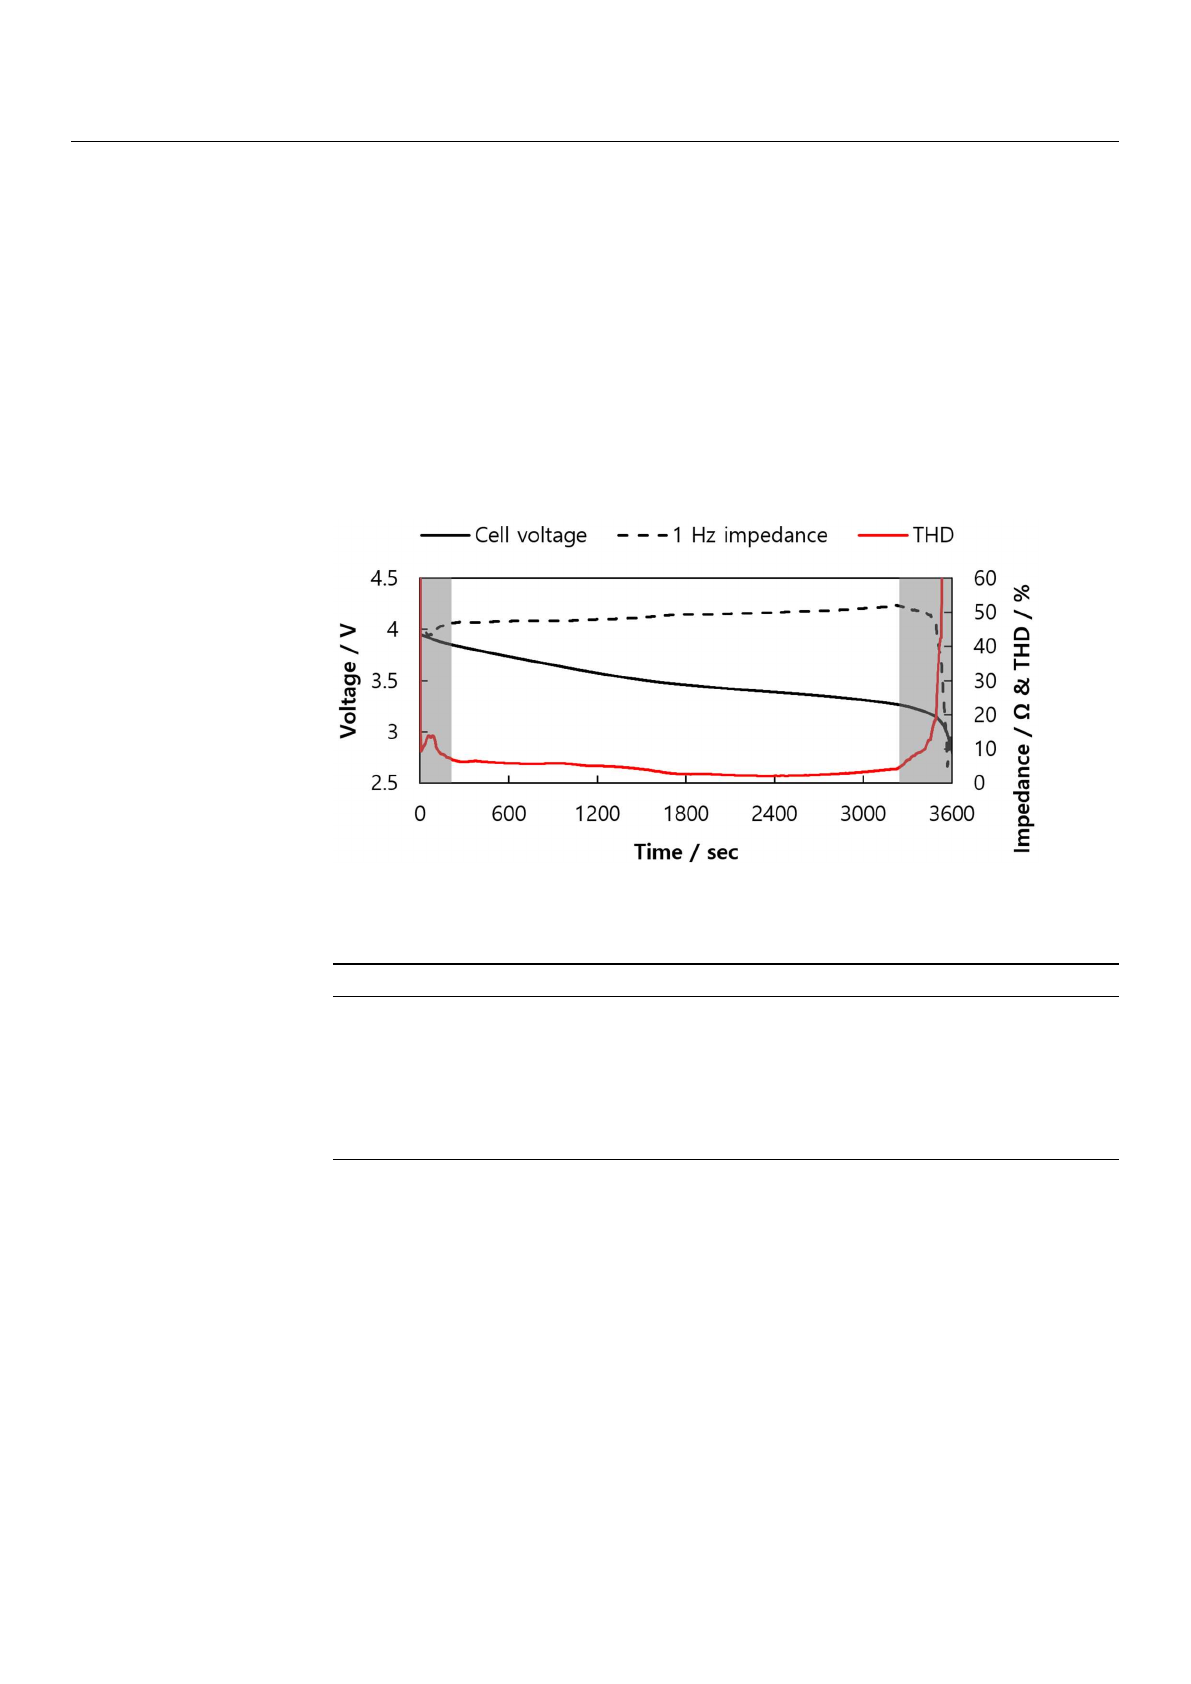
Figure 2shows the voltage, 1 Hz impedance, and THD of the cell simulated during
the discharge. Table 1shows the simulation conditions.
Batteries 2022, 8, x FOR PEER REVIEW 4 of 14
SoH
(
%
)
=
Q
Q
×
100
(
%
)
(3)
where Q is the maximum available cell capacity of the present condition and
Q is the nominal capacity.
2. Simulation and Measurement
2.1. THD Simulation of a LIB Cell Being Discharged
The LIB cell simulation model of reference [30] is used to verify the proposed method.
This model is an electrical equivalent circuit model of an LIB developed to simulate the
frequency response of LIB cells during discharge. Three parallel RC networks are used in
this model, and cell SoC, SoH, temperature, and operating current are considered for volt-
age response simulation.
Figure 2 shows the voltage, 1 Hz impedance, and THD of the cell simulated during
the discharge. Table 1 shows the simulation conditions.
Figure 2. Simulation result of cell voltage, 1 Hz impedance, and THD while one LIB cell is dis-
charged.
Table 1. Conditions for THD simulation of a LIB cell being discharged.
Parameter Description
Test frequency 1 Hz
Initial SoC 100%
Cell state of health (SoH) 100%
DC bias 2.6 A (1 C)
Sampling rate 1024 Hz
Amplitude 26 mA
Lower cut-off voltage 2.8 V
In Figure 2, the cell voltage, 1 Hz impedance, and THD are continuously calculated
every second while the battery cell is discharged. It is shown that a 1 Hz impedance cannot
be obtained properly at the beginning of the cell discharge and at the deep DoD. These
two ranges are indicated in gray. The reason impedance cannot be correctly obtained in
these two areas is not a problem with the simulation model, but because of the nonlinear-
ity in the cell voltage output. The method of measuring cell impedance using the fre-
quency response can only be obtained correctly when the linearity condition is satisfied
[41]. Even if the battery cell is discharged with a constant current, the cell voltage shows
nonlinearity due to activation polarization and concentration polarization [46]. In these
Figure 2.
Simulation result of cell voltage, 1 Hz impedance, and THD while one LIB cell is discharged.
Table 1. Conditions for THD simulation of a LIB cell being discharged.
Parameter Description
Test frequency 1 Hz
Initial SoC 100%
Cell state of health (SoH) 100%
DC bias 2.6 A (1 C)
Sampling rate 1024 Hz
Amplitude 26 mA
Lower cut-off voltage 2.8 V
In Figure 2, the cell voltage, 1 Hz impedance, and THD are continuously calculated
every second while the battery cell is discharged. It is shown that a 1 Hz impedance cannot
be obtained properly at the beginning of the cell discharge and at the deep DoD. These
two ranges are indicated in gray. The reason impedance cannot be correctly obtained in
these two areas is not a problem with the simulation model, but because of the nonlinearity
in the cell voltage output. The method of measuring cell impedance using the frequency
response can only be obtained correctly when the linearity condition is satisfied [
41
]. Even
if the battery cell is discharged with a constant current, the cell voltage shows nonlinearity
due to activation polarization and concentration polarization [
46
]. In these areas, the THD
increases due to the occurrence of harmonics because of the system nonlinearity.
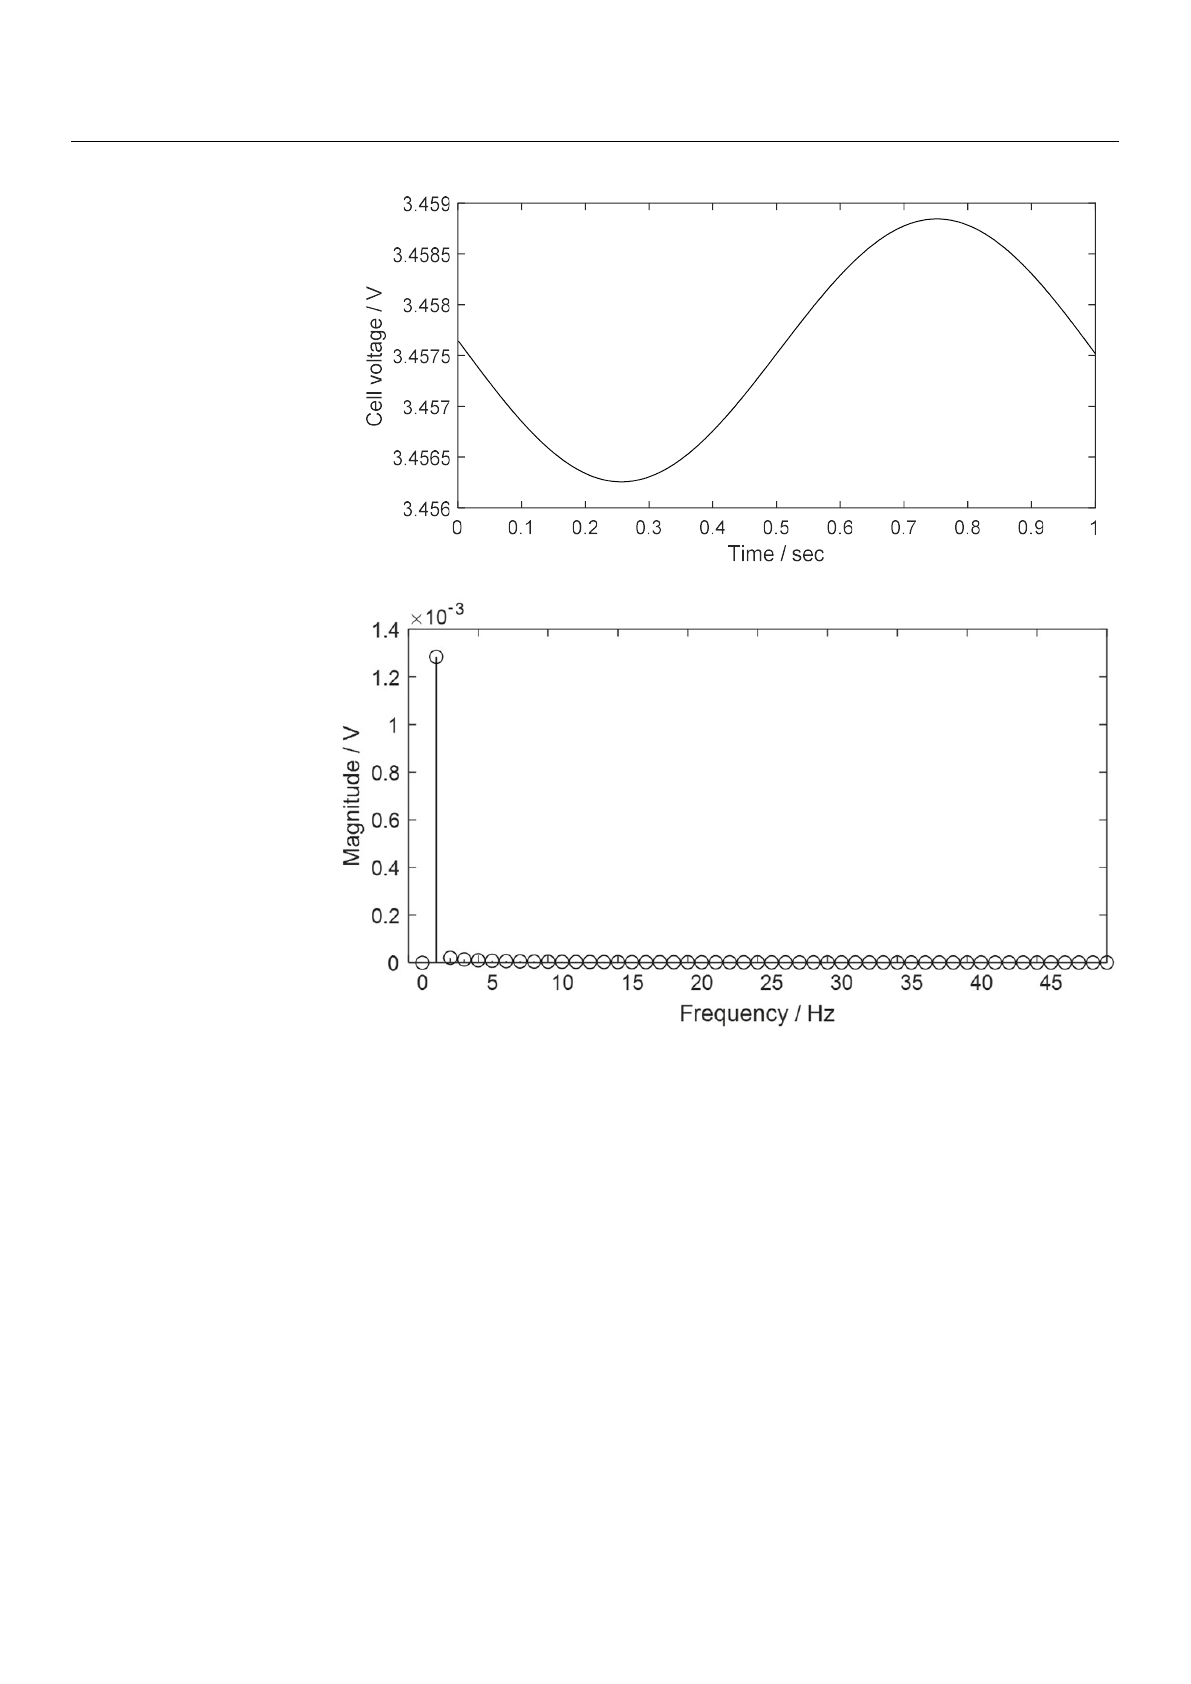
Figures 3and 4show the cell voltages for 1 s simulated at 50% and 2% cell SoCs,
respectively, in the time domain and frequency domain.
Batteries 2022,8, 26 5 of 14
Batteries 2022, 8, x FOR PEER REVIEW 5 of 14
areas, the THD increases due to the occurrence of harmonics because of the system non-
linearity.
Figures 3 and 4 show the cell voltages for 1 s simulated at 50% and 2% cell SoCs,
respectively, in the time domain and frequency domain.
(a)
(b)
Figure 3. Voltage response simulated for 1 s at a cell SoC of 50% (a) in a time domain and (b) in a
frequency domain.
Figure 3.
Voltage response simulated for 1 s at a cell SoC of 50% (
a
) in a time domain and (
b
) in a
frequency domain.
In Figure 3, THD simulated at cell SoC of 50% is 2.59%. Figure 3a shows insignificant
distortion in the form of a 1 Hz sine wave in the time domain, and components other than
the fundamental frequency 1 Hz are rarely shown in Figure 3b.
In Figure 4, the THD simulated at a cell SoC of 2% is 73.49%. Figure 4a shows a
noticeably distorted 1 Hz sine wave in the time domain, and components other than the
fundamental frequency 1 Hz are shown in the frequency domain in Figure 4b.
Loading more pages...