
Vol.:(0123456789)
International Journal of Thermophysics (2023) 44:21
https://doi.org/10.1007/s10765-022-03122-w
1 3
Viscosity Correlation forAqueous Lithium Bromide Solution
ChristianFleßner1 · FelixZiegler1
Received: 20 July 2022 / Accepted: 21 October 2022 / Published online: 2 December 2022
© The Author(s) 2022
Abstract
A correlation for dynamic viscosity of aqueous lithium bromide solution is pro-
posed. The correlation is based on an empirical approach accounting for physical
limitations. The data are compiled from 11 sources over a temperature range from
− 20
◦
C to 110
◦
C and from pure water to salt mass fractions of 65%. The correla-
tion succeeds in predicting the solution’s viscosity over the chosen range of meas-
ured data. In most parts of its validity range the accuracy is significantly improved
compared to previous equations.
Keywords Aqueous solution· Correlation· Lithium bromide· Saline solution·
Viscosity
1 Introduction
The extension of the operation range of absorption heat pumps and chillers with
aqueous lithium bromide as working pair to evaporator temperatures below
0◦C
requires an additive in the refrigerant circuit to avoid freezing. Lithium Bromide
(LiBr) is an obvious choice for this purpose. Thus, the need to calculate thermody-
namic and transport processes as well as the need to evaluate measured data over an
extended range of mass fraction and temperature arises. This depends on reliable
and consistent property data.
The dynamic viscosity is an important measure for all calculations of heat and
mass transfer related to flow phenomena. Ideally, a single correlation should be usa-
ble to accurately calculate viscosity from very dilute conditions near to pure water
at temperatures below
0◦C
to concentrated solutions at high temperatures, to avoid
inconsistencies. No currently available empirical or theoretical equation is able to
provide this range.
* Christian Fleßner
Felix Ziegler
1 Institut für Energietechnik, Technische Universität Berlin, Marchstr. 18, 10587Berlin, Germany

International Journal of Thermophysics (2023) 44:21
1 3
21 Page 2 of 23
Fleßner etal. [1] presented an approach for a correlation of low-temperature ther-
mophysical property data of dilute aqueous solutions of lithium bromide based on
the experimental data of Sawada etal. [2] normalized with pure water properties
calculated by IAPWS SR06-08 [3, 4]. The issue with the selected approach is its
limitation to the low concentration range of the data it is based on. The correlation
is not suitable for extrapolation to mass fractions higher than
𝜉=0.2
. Attempts to fit
data over a wider range with the same form of correlation failed to deliver satisfac-
tory results.
Simple theory-based approaches like the Falkenhagen [5] and Jones–Dole equa-
tions [6] are limited to very dilute solutions. Extensions like the semi-empirical
Kaminsky equation [7] suffer from difficulties for the determination of the tempera-
ture dependence of their higher order coefficients. More recent approaches for a the-
oretical derivation like from Jiang and Sandler [8] are computationally too demand-
ing for general purpose engineering calculations.
The often used correlation of Lee etal. [9] featured in the textbook by Herold
etal. [10] is primarily centered on the mass fraction and temperature range encoun-
tered in absorber and desorber of absorption heat pumps, claiming a validity of
𝜉=0.45
to 0.65 and
T=312.9 K
to 427.7 K. The correlation used in the second
edition of the same textbook [11] does not give any validity range at all. It is not
published and available only via the help files of the calculation software EES [12].
The correlation of Kim and Infante Ferreira [13,p. 32] is based on the experi-
mental data of Lee etal. [9] and unspecified data for pure water. A validity of
𝜉=0
to 65 and
0◦C
to
220 ◦C
is claimed. A commercial implementation for several com-
putational software suites [14] also exists.
To remedy the lack of an applicable equation ranging from below
0◦C
to high
desorber temperatures, a simple new correlation extended from the form of [1] to fit
the experimental data in a temperature range from
−20 ◦C
to
110 ◦C
and from pure
water to saline mass fractions of
𝜉=0.65
is proposed. The limits of the temperature
range are determined by the validity limits of the correlation chosen for the normali-
zation [3]. In the present article, the data considered for this equation are analyzed
first. In a next step the equation’s form is derived from the experimental data’s slope
and suitable parameters are fitted. Finally, the correlation is compared to the experi-
mental data with an additional comparison of existing correlations with the same set
of data.
2 Analysis ofData
The experimental data of [2, 9, 15–23] have been compiled. Only measured data are
used. Therefore, interpolated data like [24, 25] as well as the smoothed data reported
in [16] have been excluded from the compilation of data. The data of Valyashko’s
compilation [26] were not used, since apart from the data of Lee etal. [9] it contains
only data for temperatures outside the scope of this study (
446 K
and above). The
data were collected either by extracting them from diagrams with WebPlotDigitizer
[27] or by transcribing tabular data. Different units for salt content were converted
to mass fraction. Temperature and dynamic viscosity were converted to
K
and
Pa s
.

1 3
International Journal of Thermophysics (2023) 44:21 Page 3 of 23 21
The data sources with their respective limits and number of overall and excluded
data points as well as the symbols used in Figs.1, 2, 3, 4, 5, 6, 7, 8, 9, 10 are listed
in Table1.
The viscosity of pure water
𝜂W
used to determine the reduced viscosity (viscosity of
solution divided by viscosity of solvent —
𝜂sol∕𝜂W
) is calculated with IAPWS SR6-
08 [3, 4] since it provides an accurate and computationally efficient equation with
only temperature as the independent variable. Pressure dependence of thermophysi-
cal properties of aqueous solutions is not an issue at the moderate pressures encoun-
tered in absorption chillers and heat pumps (see the comparison in Appendix A).
This correlation is valid from
−20 ◦C
to
110 ◦C
, determining the limits of the pre-
sented correlation in terms of temperature. This range is sufficient for single-effect
absorption heat pumps and chillers. For a further extension of validity aiming at
multi effect chillers and heat pumps as well as heat transformers a different equation
for pure water has to be used.
The limits concerning mass fraction are derived from the desire for an extrapola-
tion to pure water on the one hand and from the highest mass fraction of measured
data available on the other hand.
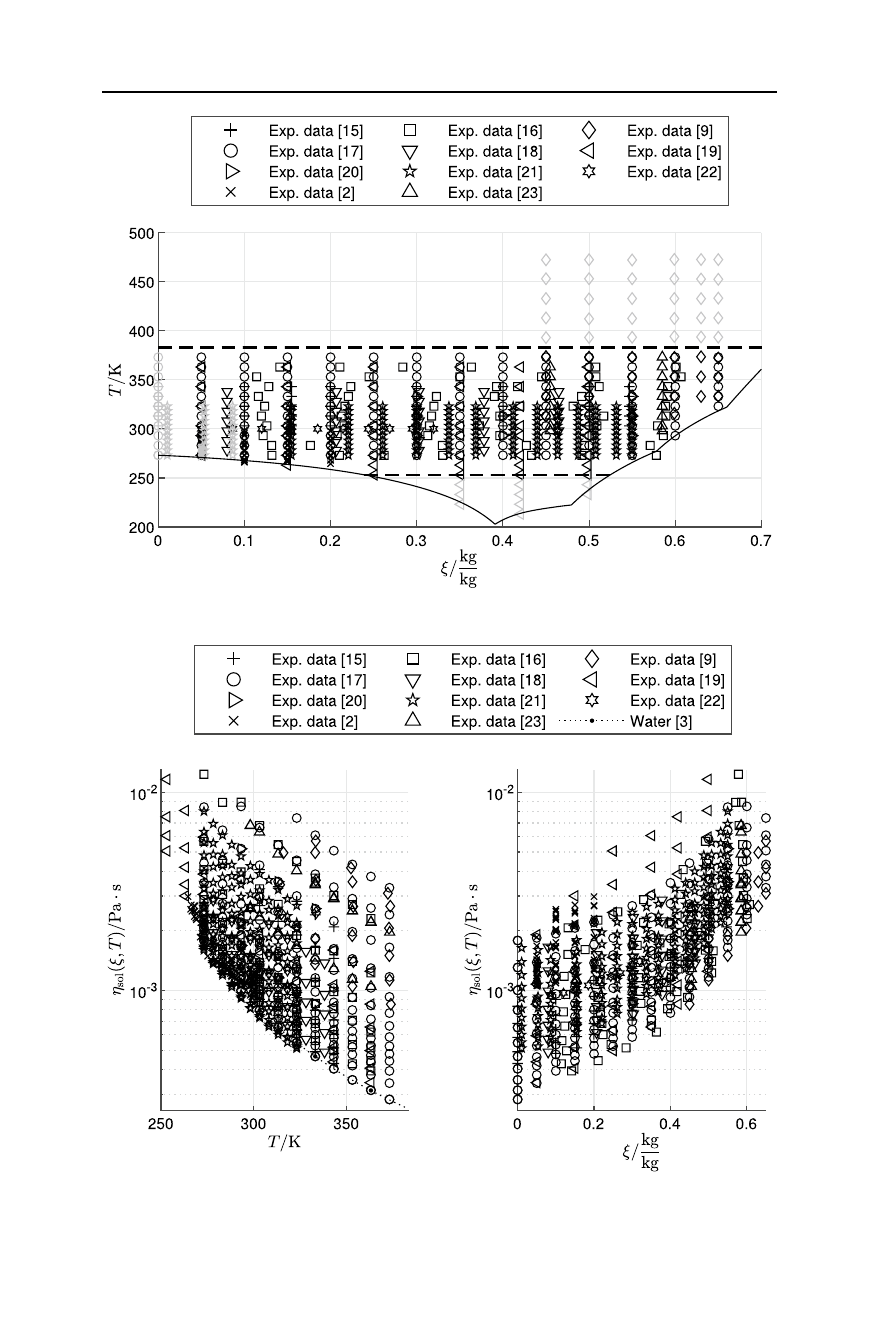
The range of data considered is displayed in Fig.1. The dashed lines indicate
the selected temperature range. The other boundaries are given by the calculated
crystallization lines [28] and the overall selected mass fraction range. No significant
gaps in the considered range are visible. The measured values not included into the
fit are marked in a lighter shade of gray. It is visible that only data of Lee etal. [9]
are above the upper boundary. The only data below the selected temperature range
are from Mashovets etal. [19]. It is noticeable that some of the data are below the
calculated crystallization line. This includes the lowest temperature data of [19] as
well as single data points of [2, 23]. It cannot be discerned whether this is due to
uncertainties of the calculated crystallization line, due to uncertainties of the respec-
tive author’s mass fraction measurement or due to subcooled states in the exper-
imental investigations. Since these data are still plausible within the usual uncer-
tainty they were included into the correlation’s database. Apart from data outside the
desired validity range, further data points were excluded from the database before
fitting. The data for pure water from Cao etal. [15] and Löwer [17] were not used, to
avoid contradictions with the calculated pure water properties according to IAPWS
SR6-08 [3] in the fitting process. Data points with a viscosity lower than that of pure
water occurring in the datasets of Rohman etal. [21] and Sawada etal. [2] are also
excluded from the fit. Though such a behavior occurs in some saline solutions like
potassium bromide (see Jiang & Sandler [8]), all known experimental data or theo-
retical studies for lithium bromide apart from [21] and some data points of [2] show
a monotonic increase of reduced viscosity with increasing salt content. Therefore,
the respective data are discarded as unphysical.
Figure2 shows the viscosity of all selected data points over T and
𝜉
. Despite the
high density of data points basic outlines of isosteric and isothermal lines are visible
following the experimental conditions selected by their original authors. In Fig.2a
the viscosity of pure water is visualized with a dotted line with additional larger
dots. Otherwise only the respective data’s sources are distinguished with different
International Journal of Thermophysics (2023) 44:21
1 3
21 Page 4 of 23
Table 1 Overview on data sources
a Data outside the selected validity range are excluded from the correlation’s database and are not included in Figs.2, 3, 4, 5, 6, 7, 8, and 9
b The pure water data were not included into the correlation’s database, but are included in Figs.2, 3, 4, and 6
c The data below the viscosity of pure water were removed from the correlation’s database, see below. They are still included in Figs.2, 3, 4, and 6
Data source
Tmin
(K)
Tmax
(K)
𝜉min
𝜉max
ndata
nexcl
Symbol
Cao etal. [15]
303.15
343.15
0 0.5468 40 5b
+
Hasaba etal. [16]
273.15
363.15
0.1143 0.6068 61 0
◻
Lee etal. [9]
312.9
472.9
0.45 0.65 52 30a
♢
Löwer [17]
273.15
373.15
0 0.65 147 11b
◦
Lo Surdo etal. [18]
278.15
338.15
0.0799 0.4648 33 0
▿
Mashovets etal. [19]
213.15
363.15
0.0506 0.4988 54 9a
⊲
Raatschen [20]
293.15
333.15
0.3 0.55 9 0
⊳
Rohman etal. [21]
273.15
323.15
0.0105 0.5498 176 33c
Satoh etal. [22]
300.15
300.15
0.0502 0.3196 10 0
Sawada etal. [2]
264.57
298.69
0.05 0.2 74 7cX
Wimby etal. [23]
298.06
373.26
0.1531 0.5850 29 0
△
1 3
International Journal of Thermophysics (2023) 44:21 Page 5 of 23 21
Fig. 1 Crystallization line and measured data used for correlation, Symbols for data sources in the legend
according to Table1
(a) (b)
Fig. 2 Viscosity over T (a) and
𝜉
(b), measured data, not filtered , Symbols for data sources in the legend
according to Table1
Loading more pages...