
Kinetic investigation of para-nitrophenol reduction
with photodeposited platinum nanoparticles onto
tunicate cellulose
T. A. Thiel,
ab
X. Zhang,
c
B. Radhakrishnan,
c
R. van de Krol,
c
F. F. Abdi,
c
M. Schroeter,
d
R. Schom¨
acker
a
and M. Schwarze *
a
Photodeposition is a specific method for depositing metallic co-catalysts onto photocatalysts and was applied
for immobilizing platinum nanoparticles onto cellulose, a photocatalytically inactive biopolymer. The obtained
Pt@cellulose catalysts show narrow and well-dispersed nanoparticles with average sizes between 2 and 5 nm,
whereby loading, size and distribution depend on the preparation conditions. The catalysts were investigated
for the hydrogenation of para-nitrophenol via transfer hydrogenation using sodium borohydride as the
hydrogen source, and the reaction rate constant was determined using the pseudo-first-order reaction rate
law. The Pt@cellulose catalysts are catalytically active with rate constant values kfrom 0.09 ×10
−3
to 0.43
×10
−3
min
−1
, which were higher than the rate constant of a commercial Pt@Al
2
O
3
catalyst (k=0.09 ×
10
−3
min
−1
). Additionally, the Pt@cellulose catalyst can be used for electrochemical hydrogenation of para-
nitrophenol where the hydrogen is electrocatalytically formed. The electrochemical hydrogenation is faster
compared to the transfer hydrogenation (k=0.11 min
−1
).
1. Introduction
Green chemistry has become increasingly important in over-
coming environmental problems and climate change in the
recent 20 years. It is dened by twelve principles, which include
waste prevention, atom economy, less hazardous synthesis
pathways, the design of benign chemicals, green solvents and
auxiliaries, energy efficiency, renewable feedstocks, reducing
derivatives, catalysis, degradability, real-time analysis for
pollution prevention and overall accident prevention.
1
Catalysis
plays a key role in green chemistry, with a focus on reactions at
high selectivity under mild reaction conditions. The applied
catalyst can be in the form of catalyst complexes, metal nano-
particles, or bulk powders. In addition to the catalyst's activity,
the catalyst separation from the reaction media is an important
issue that can be solved by catalyst immobilization. Homoge-
neous catalyst complexes can be immobilized in a liquid–liquid
two-phase system, as shown in the Ruhrchemie/Rhˆ
one-Poulenc
process for the hydroformylation of propene to n-butyralde-
hyde.
2
Nanoparticles can be immobilized in different ways. One
approach uses stabilizers like micelles
3
or polymers.
4,5
The most
common approach is the immobilization onto inert solid
supports, which facilitates recycling but also avoids the
agglomeration of nanoparticles. For example, gold nano-
particles can be deposited on various metal oxides like silica,
cerium oxide, or zirconium oxide, using chloroauric acid
(HAuCl
4
) as the Au precursor.
6
Metal oxides are preferred as
support materials because of their high chemical and thermal
stability.
6,7
However, since many reactions such as coupling
reactions or hydrogenations of phenol
8
or allylbenzene
9
take
place at temperatures below 150 °C or even at room tempera-
ture, an alternative is to use sustainable biomaterial supports
like chitosan, starch, and cellulose.
6,10,11
Cellulose is the most
abundant natural polymer. In recent years, its use as a support
material for metal nanoparticles has been investigated, as
shown in the review of Kaushik and Moores.
12
Cellulose nano-
particles such as nanocrystals and nanobres can be obtained
from the hydrolysis of cellulose with sulfuric acid, removing the
amorphous regions. Conventional deposition methods of metal
nanoparticles from metal salt precursors like impregnation,
including calcination at high temperatures, are not suitable
because cellulose degrades at temperatures above 170 °C.
Therefore, preparing supported metal nanoparticles from an
appropriate precursor is common using reducing agents. Salt
precursors of various metals are mostly reduced using sodium
borohydride, ascorbic acid, or hydrogen as reducing agents.
12
Precursors can also be reduced directly on the unmodied
cellulose surface with hydroxy groups or modied nanoparticle
surfaces with, e.g., aldehyde or thiol groups.
12
The effort for
a
Technische Universit¨
at Berlin, Department of Chemistry, TC8, Straße des 17. Juni 124,
10623, Berlin, Germany. E-mail: ms@chem.tu-berlin.de
b
Leibniz Institute for Catalysis, Albert-Einstein-Straße 29a, 18059, Rostock, Germany
c
Institute for Solar Fuels, Helmholtz-Zentrum Berlin f¨
ur Materialien und Energie
GmbH, Hahn-Meitner-Platz 1, 14109, Berlin, Germany
d
Institute for Active Polymers, Helmholtz-Zentrum Hereon, Kantstrasse 55, 14513,
Teltow, Germany
Cite this: RSC Adv., 2022, 12,30860
Received 1st September 2022
Accepted 19th October 2022
DOI: 10.1039/d2ra05507d
rsc.li/rsc-advances
30860 |RSC Adv., 2022, 12,30860–30870 © 2022 The Author(s). Published by the Royal Society of Chemistry
RSC Advances
PAPER
Open Access Article. Published on 28 October 2022. Downloaded on 1/11/2023 10:44:01 AM.
This article is licensed under a
Creative Commons Attribution 3.0 Unported Licence.
View Article Online
View Journal
| View Issue

nanoparticle deposition onto unmodied cellulose nano-
particle surfaces depends on the element and its precursor. The
deposition of gold and silver nanoparticles is not elaborate.
Their precursors, chloroauric acid and silver nitrate, are
reduced by heating at 80–120 °C.
13,14
Reducing hexa-
chloroplatinic acid by the surface hydroxy groups of cellulose is
more challenging as an autoclave and supercritical carbon
dioxide are required.
15
The phenomenon of photodeposition describes the
irradiation-induced reduction of a metal salt precursor in the
presence of a reducing agent. It is also referred to as photore-
duction and photochemical deposition. The photodeposition of
metal nanoparticles is widely known when immobilizing them
onto semiconductors such as titanium dioxide, tungsten oxide,
zinc oxide, or cadmium sulde, stating the necessity of the band
gap for the deposition mechanism.
16
This contribution and the
literature show that the necessity of a semiconductor is not true
for all metal salt precursors. Nanoparticles from dissolved
hexachloroplatinic acid (H
2
PtCl
6
), chloroauric acid (HAuCl
4
),
silver perchlorate (AgClO
4
) and the chelate complex copper
acetylacetonate (Cu(acac)
2
) can be directly photochemically
synthesized in a solution or dispersion with support. Alcohols
like ethanol and methanol are frequently used for the deposi-
tion of silver and platinum nanoparticles.
17
Since alcohols can
be used as a reducing agent and solvent simultaneously, the
photodeposition turns out to be a very simple and green
method. This contribution investigates the photodeposition of
platinum nanoparticles onto cellulose, which is a popular
method for the in situ immobilization of metal nanoparticles as
co-catalyst in photocatalytic water splitting,
18
as catalysts for the
hydrogen of para-nitrophenol (PNP). The hydrogenation of PNP
to para-aminophenol (PAP) is a common reaction in the phar-
maceutical industry, e.g., for the synthesis of the painkiller
paracetamol,
19
the cough expectorant ambroxol,
20
and the anti-
cancer drug sorafenib.
21
PNP can be hydrogenated with
molecular hydrogen, but only at elevated pressures above 20
bar.
22
Due to the high pressure and the possibility of the
formation of explosive gas mixtures, safety measurements and
trained personnel are required. Therefore, alternative hydroge-
nation reactions have been investigated, such as transfer,
photocatalytic or electrocatalytic hydrogenation. The choice of
the hydrogen donor depends on the reaction type. Sodium
borohydride (NaBH
4
)isoen used in transfer hydrogenations
in the liquid phase for catalyst testing,
23
alcohols like methanol
and ethanol are applied in photocatalytic hydrogenations,
24
and
water is used in the electrocatalytic hydrogenation. To study the
catalytic performance of the as-prepared cellulose-supported Pt
catalysts, the transfer-hydrogenation of PNP with NaBH
4
was
selected as the model reaction, because the reaction progress
can be easily followed by UV-vis spectrometry. Two catalysts
with different loadings were prepared via the photodeposition
method and characterized. The catalytic activity was deter-
mined under different operating conditions and evaluated
based on the catalyst preparation. For comparison, a commer-
cial alumina-supported Pt catalyst was selected, too. In addi-
tion, hydrogen from electrochemical water-splitting was used in
situ for the reduction of PNP as proof of both an alternative
hydrogenation pathway and the possibility to apply the
cellulose-supported platinum catalyst in an electrochemical
reaction system.
2. Experimental part
2.1 Chemicals
For the preparation of the cellulose modication, the unmodi-
ed cellulose (UnCe), isolated from Styela Clava (Otto-Van-den-
Berg-Company), and sulfuric acid (H
2
SO
4
, 96 wt%, $99%, Roth)
were used. For the deposition of platinum nanoparticles onto
cellulose, hexachloroplatinic acid solution (H
2
PtCl
6
, 8 wt% in
H
2
O, Sigma Aldrich) was used as the precursor. For hydroge-
nation experiments, para-nitrophenol (PNP, $99%, Roth),
sodium borohydride (NaBH
4
, 98%, Sigma Aldrich), sodium
hydroxide (NaOH, 99%, Roth), and platinum on alumina
(Pt@Al
2
O
3
, 1 wt%, Alfa Aesar) were used. The platinum ICP
standard (1000 mg L
−1
, Sigma Aldrich), hydrogen chloride (HCl,
37 wt%, 99%, Roth), and nitric acid (HNO
3
, 68 wt%, 99%, Roth)
were used for sample preparation and analysis. All chemicals
were used without further modication.
2.2 Isolation of cellulose nanomaterials
The synthesis of modied cellulose (ModCe) by sulfuric acid
hydrolysis was conducted by a method reported by van den Berg
et al. with slight modications.
25
Under vigorous stirring,
concentrated H
2
SO
4
(120 mL) was slowly added to UnCe (4.5 g)
and dispersed in water (120 mL) at 4 °C in a double-walled glass
reactor (maximum volume 600 mL). The temperature was
controlled by a thermostat (F6 C25, Haake). The temperature
was increased to 60 °C, and the solution was stirred for 2 hours
before it was cooled down again to 4 °C. The obtained
suspension was ltered and washed over a small-pore glass
fritted lter until the pH became neutral. The residue was
freeze-dried (Alpha 1–4, Christ) for three days. It should be
mentioned that the treatment of cellulose is a sensitive process
and the result depends strongly on the experimental conditions
(temperature, time, sulphuric acid concentration). The degree
of functionalization is <1%, but this is sufficient to make the
cellulose more hydrophilic and better dispersible.
2.3 Photodeposition of platinum nanoparticles
Two Pt@ModCe catalysts were prepared via photodeposition
(PD) and are referred to as PDPt1 and PDPt2. For the photo-
deposition of platinum nanoparticles, H
2
PtCl
6
(843 mg for
PDPt1 and 131 mg for PDPt2) was placed in a round bottom
ask. The ModCe dispersion (2.5 g L
−1
, 200 mL, V
MeOH
/V
water
=
70/30) was added, and the mixture was purged with nitrogen for
15 min. The dispersions were irradiated by a 300 W Xe lamp
(Quantum Design Europe) with the following conditions: no
lter (i.e. full spectra) for 30 min in case PDPt1 and with 395 nm
long-pass cut-offlter and for 105 min in the case PDPt2. The
distance between the lamp and the ask was always 10 cm. The
prepared catalysts were ltered, washed with water, and freeze-
dried.
© 2022 The Author(s). Published by the Royal Society of Chemistry RSC Adv., 2022, 12,30860–30870 | 30861
Paper RSC Advances
Open Access Article. Published on 28 October 2022. Downloaded on 1/11/2023 10:44:01 AM.
This article is licensed under a
Creative Commons Attribution 3.0 Unported Licence.
View Article Online

2.4 Catalyst characterization
2.4.1 ICP-OES. Pt loadings of Pt@ModCe catalysts were
determined from inductively coupled plasma atomic emission
spectroscopy (ICP-OES) using a Varian 715 ES spectrometer
(Agilent Technologies). The setup calibration was done with
platinum standard solutions with concentrations of 2.5 ppm,
5 ppm, 10 ppm, 20 ppm, and 25 ppm. The nanoparticles from
the catalysts were dissolved overnight by adding a mixture of
HCl, HNO
3
, and H
2
SO
4
(10 mL, V/V/V=3/1/1) to the sample (20
mg). Aer this time, ModCe was ltered off, and the solution
was diluted with water up to 50 mL. 5 mL of this solution were
taken and further diluted up to 15 mL. The catalyst loading was
calculated from the prepared sample solution's measured
platinum concentration. Catalysts used in transfer-
hydrogenation reactions were ltered and washed before ICP-
OES measurements.
2.4.2 TEM and diffraction pattern. To investigate the
morphology, size distribution, and crystallinity of the
Pt@ModCe catalysts, recordings using transmittance electron
microscopy (TEM) with the TECNAI G220 (FEI company, USA,
operated at 200 kV, with LaB6 electron emitter) were taken. The
TECNAI device did direct recordings of diffraction patterns. The
size distributions of platinum nanoparticles were generated by
measuring the nanoparticle size in the TEM images using the
image processing and acquisition soware Digital Micrograph
from Gatan Inc. (Version 3.43.3213.0). The data analysis and
visualization program QTiPlot (Version 5.12.8) was used to t
the size distribution curves.
2.5 Hydrogenation of para-nitrophenol
The catalysts PDPt1 and PDPt2 were used to reduce para-
nitrophenol with sodium borohydride as the hydrogen donor.
The reaction was monitored with a UV-vis spectrometer
(Lambda 35, PerkinElmer) with the method “Timedrive Lambda
35”(l=400 nm, time interval 2 s). Stock suspensions of the
Pt@ModCe catalysts PDPt1 and PDPt2 (1 g L
−1
,V
MeOH
/V
water
=
70/30), PNP (1 mM), and NaOH (4 g L
−1
in MeOH and H
2
O) were
prepared.
The reaction solution was stirred with a mixed drive (2mag
cuvetteMIXdrive) and mix control (2mag MIXcontrol eco
Control Unit) unit from 2mg-USA. NaBH
4
(115 mg) was placed
into a UV-vis cuvette for a standard reaction. Next, the aqueous
PNP solution (100 mL) and an aqueous MeOH solution (V
MeOH
/
V
water
=70/30) was added and stirred until the NaBH
4
was
dissolved. The measurement program was started, and the
reaction was initiated by adding the Pt@ModCe dispersion
(0.25 mL of PDPt, 1.0 mL of PDPt2). The MeOH fraction and the
catalyst amount were varied, and each experiment was con-
ducted three times. A pseudo-rst-order reaction law eqn (1)
was assumed to evaluate the reaction performance, where c
PNP
is the concentration of PNP, tthe time, and kis the reaction rate
constant. The linearized form (eqn (2)) was used to obtain the
reaction rate constant.
dcPNP
dt¼kcPNP (1)
lncPNP
c0;PNP¼kt (2)
The absorption intensity Iof the solution is proportional to the
concentration of PNP for low concentrated solutions where the
Lambert–Beer law is applicable. Eqn (2) can thus be written as:
lnI
I0¼kt (3)
The activity Aof the catalyst was calculated as follows:
A¼nPNP
mPtt(4)
The p-nitrophenol amount is n
PNP
,m
Pt
is the mass of plat-
inum nanoparticles, and tis the time. The reaction rate
constant and catalyst activity were determined for a reaction
time of 400 s.
Electrochemical measurements were performed in
a commercial Micro Flow Cell (ElectroCell) under three-
electrode conguration using a VersaSTAT 3 potentiostat/
galvanostat (AMETEK). Uncompensated resistance was ob-
tained from impedance measurements, and iR corrections were
performed to the applied voltage. A Pt cathode (Pt foil, 0.05 mm
thick, Premion®, 99.99%, Thermo Scientic) was used as the
working electrode with a geometric active area of 10 cm
2
. The
counter electrode was a dimensionally stable anode (DSA®),
and the reference electrode was a leak-free Ag/AgCl (3.4 M KCl)
electrode (LF-1, Innovative Instruments Ltd). A cation exchange
membrane (NRE-212, Naon™, thickness 0.002 inches) was
placed between the anolyte and the catholyte chambers. The
anolyte was 1 M potassium phosphate (KP
i
)buffer solution (pH
=7), and the catholyte was either 1 M KP
i
with added 0.03 mM
of p-nitrophenol (1 M KP
i
+ PNP) or 1 M KP
i
with 0.03 mM of p-
nitrophenol and 0.08 g L
−1
of PDPt1 catalyst (1 M KP
i
+ PNP +
PDPt1). Both the anolyte and catholyte solutions (100 mL) were
continuously degassed with Ar during the electrochemical
measurements to prevent oxygen contamination. The solutions
were circulated by two peristaltic pumps (TBE/200, MDX Bio-
technik International GmbH) with a ow rate of 120 mL min
−1
.
Galvanostatic measurements were performed at a current
density of −2mAcm
−2
for 2 hours. 1 mL of the electrolyte were
collected periodically through a septum located right aer the
outlet of the catholyte, and the progress of the hydrogenation
reaction was monitored by UV-vis spectroscopy (vide supra).
The 1 M KP
i
buffer solutions were prepared used KH
2
PO
4
($99.0%, Sigma-Aldrich) and K
2
HPO
4
$3H
2
O($99.0%, Sigma-
Aldrich). The water used in all experiments was obtained from
a Milli-Q Integral system with a resistivity of 18.2 MUcm.
3. Results and discussion
3.1 Catalyst preparation and characterization
The catalysts were characterized by their loadings, nanoparticle
sizes and size distributions, and crystallinity. The values are
30862 |RSC Adv., 2022, 12,30860–30870 © 2022 The Author(s). Published by the Royal Society of Chemistry
RSC Advances Paper
Open Access Article. Published on 28 October 2022. Downloaded on 1/11/2023 10:44:01 AM.
This article is licensed under a
Creative Commons Attribution 3.0 Unported Licence.
View Article Online

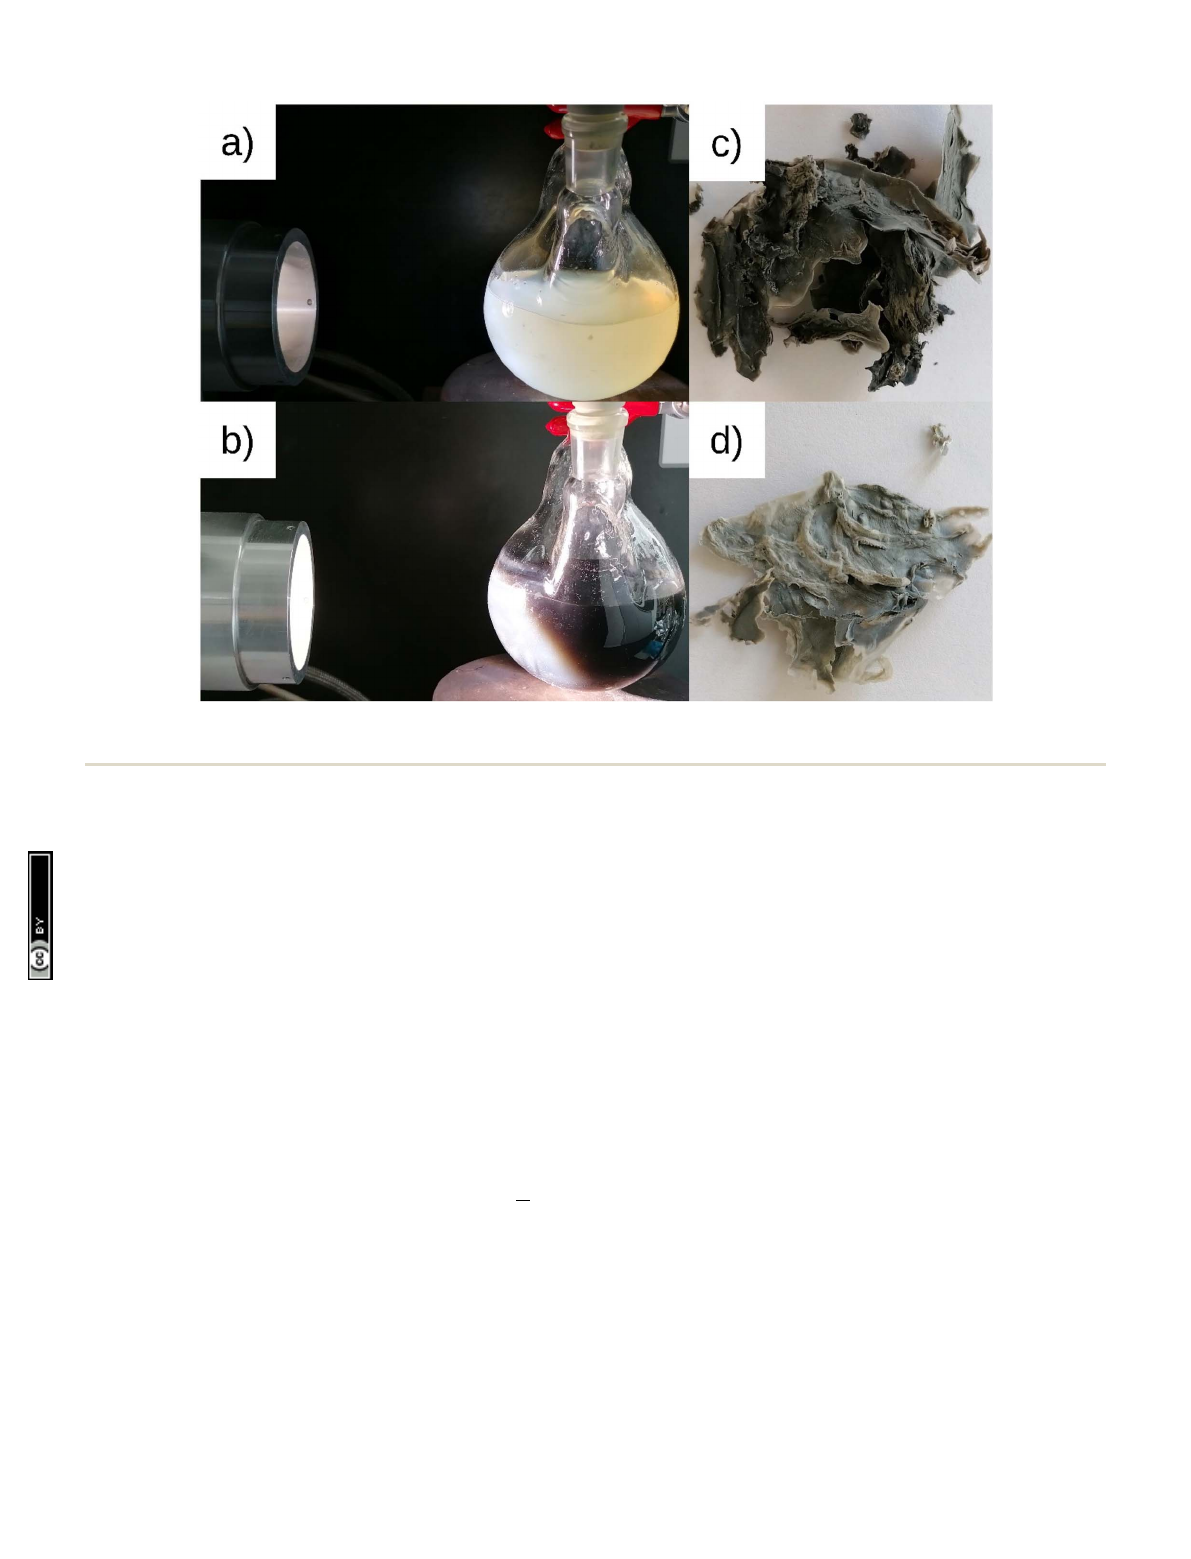
listed in Tables 1 and 2. Fig. 1 shows the catalyst preparation
with photodeposited platinum nanoparticles on cellulose and
the resulting catalysts PDPt1 and PDPt2. The precursor
suspension (Fig. 1a) has a pale-yellow color, which turns to dark
grey (Fig. 1b), indicating the formation of platinum particles.
The determined platinum loadings are 2.7% for PDPt1 and
0.8% for PDPt2, with corresponding deposition yields of 42%
and 80%, respectively. The difference in deposition yields
probably originates from different irradiation periods (30 min
vs. 105 min). However, it is also known that support properties
and the interaction between support and nanoparticles are
important for the deposition process. Schröder et al. used the
photodepostion method to immobilize Pt nanoparticles onto
carbon nitride, and the deposition yields were below 10%.
26,27
The support effect in the deposition of metal nanoparticles was
studied by Parapat et al.
28
using a colloidal deposition method,
showing that with an appropriate support, high deposition
yields can be obtained. Here, the loading is relatively high
(>40%), showing that cellulose can be used as a support mate-
rial for the deposition of Pt nanoparticles. Further, the higher
deposition yield for PDPt2 can be explained by using a cut-off
lter. When using the full spectrum for the photodeposition
process, the reduction of the platinum salt is fast. It produces
many nanoparticles in the liquid phase, having less time to
deposit onto the cellulose surface. In contrast, the reduction is
much slower with the lter, so the deposition is more efficient.
The Pt@ModCe catalysts were characterized by TEM (Fig. 2a,
c, and e), showing round-shaped nanoparticles of PDPt1, PDPt2,
and Pt@Al
2
O
3
, and the particle sizes and size distributions were
obtained from these images (Fig. 2b, d, and f). PDPt2 shows
a smaller average particle size of 2.3 nm than PDPt1 with
4.6 nm. The difference in average particle size originates from
the precursor concentration (128 mgL
−1
for PDPt2 and 822 mg
L
−1
for PDPt2), which was also shown in earlier publications.
16,29
The particle size variation of PDPt1 and PDPt2 is with a value of
0.9 nm, identical and independent from the precursor
concentration. The average particle size of platinum particles of
the commercial catalyst Pt@Al
2
O
3
is 5.8 nm, signicantly larger
than the PDPt2 and slightly larger than the PDPt1 particles. The
particle size variation of 1.3 nm is slightly larger than that of
PDPt1 and PDPt2. The crystallinity of platinum nanoparticles
was investigated by determining the Miller indices of the lattice
planes through the diffraction patterns recorded for PDPt1,
PDPt2, and Pt@Al
2
O
3,
as shown in Fig. 3. The electron diffrac-
tion of polycrystalline materials leads to diffraction patterns
with sharp rings. The reciprocal lattice value 1/ris the radius of
these rings and was measured to calculate the plane distance d.
The lattice plane distance is the characteristic value for each
crystal composition's lattice plane and was determined by the
internal database of the TEM devices (JCPDS 46-1043 and 04-
0802). The values 1/r,d, and Miller indices are listed in Table 2.
For all platinum crystals, at least the two Miller indices (111)
and (200), and sometimes additionally (220), were identied. In
the diffraction patterns of Pt@Al
2
O
3
, the aluminum oxide
reexes can overlay platinum's reexes because the lattice plane
distances are similar. However, since no other typical reexes of
platinum are found, the same lattice plane distances can be
assumed. The combination of the Miller indices of the lattice
planes indicates a face-centered cubic lattice structure (fcc) of
platinum nanocrystals, which is also the characteristic lattice
structure of platinum.
30,31
Consequently, the deposition method
does not inuence the crystallinity when platinum nano-
particles are formed. The photodeposition of platinum nano-
particles on a non-semiconductor like cellulose provides
nanoparticles with platinum-characteristic fcc lattice structure
in small, narrow distributed sizes. Best deposition yield and
smallest nanoparticles were obtained with low precursor
concentration.
3.2 Hydrogenation of PNP
3.2.1 Reaction progress and data evaluation. The p-nitro-
phenol (PNP) reduction to p-aminophenol (PAP) is frequently
used as a model reaction to investigate heterogeneous catalysts
whereby sodium borohydride is used as the hydrogen donor for
the transfer hydrogenation reaction that proceeds in water at
high pH values.
11,23
This reaction was used for catalyst testing of
Table 1 Overview of the average particle sizes d
NP
, the variance of the particle size s, theoretical loading, loadings determined by ICP-OES, and
the resulting deposition yield
Catalyst t
irradiation
(min)
Cut-offlter
(nm) d
NP
(nm) s(nm)
Theoretical loading
(wt%) Loading (wt%)
Deposition yield
(%)
PDPt1 30 None 4.6 0.9 6.4 2.7 42
PDPt2 105 395 2.3 0.9 1.0 0.8 80
Pt@Al
2
O
3
——5.8 1.3 1.0
a
——
a
Catalyst loading according to the product sheet.
Table 2 Overview of the measured reciprocal lattice value 1/r, the
calculated lattice plane distance d, and the determined Miller indices
hkl for the platinum catalysts
Catalyst 1/r(nm
−1
)d(˚
A) Dd(˚
A) hkl
PDPt1 4.4 2.3 0.1 (111)
5.1 2.0 0.1 (200)
7.2 1.4 0.1 (220)
PDPt2 4.5 2.2 0.1 (111)
5.2 1.9 0.1 (200)
7.2 1.4 0.1 (220)
Pt@Al
2
O
3
4.4 2.3 0.1 (111)
5.1 2.0 0.1 (200)
7.3 1.4 0.1 (220)
© 2022 The Author(s). Published by the Royal Society of Chemistry RSC Adv., 2022, 12,30860–30870 | 30863
Paper RSC Advances
Open Access Article. Published on 28 October 2022. Downloaded on 1/11/2023 10:44:01 AM.
This article is licensed under a
Creative Commons Attribution 3.0 Unported Licence.
View Article Online
the photodeposition-prepared PDPt1 and PDPt2 and the
commercial Pt@Al
2
O
3
catalyst as the reference. The reduction
of the nitro group proceeds over two intermediates (Fig. 4a).
First, the NaBH
4
deprotonates the hydroxyl group of PNP to p-
nitrophenolate (PNPT), causing the shiof its absorption
maximum from 315 nm to 400 nm, as shown in Fig. 4b. That
enables the monitoring of the reaction via UV-vis spectroscopy.
Second, the nitro group is reduced to p-aminophenolate (PAPT)
in three steps. In each step, two hydrogens (a hydride and
a proton) are transferred.
11
Finally, with the complete decom-
position of NaBH
4
and the neutralization of the solution, PAPT
is protonated to PAP. The obtained data for an experiment was
plotted as an absorbance–time diagram (Fig. 4c). The maximum
of the curve occurs aer the catalyst was added and was marked
as time t=0 for further evaluation with eqn (3). The absorbance
at t=0 was I
0
. The data was then plotted in an lnI
I0-time
diagram (Fig. 4d). The slope of the regression line was the rate
constant k.
3.2.2 Impact of reaction solvent. Unmodied cellulose can
not be dispersed in polar solvents like water or methanol;
therefore, it was modied by sulphuric acid treatment. Aer
this modication, cellulose can be dispersed. However, the
solvent still inuences the homogeneity, as shown in Fig. 5. The
best dispersion of cellulose is obtained for a mixture of meth-
anol and water with a methanol content of about 70 vol%
(Fig. 5b). For pure water (Fig. 5a), the dispersion is quite
homogenous. However, in the case of pure methanol (Fig. 5c),
an inhomogeneous dispersion is obtained.
In the investigation of how the solvent inuences the cata-
lytic activity and to select the solvent system for the following
experiments, the methanol fraction was varied in the range 4–
96 vol%. The reaction rate constant kand the activity A were
determined as described in Section 3.2.1 and plotted in Fig. 6
against the methanol volume fraction 4.
For the high-loaded PDPt1 (2.7 wt% Pt), the reaction rate
constant and the activity do not change with variation of the
methanol fraction. For the low loaded PDPt2 (0.8 wt% Pt), the
reaction rate constant and the activity are slightly lower for
a methanol fraction of 92 vol%. The latter is probably due to the
limitation of mass transport caused by the swelled cellulose,
increasing the viscosity of the solution. The platinum concen-
trations with 11 mM for PDPt1 and 3 mM for PDPt2 for the
reduction of 33 mM PNP are considerably high, providing
sufficient activity centers to lower or, in the case of PDPt1, avoid
the impact of the cellulose swelling on the reaction rate.
However, the overall impact of cellulose swelling with
increasing methanol fraction on reaction rate and activity is
negligible. The activity values of PDPt2 are generally higher than
those of PDPt1 because of the lower loading of PDPt2 and,
therefore, lower Pt concentration. The mean activity of PDPt2 is
about 3 mmol g
−1
min
−1
which is about 1.7 times higher than
Fig. 1 ModCe dispersion with precursor at the beginning (a) and end (b) of platinum nanoparticles photodeposition process leading to the
Pt@ModCe catalysts PDPt1 (c) and PDPt2 (d).
30864 |RSC Adv., 2022, 12,30860–30870 © 2022 The Author(s). Published by the Royal Society of Chemistry
RSC Advances Paper
Open Access Article. Published on 28 October 2022. Downloaded on 1/11/2023 10:44:01 AM.
This article is licensed under a
Creative Commons Attribution 3.0 Unported Licence.
View Article Online
Loading more pages...