
Content from this work may be used under the terms of theCreativeCommonsAttribution 3.0 licence. Any further distribution
of this work must maintain attribution to the author(s) and the title of the work, journal citation and DOI.
Published under licence by IOP Publishing Ltd
ISROMAC18
Journal of Physics: Conference Series 1909 (2021) 012061
IOP Publishing
doi:10.1088/1742-6596/1909/1/012061
1
Experimental determination of turbocharger heat
flows for validation of a power separation approach
Philipp Brodbeck
Research Assistant, Department of Powertrain Technologies, Technische Universit¨at Berlin,
Carnotstr. 1A, 10587 Berlin, Germany
E-mail: [email protected]
Abstract. This work presents a new method to measure the heat flow from a turbocharger
to the ambient air. The experimental setup, performed on a hot gas test bench, includes an
insulated box with two openings, encapsulating the turbocharger. These openings enable a
controlled air flow through the box, which is measured at the inlet duct of the box. With
temperature measurements at the inlet and outlet of the box, the quantitative heat flow
can be calculated. With this information, an approach to estimate those heat flows from
standard turbocharger test bench measurements can be validated and refined. The performed
measurements at different turbine inlet temperatures and turbine mass flows show a good
conformity with expected heat flows. Due to convective and radiative effects, the heat flows
increase with both turbine mass flow and turbine inlet temperature. However, the setup with
the insulated box has an effect on the overall thermal conditions, since the convection around
the turbocharger decreases if the specimen is not as exposed as in common test bench setups.
1. Introduction
The precise prediction of turbocharged engine performance is a central element of automotive
powertrain design. Modelling of turbochargers in process simulation usually relies on maps
of stationary operating points, which are measured on hot gas test benches with standardized
conditions. But the thermodynamic description of the turbocharger behavior is sensitive to
the thermal conditions, which distort the isentropic efficiencies significantly on the turbine side.
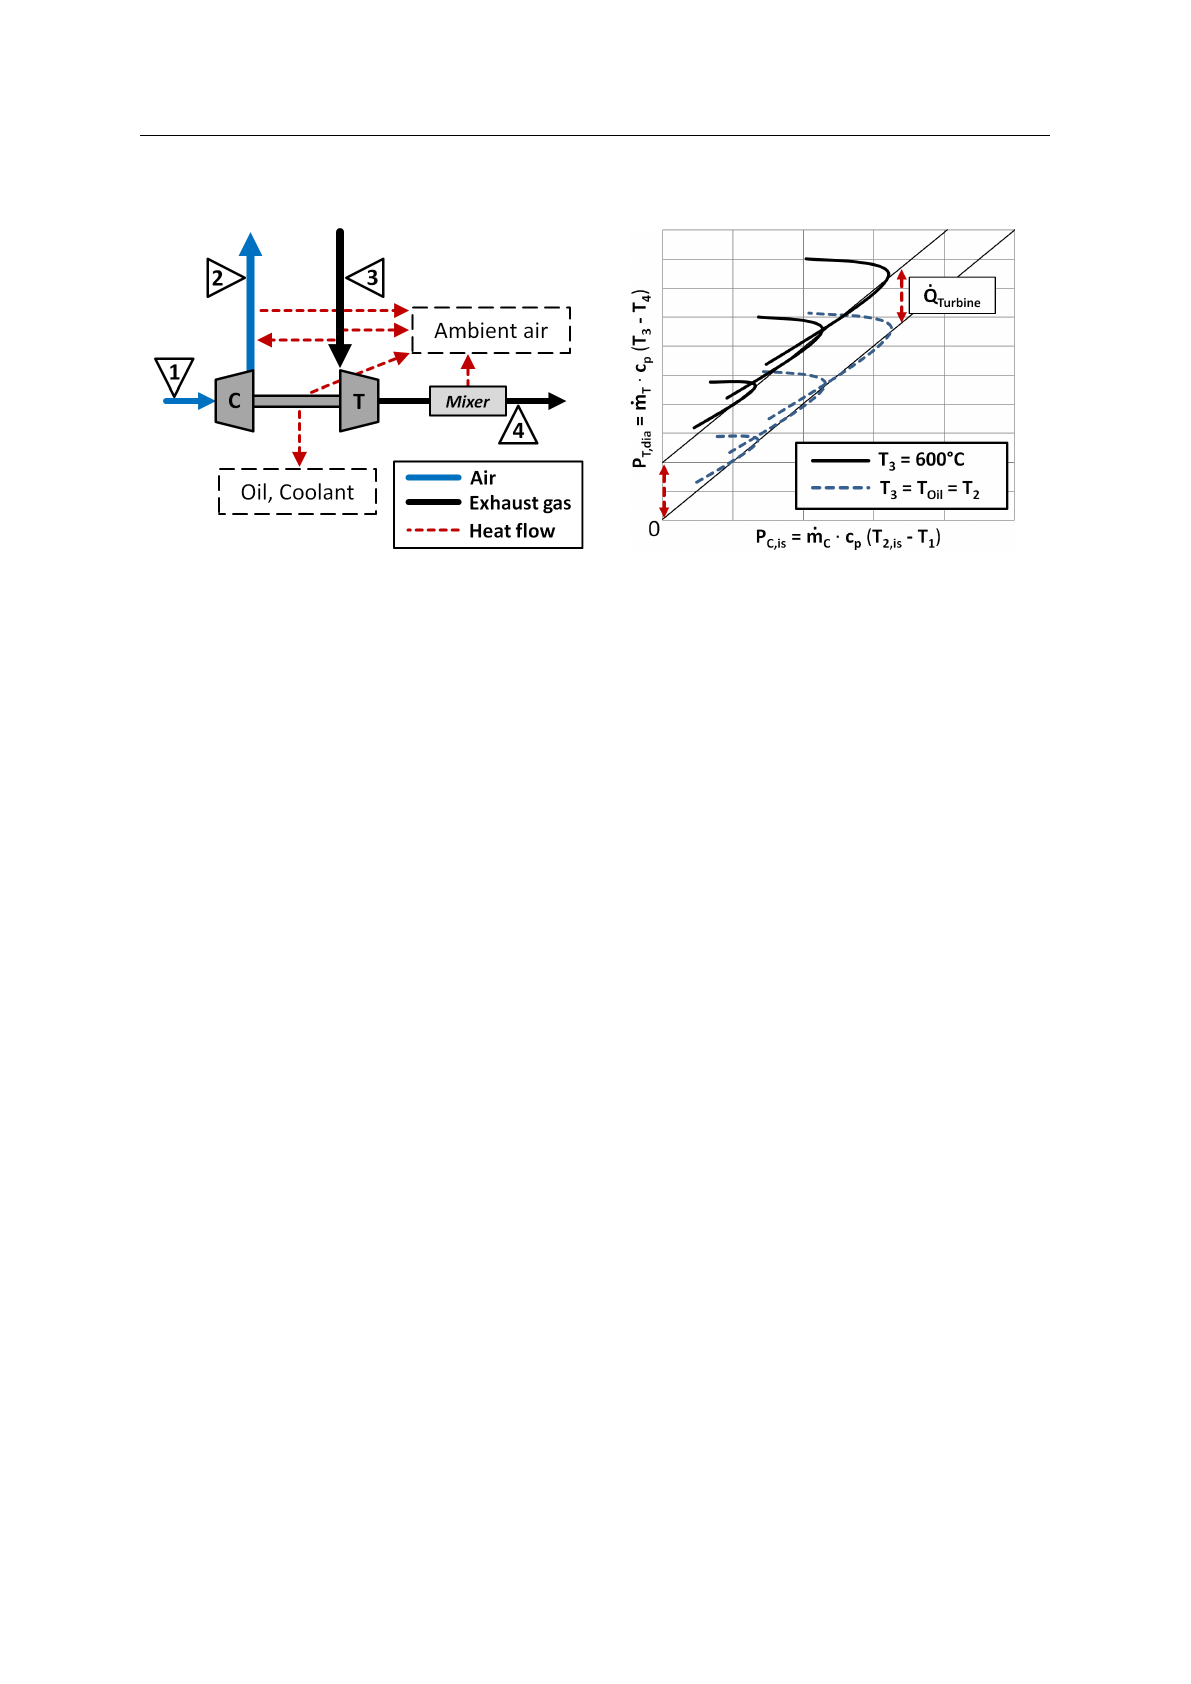
This is caused by heat flows between turbine and compressor gases, oil, cooling liquid, and the
surrounding air, see Figure 1, which cannot be prevented by the duct insulation commonly used
at test benches. At low rotor speed and pressure ratios, this can result in calculated isentropic
turbine efficiencies greater than one, which is a violation of the first law of thermodynamics.
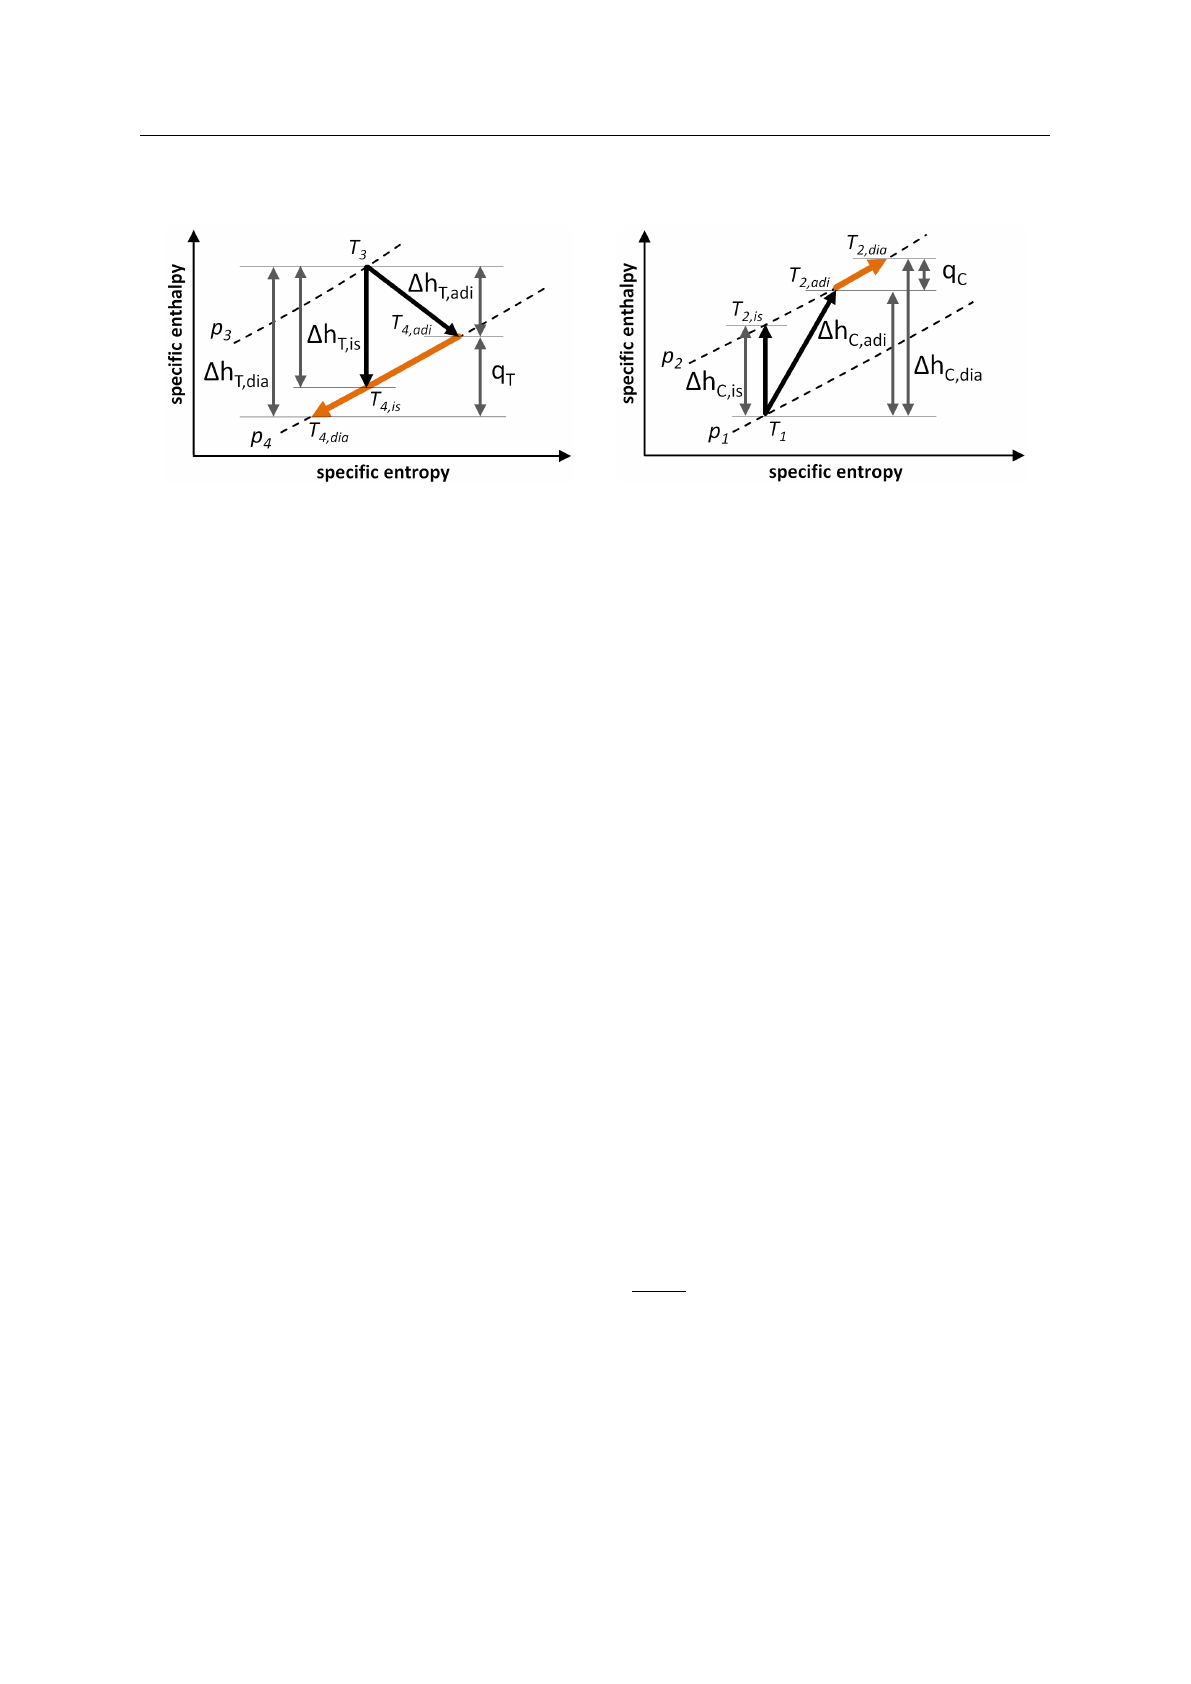
The process of expansion within the turbine at low rotor speed is shown in Figure 3. The
temperature under diabatic conditions T4,dia is the one measured at the test bench, but the
temperature, which would be obtained under adiabatic conditions T4,adi is the one of interest
and the relevant value to calculate the correct isentropic turbine efficiency. Hence, the turbine
efficiency is usually defined as the ratio of compressor power and isentropic turbine power [1]
to avoid the temperature measurement at the turbine outlet. Although thermal distortions are
mostly averted this way, turbine efficiency and the mechanical efficiency are inseparably merged
in one coefficient, which has a negative influence on the results calculated with map based
turbocharger models in process simulation. Turbocharger rotation speed and turbine outflow
ISROMAC18
Journal of Physics: Conference Series 1909 (2021) 012061
IOP Publishing
doi:10.1088/1742-6596/1909/1/012061
2
Figure 1. Scheme of turbocharger test
bench and occurring heat flows within
the measurement plane boundaries.
Figure 2. Turbine power curves under hot and
adiabatic conditions (schematic).
temperature prediction are particularly difficult with conventional maps, if the turbine inlet
temperature is different from the 600◦C as prescribed in the standard test bench code.
Methods to correct the thermodynamic performance of turbine and compressor have been
developed in previous works, for example by L¨uddecke [2] et. al. However, the described method
requires significantly increased experimental effort, which is hardly reasonable for non-research
users. A potentially more accessible method to separate the aerodynamic power of turbine
and compressor as well as the bearing friction losses from the occurring heat flows has been
developed by Baar [3] et al. This approach can be conducted with any turbocharger test bench
data, only a reliable method to measure the turbine outflow temperature is mandatory. At
the chair of powertrain technologies, this is done with a static flow mixer placed in the turbine
outlet pipe between the turbine and the respective measurement plane to create a uniform
temperature distribution across the turbine outlet duct. The turbine outlet temperature is
required to calculate the diabatic turbine power, which can be correlated with the isentropic
compressor power as shown in Figure 2. Previous works from Savic [4] et al. have shown,
that the interpolated line through the respective compressor power maxima of each speed line
intersects the turbine power axis at a value, which corresponds to the total amount of heat
transferred from the exhaust gas to other turbocharger parts and the ambient air. This theory
is supported by turbocharger test bench data, which has been recorded with close to adiabatic
conditions. The turbine inlet temperature and the mean oil temperature have been matched with
the compressor outlet temperature for those measurements to minimize the heat losses, especially
on the turbine side. As expected, the line interpolated through the isentropic compressor power
maxima intersects the y-axis close to zero since there are no significant heat losses, which
is schematically shown in Figure 2. The ’power-based approach’ has been developed on the
assumption, that the isentropic compressor power and the bearing friction are not dependent on
the turbine inlet temperature. The extra turbine power apparently needed under hot conditions
for the same compressor power output, can be traced back solely to the temperature T4, which is
distorted by heat losses. Hence, the diabatic turbine power measured under hot conditions can
be corrected by shifting the data downwards to match the adiabatic measurements and obtain
the pure aerodynamic turbine power using the equation
PT,adi = ˙mT·cp·(T3−T4)−˙
QT urbine (1)
where ˙mTis the turbine mass flow, cpis the specific heat capacity of exhaust gas and the
ISROMAC18
Journal of Physics: Conference Series 1909 (2021) 012061
IOP Publishing
doi:10.1088/1742-6596/1909/1/012061
3
Figure 3. Schematic thermodynamics of
turbine expansion process (total to static).
Figure 4. Schematic thermodynamics of
compression process (total to total).
temperature at the turbine inlet T3is the total temperature. The measurements under adiabatic
conditions are not mandatory to use the power-based approach. However, for validation
purposes, several adiabatic measurements on differently sized turbochargers have been conducted
prior to this investigation. The results showed a similar correlation between the diabatic and
adiabatic turbine power curves as displayed in Figure 2.
The power-based approach can also be applied on the diabatic compressor power to separate
it from any heat flow disturbances, which are generally small compared to the turbine side.
Previous investigations have shown, that the compression process is mainly influenced by added
heat from the exhaust gas side [5], which is schematically shown in Figure 4, and almost constant
across the compressor operation range. Higher temperatures at the compressor outlet cause an
underestimation of the isentropic compressor efficiency, hence the compressor power can be
corrected using
PC,adi = ˙mC·cp·(T2−T1)−˙
QCompressor (2)
where ˙mCis the compressor mass flow, cpis the specific heat capacity of air and T1and T2are
total temperatures. The heat flow ˙
QCompressor is obtained analogously by plotting the diabatic
compressor power correlated to the isentropic compressor power and shifting the data by the
occurring offset. The corrected values for turbine and compressor power can now be used to
calculate corrected efficiencies and the friction power as shown in the Equations 3 and 4. Using
corrected maps and an external input for the bearing friction in process simulation makes the
model independent of the overall thermal conditions. However, turbine and compressor perfor-
mance are still characterized thermodynamically, so the heat flows between the components and
the surrounding air have to be added as a sub model to receive the best results. This is done
with a network of thermal nodes with connections of convective, conductive and radiative heat
transfer to the respective parts.
ηT,is =PT,adi
PT,is
(3)
PF riction =PT,adi −PC,adi (4)
While the total heat losses of the turbocharger can be estimated with this approach, it cannot be
distinguished, how the individual heat flows are allocated between the components and ambient
air. Investigations with conjugate heat transfer (CHT) simulations have shown, that the latter
is a relatively large part of the total heat flow [5]. The heat flow box has been developed to
determine the exact amount of heat transferred from the turbocharger to the surrounding air
during stationary turbocharger operation. This information will help to clarify, if the offset
ISROMAC18
Journal of Physics: Conference Series 1909 (2021) 012061
IOP Publishing
doi:10.1088/1742-6596/1909/1/012061
4
between the turbine power charts in Figure 2 directly correlates to the external heat flows
measured. The dependency of external heat flow on turbine inlet temperature, turbine mass
flow and compressor load are also subjects of the investigation.
2. Experimental Setup
The test bench, which the turbocharger and heat flow box have been investigated on, complies
with international test bench standard codes such as the norm SAE J1826. Compressor and
turbine flow are separate, the turbine side is supplied with air by a screw compressor and
mixed with diesel fuel in a combustion chamber. The compressor load is controlled by two
valves arranged in parallel, a complete scheme of the test bench can be found in the appendix
Figure A1. The object of investigation is a turbocharger for a 2.0-liter engine of series production
with a variable geometry turbine, which is fully open for all tests. It is not water-cooled and the
oil is conditioned at 3 bars relative and 90◦C. As an addition, the turbocharger parts have been
equipped with a total of 21 thermocouples to record the outer surface temperature distribution
on the housing parts of turbine, bearings and compressor. The 1 mm thermocouple tips have
been glued or welded (depending on the expected temperature) into 1.5 mm drill holes in the
housing. This is not mandatory for the heat flow box measurement as a standalone system, but
gives an impression of the convective conditions between turbocharger and air. Housing wall
temperatures have also been recorded during the reference measurement, which was a standard
600◦C turbine inlet temperature map with the turbocharger exposed in the air-conditioned test
cell and insulated ducts within the measurement plane boundaries.
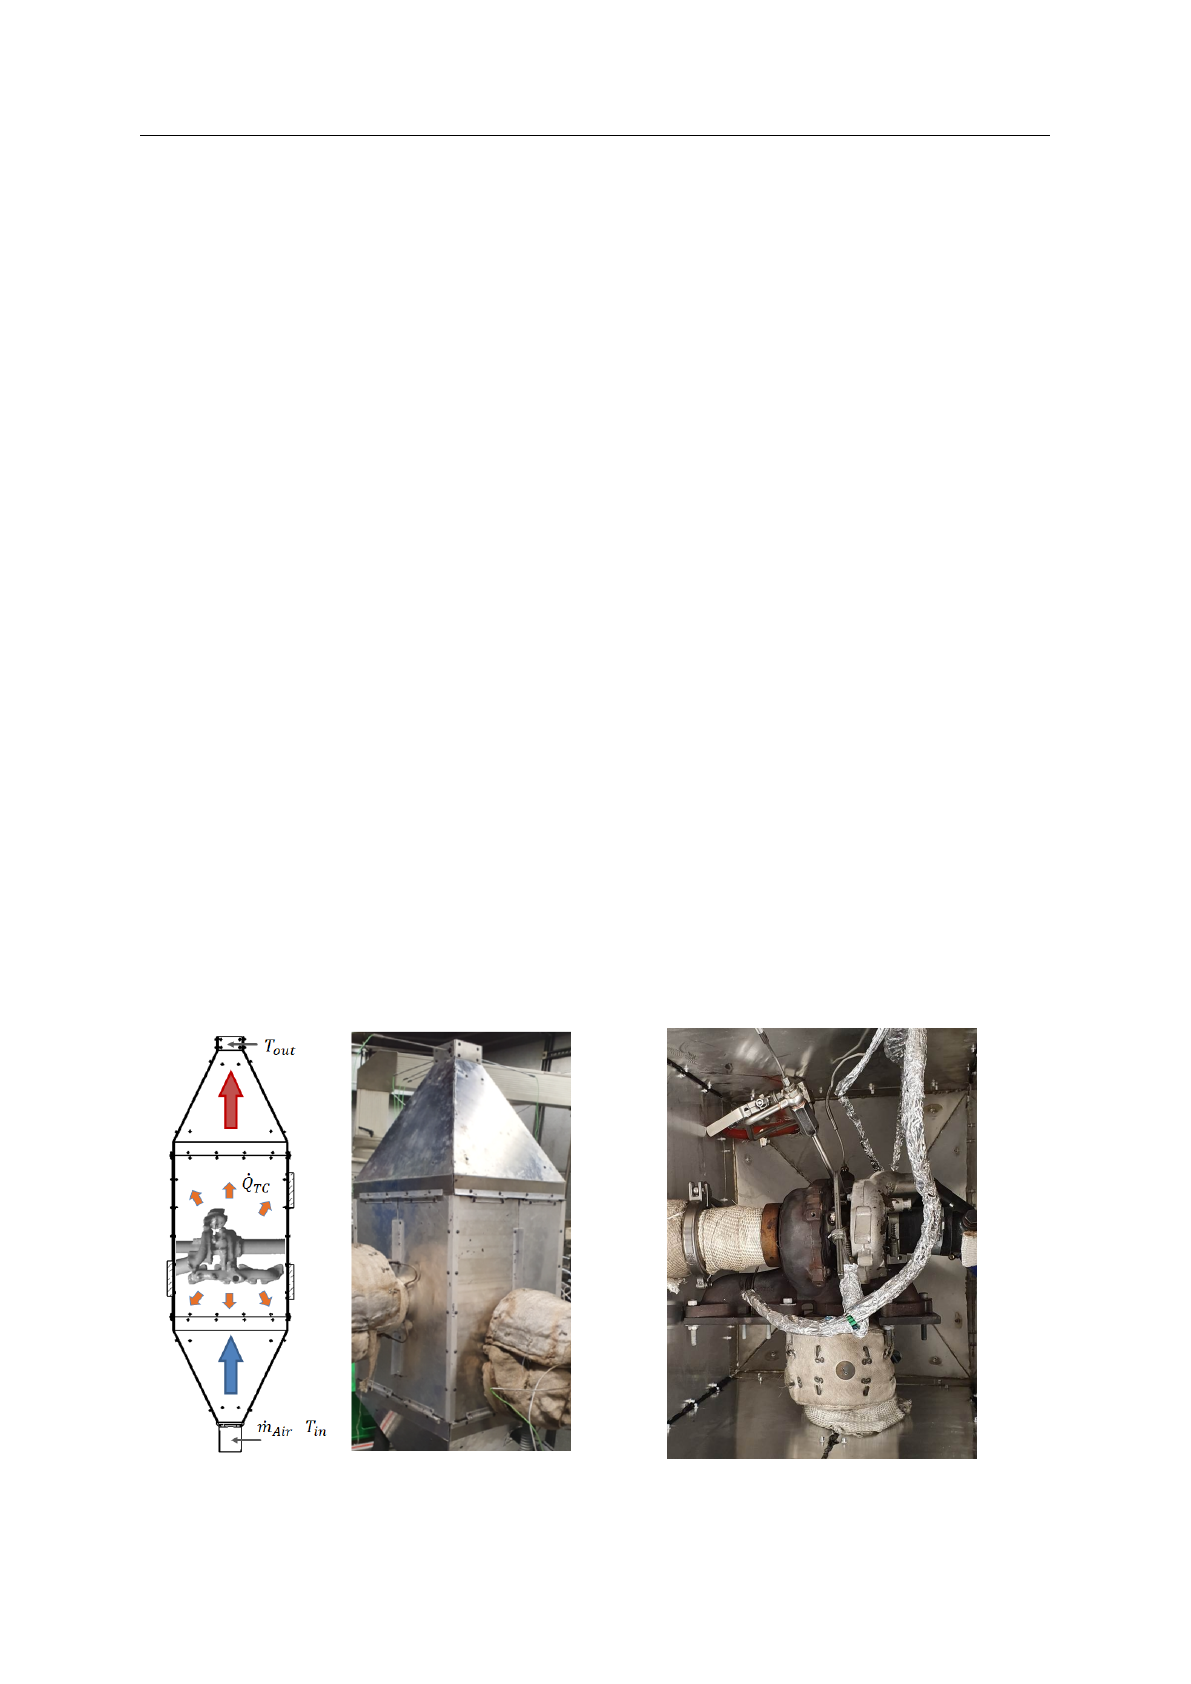
Computational fluid dynamics (CFD) has been used prior to the construction to optimize
the shape of the box. The air stream has to surround the whole turbocharger without creating
any recirculation. The box consists of two angular-shaped funnels with a cuboid in the middle,
which contains the turbocharger and its peripheral as seen in Figure 5. Natural convection,
caused by the hot turbocharger parts, creates a uniform air flow through the box from bottom
to top. The amount of air passing through the box is measured by a vortex flowmeter integrated
into the inlet pipe. The respective temperatures at the inlet and outlet are measured with
five thermocouples each, evenly distributed across the ducts. The rate of heat flow from the
Figure 5. Complete experimental setup,
concept and implementation.
Figure 6. Setup of turbocharger inside the box,
view from above.
ISROMAC18
Journal of Physics: Conference Series 1909 (2021) 012061
IOP Publishing
doi:10.1088/1742-6596/1909/1/012061
5
turbocharger to ambient air can be obtained using the equation
˙
QT C = ˙mHF B ·cp·(Tout −Tin) (5)
with the measured values as displayed in Figure 5. With a measurement accuracy of 1.5◦C
of the thermocouples and an accuracy of 1.5% of the vortex flowmeter, the mean accumulated
uncertainty of the calculated heat flow rate is ±6.5%, which is sufficient to prove the feasibility
of this novel measurement concept.
Each wall of the box consists of two layers of aluminum plating with an insulation layer in
between, to create a system which is close to adiabatic. The three layers are assembled with
threaded rivets and screws and built into an aluminum framework. The temperature on the
outer surface of the box is measured at ten evenly distributed points, to estimate the amount of
heat leaking through the system. The box has an orifice for each of the four gas ducts leading
to and away from turbine and compressor, two orifices for the oil system and one for electric
wiring, the whole assembly is showcased in Figure 5. The insulation on the ducts has been added
according to the reference measurement without the box to recreate the thermal conditions. The
same has been done with the insulation on the duct parts inside the box as seen in Figure 6,
which is a view on the turbocharger from the top without the lid on. The smoothed aluminum
walls on the inner side of the box serve as a reflector for the heat radiated mainly from the
turbine parts. All connected edges of the box are sealed with high-temperature silicone.
3. Results and Discussion
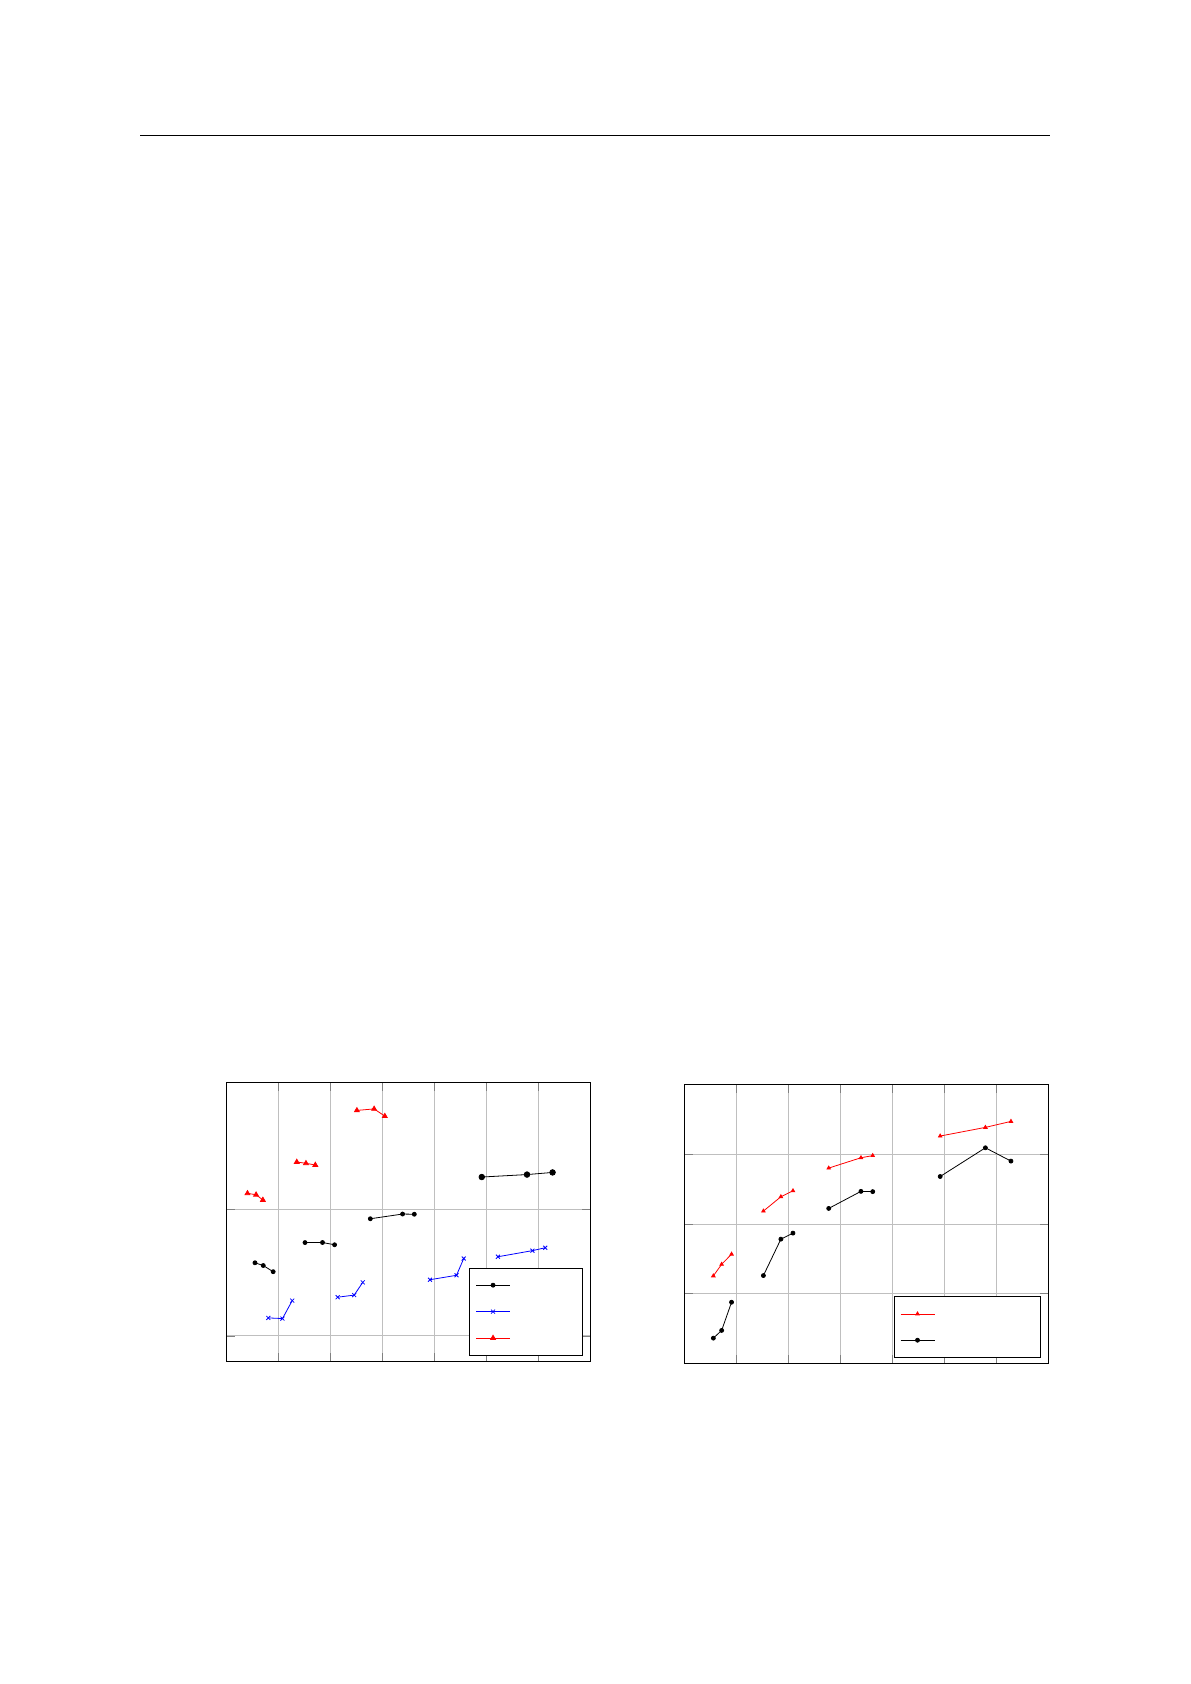
Measurement results are shown for three different turbine inlet temperatures of 400, 600 and
800 degrees Celsius. The operating points have been distributed across the standard compressor
map with three points on four different speed lines reaching from choke line to surge line. The
additional measurements include the air flow through the box and the temperature difference
between the inlet and the outlet of the box. The temperature difference is plotted in Figure 7.
It is visible, that the heat flow to ambient air seems to rise significantly with the turbine mass
flow. This complies with the turbine housing temperatures, which can be seen in Figure 8 for
a turbine inlet temperature of 600 degrees. The reason for that increase is a larger convective
heat flow from exhaust gas to housing at higher pressure and velocity. The gradients of the
100 200 300 400 500 600 700 800
50
100
150
˙mT urbine[kg ·h−1]
∆THF B[K]
600◦C
400◦C
800◦C
Figure 7. Temperature difference related to
turbine total mass flow for different turbine
inlet temperatures.
100 200 300 400 500 600 700 800
460
480
500
520
540
˙mT urbine[kg ·h−1]
TT H [K]
in HFB
Reference
Figure 8. Turbine housing temperature TT H ,
T3= 600◦C.
Loading more pages...