
Solid Earth, 13, 1673–1696, 2022
https://doi.org/10.5194/se-13-1673-2022
© Author(s) 2022. This work is distributed under
the Creative Commons Attribution 4.0 License.
Geophysical analysis of an area affected by subsurface dissolution –
case study of an inland salt marsh in northern Thuringia, Germany
Sonja H. Wadas1, Hermann Buness1, Raphael Rochlitz1, Peter Skiba1,2,, Thomas Günther1, Michael Grinat1,
David C. Tanner1, Ulrich Polom1, Gerald Gabriel1,3, and Charlotte M. Krawczyk4,5
1Leibniz Institute for Applied Geophysics, Stilleweg 2, 30655 Hanover, Germany
2Department 2.3 Groundwater Resources – Quality and Dynamics, Federal Institute for Geosciences and Natural Resources,
Stilleweg 2, 30655 Hanover, Germany
3Leibniz University Hanover, Institute of Geology, Callinstraße 30, 30167 Hanover, Germany
4GFZ, German Research Centre for Geosciences, Telegrafenberg, 14473 Potsdam, Germany
5Technical University Berlin, Institute for Applied Geosciences, Ernst-Reuter-Platz 1, 10587 Berlin, Germany
deceased
Correspondence: Sonja H. Wadas (sonja.w[email protected])
Received: 7 April 2022 – Discussion started: 2 May 2022
Revised: 15 September 2022 – Accepted: 25 September 2022 – Published: 2 November 2022
Abstract. The subsurface dissolution of soluble rocks can
affect areas over a long period of time and pose a severe
hazard. We show the benefits of a combined approach us-
ing P-wave and SH-wave reflection seismics, electrical resis-
tivity tomography, transient electromagnetics, and gravime-
try for a better understanding of the dissolution process. The
study area, “Esperstedter Ried” in northern Thuringia, Ger-
many, located south of the Kyffhäuser hills, is a large in-
land salt marsh that developed due to dissolution of soluble
rocks at approximately 300 m depth. We were able to locate
buried dissolution structures and zones, faults and fractures,
and potential fluid pathways, aquifers, and aquitards based
on seismic and electromagnetic surveys. Further improve-
ment of the model was accomplished by analyzing gravime-
try data that indicates dissolution-induced mass movement,
as shown by local minima of the Bouguer anomaly for the
Esperstedter Ried. Forward modeling of the gravimetry data,
in combination with the seismic results, delivered a cross sec-
tion through the inland salt marsh from north to south. We
conclude that tectonic movements during the Tertiary, which
led to the uplift of the Kyffhäuser hills and the formation of
faults parallel and perpendicular to the low mountain range,
were the initial trigger for subsurface dissolution. The faults
and the fractured Triassic and lower Tertiary deposits serve
as fluid pathways for groundwater to leach the deep Permian
Zechstein deposits, since dissolution and erosional processes
are more intense near faults. The artesian-confined saltwater
rises towards the surface along the faults and fracture net-
works, and it formed the inland salt marsh over time. In the
past, dissolution of the Zechstein formations formed several,
now buried, sagging and collapse structures, and, since the
entire region is affected by recent sinkhole development, dis-
solution is still ongoing. From the results of this study, we
suggest that the combined geophysical investigation of areas
prone to subsurface dissolution can improve the knowledge
of control factors, hazardous areas, and thus local dissolution
processes.
1 Introduction
The subsurface dissolution or leaching of soluble rocks poses
a major geohazard, especially if it occurs in urbanized areas
(Gutiérrez et al., 2014; Parise, 2015a). In particular, the for-
mation of sinkholes, also called dolines, can cause building
and infrastructure damage as well as life-threatening situa-
tions (Beck, 1988; Waltham et al., 2005; Parise et al., 2015b).
Therefore, gaining a better understanding of the dissolution
process, its controlling factors, and the resulting structures is
of high importance.
The subsurface dissolution process requires the presence
of soluble rocks (e.g., evaporites), unsaturated groundwater,
Published by Copernicus Publications on behalf of the European Geosciences Union.

1674 S. H. Wadas et al.: Geophysical analysis of a subsurface dissolution area
or meteoric water, as well as fractures, joints, or faults which
may serve as fluid pathways (Davies, 1951; White and White,
1969; Waltham et al., 2005; De Waele et al., 2017). In gen-
eral, this process can form different kinds of sinkhole types.
The most recent sinkhole classification proposed by Gutiér-
rez et al. (2014), which integrates the classification schemes
by, e.g., Beck (2005), Waltham et al. (2005), and Gutiérrez et
al. (2008) and was updated by, e.g., Parise (2019) and Parise
(2022), groups them into two categories: solution sinkholes
and subsidence sinkholes. Solution sinkholes are formed due
to lowering of the ground surface caused by corrosion of
exposed soluble rocks, and subsidence sinkholes are gener-
ated by both subsurface dissolution and downward gravita-
tional mass movement. Subsidence sinkholes can be further
subdivided based on affected materials (cover, bedrock, and
caprock) and the subsidence mechanisms (collapse, sagging,
and suffosion). Collapse sinkholes are characterized by brit-
tle deformation and upward-migrating cavities and rock fail-
ure, finally resulting in sudden collapse of the ground sur-
face with steep edges. Sagging sinkholes are caused by pas-
sive bending of sediments due to differential dissolution and
the lack of basal support. A large difference compared to the
other types of subsidence sinkholes is that no cavities are
required to generate a sagging sinkhole. And suffosion sink-
holes develop due to the downward migration of unconsoli-
dated sediments through voids. In nature, however, sinkholes
are often not so easy to classify, as they often have a polyge-
netic origin.
Several studies have dealt with the understanding of the
processes and the imaging of subsurface dissolution struc-
tures, such as cavities, sinkholes, and depressions, using dif-
ferent types of methods. The most suitable methods for the
monitoring of sinkhole development are aerial photos, differ-
ential GPS, and radar interferometry (Yechieli et al., 2002;
Abelson et al., 2003; Iovine et al., 2010; Abou Karaki et
al., 2019; Watson et al., 2019; Zumpano et al., 2019; Vey
et al., 2021). For the detection of cavities and mass move-
ment, gravimetric methods have been shown to be useful
(Neumann, 1977; Butler, 1984), as they also deliver infor-
mation about possible cavity fills, as does electrical resis-
tivity tomography (ERT) in addition to various electromag-
netic methods (Militzer et al., 1979; Bosch and Müller, 2001;
Miensopust et al., 2015; Kaufmann et al., 2018). To obtain
an image of the subsurface the most common techniques are
ground-penetrating radar (Kaspar and Pecen, 1975; Batayneh
et al., 2002) and reflection seismics (Steeples et al., 1986;
Miller and Steeples, 2008; Krawczyket al., 2012; Margiotta
et al., 2016; Wadas et al., 2016). Several studies in karst
regions using P-wave reflection seismics have been carried
out (Evans et al., 1994; Keydar et al., 2012), but investi-
gations using SH-wave reflection seismics that enable high-
resolution imaging of the near surface (Krawczyket al., 2012;
Wadas et al., 2016, 2017; Polom et al., 2018), or even in
combination with P waves, are sparse or missing. Since sub-
surface dissolution and the development of its corresponding
structures are complex phenomena, a combination of vari-
ous methods (e.g., Malehmir et al., 2016; Al-Halbouni et al.,
2021; Ezersky et al., 2021) is needed to better understand
the components and associated controlling factors. The more
boundary conditions that constrain the processes and struc-
tures that can be determined, the better, e.g., dynamic mod-
els (Augarde et al., 2003; ; Al-Halbouni et al., 2019) can be
adapted in order to make better predictions of hazardous ar-
eas.
In this study, we show the benefits of a combined approach
using P- and SH-wave reflection seismics including ERT
(Doetsch et al., 2012; Wiederhold et al., 2013; Ronczka et
al., 2017; Nickschick et al., 2019; Tanner et al., 2020), tran-
sient electromagnetics (TEMs; Rochlitz et al., 2018; Steuer
et al., 2011), and gravimetry (Eppelbaum et al., 2008; Ez-
ersky et al., 2013b; Flechsig et al., 2015) to better under-
stand the local subsurface dissolution of an inland salt marsh
in Thuringia, Germany. We analyze different types of sub-
sidence sinkholes, like collapse sinkholes and depressions
or sagging sinkholes, and determine the vertical and lateral
fluid pathways and areas of subsurface mass movement. Fur-
thermore, we recommend a workflow for geophysical inves-
tigation of areas prone to subsurface dissolution and sinkhole
development, as well as to determine control factors and haz-
ardous areas.
2 Geology
Germany suffers from a widespread sinkhole problem be-
cause soluble deposits are close to the surface in many ar-
eas (Goldscheider and Bechtel, 2009; Krawczyket al., 2012;
Kaufmann, 2014; Wadas et al., 2016; Kaufmann et al., 2018).
One of the main areas affected by subsurface dissolution is
located along the Kyffhäuser Southern Margin Fault (KSMF)
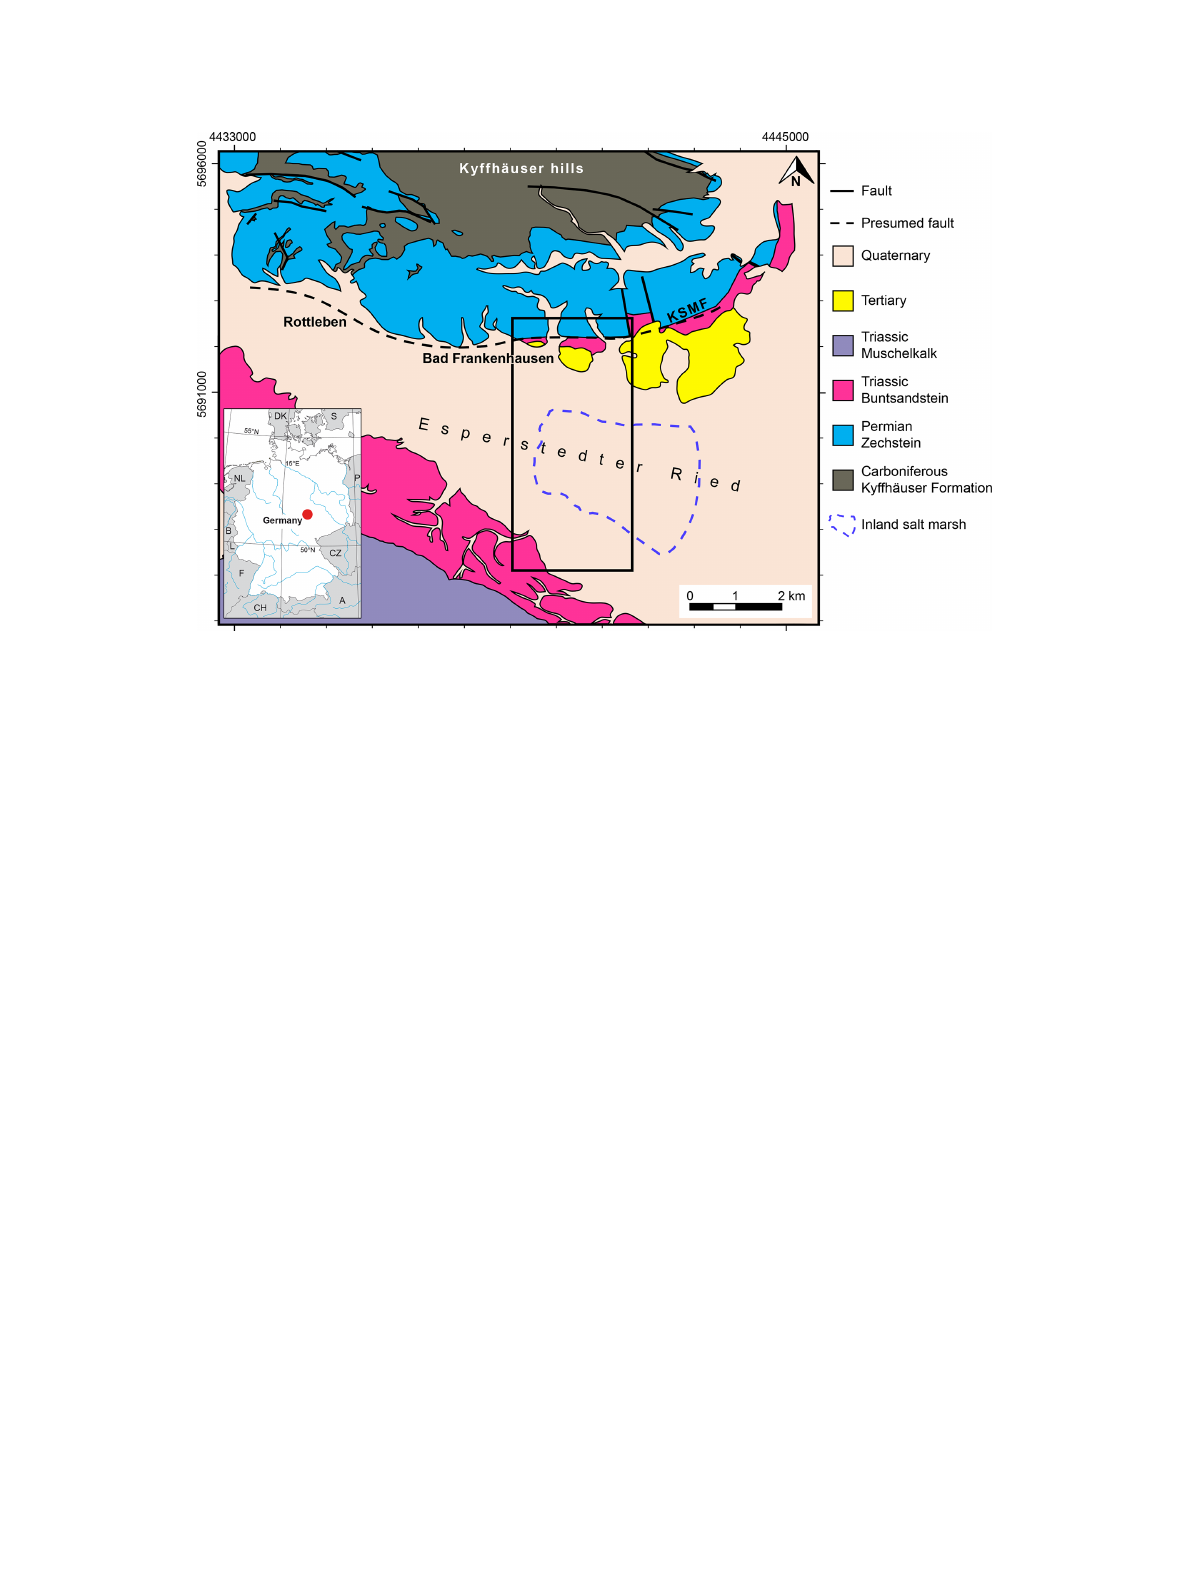
in Thuringia. The Esperstedter Ried to the south of the
Kyffhäuser hills is part of this area. It is a 5km2wide sag,
and it is the largest inland salt marsh of Thuringia (Fig. 1).
It developed due to leaching of salt-bearing rocks at approx-
imately 300 m depth (Schriel and Bülow, 1926a, b).
2.1 Geological evolution
The Kyffhäuser hills have a N–S extension of 6km and a
W–E extension of 13km, and they are one of the smallest
low mountain ranges in Germany. To the south, the hills are
bounded by the northward-dipping, W–E-striking KSMF, a
major thrust fault (Schriel and Bülow, 1926a, b).
An epicontinental ocean, the Zechstein Sea, covered the
area during the Permian, and due to sea level changes, con-
glomerates, carbonates, sulfates, and salt were cyclically
deposited (Richter-Bernburg, 1953). They were formed by
chemical precipitation, and according to solubility, carbon-
ates (calcite, dolomite) were precipitated first, then sulfates
(gypsum), and finally chlorides (rock salt, potassium salt,
Solid Earth, 13, 1673–1696, 2022 https://doi.org/10.5194/se-13-1673-2022

S. H. Wadas et al.: Geophysical analysis of a subsurface dissolution area 1675
and magnesium salt). The latter is extremely soluble and
therefore absent in some parts of the study area nowadays.
Regarding the sulfates, dehydration, e.g., during burial, can
transform gypsum into anhydrite, but in the case of hydra-
tion, e.g., during exhumation, the reverse transformation is
also possible (Waltham et al., 2005). As a result, the cen-
tral part of the Kyffhäuser hills consists of sandstones and
conglomerates, and the southern part consists of gypsum and
anhydrite. The main Zechstein formations south of the hills
are the Werra, Staßfurt, and Leine formations (z1–z3). Anhy-
drite and gypsum of z1to z2formations represent the main
horizon affected by dissolution in the research area (Schriel
and Bülow, 1926a, b). The erosion of the Variscan Orogen
at the Permian–Carboniferous transition led to deposition
of eroded material in the Molasse Basin, and today these
clastic sediments form the central part of the Kyffhäuser
hills (Schriel, 1922; Knoth and Schwab, 1972). Triassic de-
posits are only found at isolated locations, and Cretaceous
and Jurassic rocks have been completely eroded (Schriel and
Bülow, 1926a, b; Reuter, 1962). During the Upper Creta-
ceous and the Tertiary, the low mountain range was uplifted
and tilted, which resulted in the formation of a fault scarp to
the north and a southward-dipping terrain (Freyberg, 1923).
Tertiary deposits are found near Bad Frankenhausen and Es-
perstedt, and Quaternary sediments, such as silt and loess,
cover a large area (Schriel and Bülow, 1926a, b).
The presence of salt springs and the occurrence of sink-
holes and depressions in the near surface indicate soluble
rocks in the underground such as the Zechstein formations,
and they show that Bad Frankenhausen and Esperstedt are
affected by subsurface dissolution (Reuter, 1962).
2.2 Stratigraphy
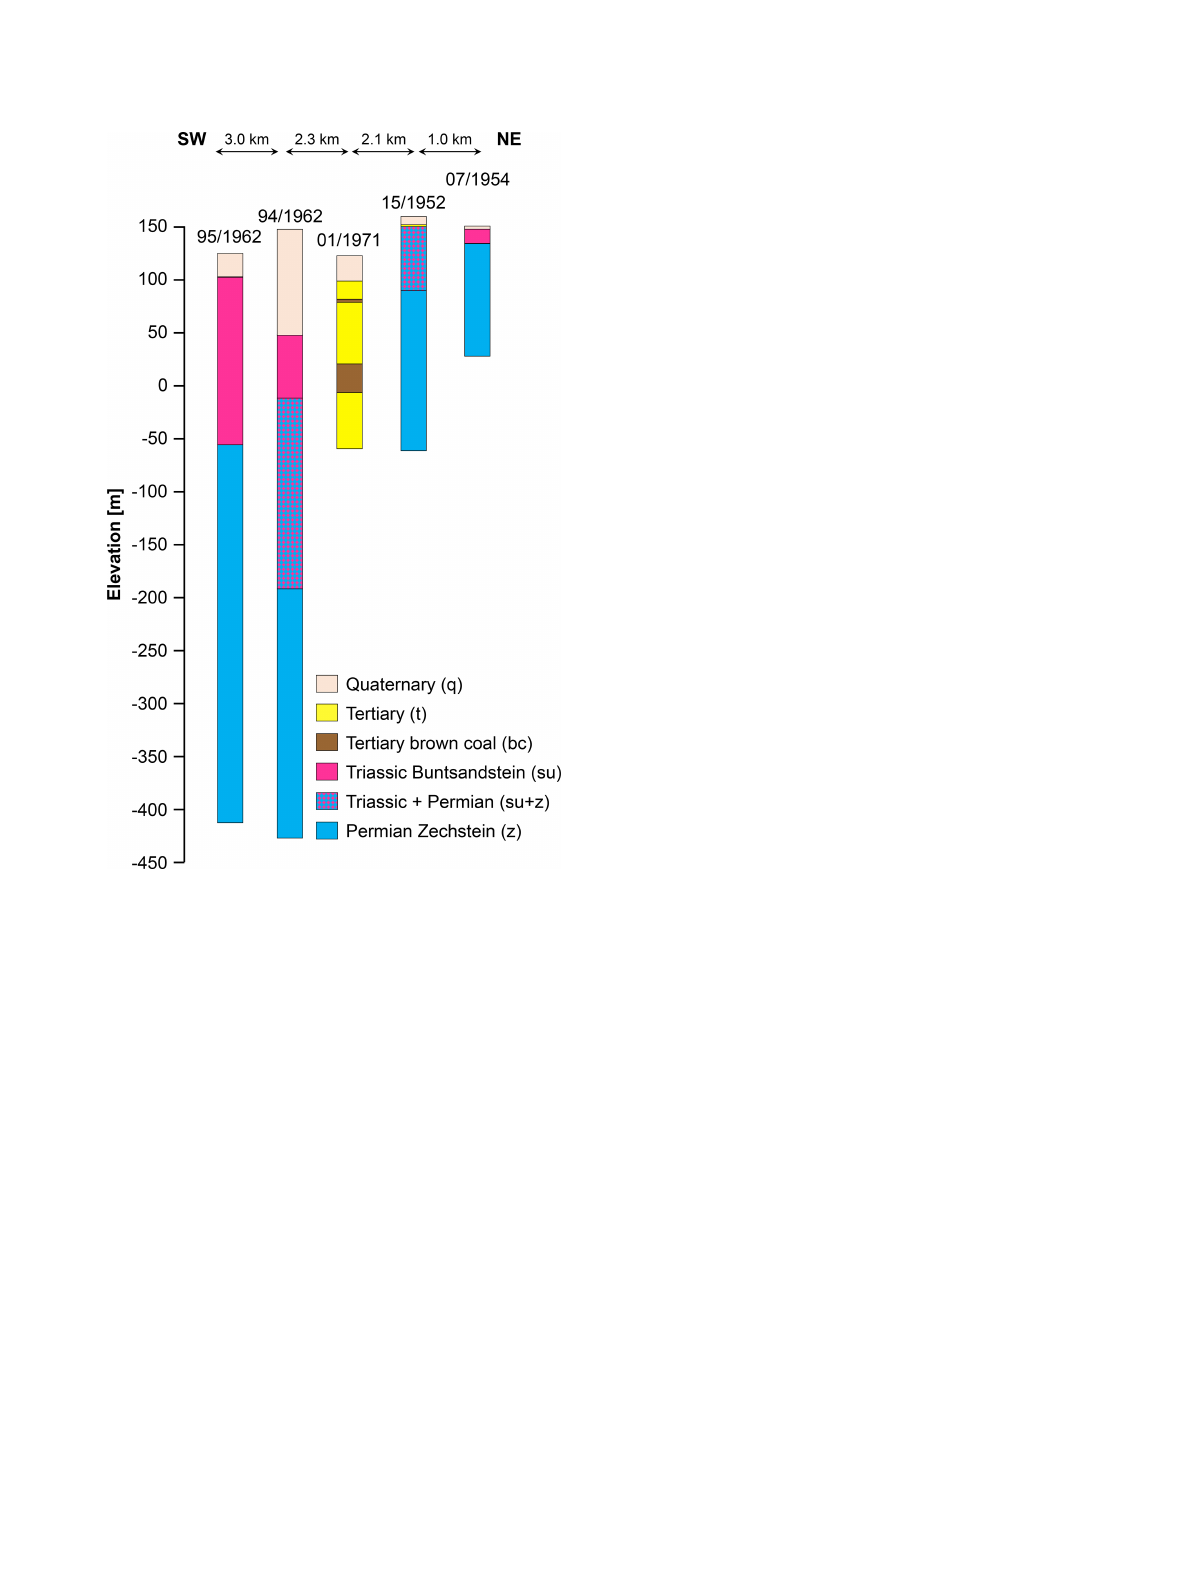
Five boreholes are used for the later correlation of seismic
reflectors and stratigraphy (Figs. 2 and 3). The Zechstein for-
mation (z) is the oldest one drilled. In the research area, the
Zechstein consists of the Werra, Staßfurt, and Leine forma-
tions (z1–z3). North and south of the Esperstedter Ried, the
Zechstein formations are much closer to the surface than in
the central part of the salt marsh. The Permian is followed
by deposits of the Triassic Lower Buntsandstein (su). In two
boreholes (94/1962 and 15/1952) the base of the Triassic and
the top of the Permian deposits could not clearly be deter-
mined, whereas borehole 01/1971, with a drilling depth of
ca. 180 m, did not reach the Triassic sandstones. Tertiary
(t) sediments are found in borehole 15/1952 with 1.70 m
of silt and brown coal, as well as in borehole 01/1971 with
157.50 m of sand, gravel, clay, silt, and brown coal. Quater-
nary (q) deposits, like gravel, sand, and silt are found in all
five boreholes. The thickness varies from 1 m in the north-
east, to 100 m in the center, and to 20m in the southwest. The
first increasing and then decreasing thickness of sediments
from north to south is an indicator for a basin-like structure
in front of the mountain range.
3 Data acquisition methods
East of Bad Frankenhausen in the Esperstedter Ried, P- and
SH-wave reflection seismic surveys as well as ERT, fixed-
loop TEM, and gravimetric measurements were carried out
along several profiles (Fig. 3).
3.1 P-wave reflection seismic
The aim of the P-wave reflection seismics was to image the
large-scale geological structures to about 300 m depth. For
the survey we used a 3 t hydraulically driven vibrator (HVP-
30) as a seismic source, which excited compressional waves
using a linear 16s sweep from 20 to 140Hz at 10m spacing.
At each vibrator location, three vibrations were excited. For
recording we used 360 one-component vertical geophones
planted in the ground at 5 m intervals (Fig. 4), resulting in an
active recording line of 1800m length. The vibrator operated
in an asymmetric split-spread mode; every 360 m the line was
moved forward when the vibrator reached the center of the
line. This resulted in a minimum offset of 840 m for each
shot and a common midpoint (CMP) fold varying between
72 and 96 traces along the line. The overall profile length
was around 3km (P1) and 5km (P2), respectively. The data
were already correlated in the field using the sweep sent by
the sweep generator, and the sample rate was 2ms with a
recording length of 3 s.
3.2 SH-wave reflection seismic
The purpose of the SH-wave reflection seismics was to im-
age the near subsurface at higher resolution compared to P
waves and thus detect small-scale features associated with lo-
cal geology and subsurface dissolution. In the case of water-
saturated soft sediments, which are found in the Esperstedter
Ried, the velocity of the SH wave is significantly slower
compared to the P-wave velocity, and this results in high-
resolution images of the near surface (e.g., Dasios et al.,
1999; Inazaki, 2004; Malehmir, 2019). We conducted two
SH-wave reflection seismic surveys that have a profile length
of around 1 km (S1) and 670 m (S2), respectively. We used
a hydraulically driven vibrator (MHV-4S) that excited hori-
zontally polarized shear waves in a sweep frequency range
of 10 to 80 Hz with a sweep length of 10 s and a record
length of 14 s. The source spacing was 4m, and at each vi-
brator location two vibrations were excited using alternating
polarities. As receivers, 120 one-component horizontal geo-
phones of type SM-6 combined in a land streamer were uti-
lized (Fig. 4). The land streamer is adapted for near-surface
reflection seismic profiling on paved or compacted ground
and uses a fixed geophone spacing of 1m. The streamer was
pulled by a car that contained a Geometrics Geode recording
system. A split-spread geometry was used with the source
and the receivers moving forward. After surveying 60 m, the
land streamer was moved 60 m forward, while the source
https://doi.org/10.5194/se-13-1673-2022 Solid Earth, 13, 1673–1696, 2022
1676 S. H. Wadas et al.: Geophysical analysis of a subsurface dissolution area
Figure 1. Geological map showing the Esperstedter Ried (modified after Schriel and Bülow, 1926a, b). The black box marks the investigation
area.
continuously moved 4 m forward, resulting in a CMP fold of
16 to 24 traces for S1 and 32 to 48 traces for S2. The main ad-
vantage of this source–receiver combination on paved ground
is the suppression of surface Love waves (Polomet al., 2010;
Polom et al., 2013; Krawczyket al., 2012; Krawczyk et al.,
2013).
3.3 ERT and TEM
The goal of the electrical resistivity tomography (ERT) and
the transient electromagnetic (TEM) surveys was to investi-
gate the subsurface resistivity distribution to determine zones
of dissolution and areas of potential saltwater rise. Whereas
the large-scale direct current measurements provide robust
information about the general resistivity structure, but with
comparatively poor resolution, TEM is especially suited to
resolve good conductors down to a few hundred meters of
depth (Milsom and Eriksen, 2011). The ERT survey was
conducted with a dipole–dipole configuration using 26 pairs
of electrodes with approximately 200m spacing along the
4.5 km N–S profile. The transmitter provided up to 30 A of
source current, and voltages were recorded with nine re-
motely controlled data loggers (Fig. 4) developed at LIAG
(Oppermann and Günther, 2018).
The ERT was restricted by power lines, roads, and a
gas pipe. By choosing a fixed-loop setup for the TEM sur-
vey, it was possible to cover parts of the profile that are
nearly unaffected by strong artificial electromagnetic noise.
Receiver positions had 50 m spacing in the N–S direction
and were placed across four large transmitter loops with
250 m ×250 m dimensions. For more information about the
survey and specific details of sensors and data analysis, we
refer to Rochlitz et al. (2018).
3.4 Gravimetry
The gravity survey (TLUBN, 2017) was carried out by the
company Geophysik GGD mbH in 2013 on behalf of the
Thuringian State Institute for Environment, Mining and Con-
servation (TLUBN). Its aim was to complement information
from the reflection seismic surveys by imaging density con-
trasts in the subsurface of the Esperstedter Ried and to fa-
cilitate 2D forward modeling, where structural information
from reflection seismic interpretation is available as a con-
straint. The focus was more on the regional basin structure
than on local surface inhomogeneities. The gravity survey
was carried out along a profile with a station spacing of
100 m using a Scintrex CG-5M quartz gravimeter with nom-
inal ±0.005 mGal standard deviation of repeated measure-
ments. The positions and elevations were determined by dif-
ferential GNSS or by total station surveys with a standard
deviation of ±0.02 m. To enable a map-based qualitative in-
terpretation, supplementary gravity data from the regional
survey of Thuringia, acquired in the second part of the 20th
century, with a mean point distance of 1 to 2 km and standard
deviations between ±0.01 and ±0.06 m Gal (Conrad, 1996)
completed the dataset.
Solid Earth, 13, 1673–1696, 2022 https://doi.org/10.5194/se-13-1673-2022
S. H. Wadas et al.: Geophysical analysis of a subsurface dissolution area 1677
Figure 2. Stratigraphy of five boreholes in and around the Esperst-
edter Ried. The locations can be found in Fig. 3. The stratigraphic
units were used for the interpretation of the seismic profiles.
4 Data processing
4.1 P-wave reflection seismic
The processing of the P-wave data was carried out using the
processing software SeisSpace by Halliburton. The first pro-
cessing steps of the P-wave data were quality control, ver-
tical stack of three repeated shot records, geometry assign-
ment (Fig. 5a), muting of surface waves, and application of
refraction statics (Fig. 5b). This was followed by spectral bal-
ancing to improve the signal-to-noise ratio (SNR) of the re-
flection events and a scaling using an automatic gain con-
trol (AGC) with a 500ms window (Fig. 5c). In preparation
for the pre-stack depth migration (PSMD), short-wavelength
refraction statics and residual statics were carried out, and
with an interactive velocity analysis an initial velocity model
was calculated. A Kirchhoff pre-stack depth migration al-
gorithm was applied, and the velocity model was iteratively
improved by residual moveout (RMO) analysis of the com-
mon reflection point (CRP) gathers. Finally, the CRPs were
further processed using an additional spectral balancing, a
top trace mute, and a frequency–wavenumber (F–K) filter to
improve SNR and resolution (Fig. 5d). For detailed expla-
nations of the processing algorithms, see, e.g., Hatton et al.
(1986), Lavergne (1989), and Yilmaz (2001).
4.2 SH-wave reflection seismic
The processing of the SH-wave data was carried out using
the processing software VISTA Version 10.028 by Gedco
(now Schlumberger). At first, each record was visually ex-
amined for quality assessment, and then vibroseis correla-
tion and geometry assignment using crooked-line binning
with a 0.5 m bin interval were carried out. The next steps
included amplitude balancing and frequency filtering to en-
hance the reflection response and to attenuate noise to im-
prove the resolution and the data quality. For this purpose an
automatic gain control (AGC, 200ms; Fig. 5e), a bandpass
filter (10/12–72/74 Hz), and amplitude normalization were
applied to the data. Then the two shot records of each vibra-
tor location were vertically stacked to improve the SNR due
to a reduction of statistically distributed noise and an am-
plification of the seismic response. This was followed by a
top mute (Fig. 5f) and F–K filter to eliminate noise and har-
monic distortions (Fig. 5g). To prepare the data for the fol-
lowing interactive and iterative velocity analysis, the datasets
were sorted from the shot domain sort to the CMP domain
sort. The manual picking of velocities was performed using
semblance, offset gathers, and constant velocity stacks. With
normal moveout (NMO) corrections, the reflection hyperbo-
las were corrected to get zero-offset travel times, and resid-
ual statics corrections reduced the inaccuracies at the near
surface. A stacked seismic section in the time domain was
created, and additional bandpass and F–K filters removed re-
maining noise. The final frequency bandwidths were 10/12–
62/64 Hz for S1 and 10/12–70/72 Hz for S2. Furthermore,
spectral balancing was applied, and finite-difference (FD)
migration moved the dipping reflectors to their true position;
finally, the sections in the time domain were converted to
depth. See, e.g., Hatton et al. (1986), Lavergne (1989), and
Yilmaz (2001) for detailed descriptions of the processing al-
gorithms.
4.3 ERT and TEM
The ERT surveys yielded time series of 27 current injec-
tions and for each of them 26 potential difference measure-
ments with a GPS base. The resistances were determined
using a lock-in algorithm, whereby the potential difference
is extracted from the noisy time series by using the known
time dependence of the injected current signal (Oppermann
and Günther, 2018). The apparent resistivities were calcu-
lated by multiplication of the resistance with a geometric
https://doi.org/10.5194/se-13-1673-2022 Solid Earth, 13, 1673–1696, 2022
Loading more pages...