ScienceDirect
Available online at www.sciencedirect.com
Procedia Computer Science 184 (2021) 728–733
1877-0509 © 2021 The Authors. Published by Elsevier B.V.
This is an open access article under the CC BY-NC-ND license (http://creativecommons.org/licenses/by-nc-nd/4.0/)
Peer-review under responsibility of the Conference Program Chairs.
10.1016/j.procs.2021.03.090
10.1016/j.procs.2021.03.090 1877-0509
© 2021 The Authors. Published by Elsevier B.V.
This is an open access article under the CC BY-NC-ND license (http://creativecommons.org/licenses/by-nc-nd/4.0/)
Peer-review under responsibility of the Conference Program Chairs.
Available online at www.sciencedirect.com
Procedia Computer Science 00 (2019) 000–000
www.elsevier.com/locate/procedia
The 10th International Workshop on Agent-based Mobility, Traffic and Transportation Models,
Methodologies, and Applications (ABMTRANS)
March 23 - 26, 2021, Warsaw, Poland
Open-Source Web-Based Visualizer for
Dynamic-Response Shared Taxi Simulations
William Charltona,∗, Gregor Leicha, Ihab Kaddouraa
aTechnische Universit¨at Berlin, Chair of Transport Systems Planning and Transport Telematics, Straße des 17. Juni 135, 10623 Berlin, Germany
Abstract
We describe a unique, web-based data visualization portal developed for use by researchers and public transit agencies investi-
gating future shared-taxi fleet scenarios. Augmenting or even replacing fixed-route transit lines with automated, connected, shared
taxi fleets may be a desirable alternative in less-densely developed areas. The MATSim agent-based transport microsimulation
model is used to study scenarios including the status quo, dynamically-dispatched fleets with drivers, and fully autonomous fleets.
This paper focuses on a data visualization portal which includes many interactive views such as agent (taxi) movements color-
coded by number of passengers and trip request origins and destinations, changes in roadway and passenger volumes compared
to a base case, and more. The agent-based simulation covers a 24 hour simulation period; analysts can hone in on specific times
of day to examine, e.g. school pickup/drop-offs or commute trips connecting to rail stations. The tool is in operation for several
small cities and rural regions in Germany and was successfully used as an outreach tool in public meetings. In addition, developers
of the MATSim DRT extension found the visualizations particularly useful for debugging both the algorithms and the scenario
definitions. The code is entirely open source and, while this specific study has a rather esoteric use case, the visualization platform
has an extensible design that could be modified for other purposes.
©2020 The Authors. Published by Elsevier B.V.
This is an open access article under the CC BY-NC-ND license (http://creativecommons.org/licenses/by-nc-nd/4.0/)
Peer-review under responsibility of the Conference Program Chairs.
Keywords: dynamic response transit; data visualization; agent based simulation; matsim; shared taxis
1. Introduction
Augmenting or replacing fixed-route transit lines with automated, connected, shared taxi fleets may be a desirable
alternative for transit agencies in less-densely developed areas. The economics of fixed-route transit are difficult to
square with sparse development patterns, especially with the advent of private ride-hailing services which add the
∗Corresponding author. Tel.: +49 30 314-23308 ; fax: +49 30 314-26269.
1877-0509 ©2020 The Authors. Published by Elsevier B.V.
This is an open access article under the CC BY-NC-ND license (http://creativecommons.org/licenses/by-nc-nd/4.0/)
Peer-review under responsibility of the Conference Program Chairs.
Available online at www.sciencedirect.com
Procedia Computer Science 00 (2019) 000–000
www.elsevier.com/locate/procedia
The 10th International Workshop on Agent-based Mobility, Traffic and Transportation Models,
Methodologies, and Applications (ABMTRANS)
March 23 - 26, 2021, Warsaw, Poland
Open-Source Web-Based Visualizer for
Dynamic-Response Shared Taxi Simulations
William Charltona,∗, Gregor Leicha, Ihab Kaddouraa
aTechnische Universit¨at Berlin, Chair of Transport Systems Planning and Transport Telematics, Straße des 17. Juni 135, 10623 Berlin, Germany
Abstract
We describe a unique, web-based data visualization portal developed for use by researchers and public transit agencies investi-
gating future shared-taxi fleet scenarios. Augmenting or even replacing fixed-route transit lines with automated, connected, shared
taxi fleets may be a desirable alternative in less-densely developed areas. The MATSim agent-based transport microsimulation
model is used to study scenarios including the status quo, dynamically-dispatched fleets with drivers, and fully autonomous fleets.
This paper focuses on a data visualization portal which includes many interactive views such as agent (taxi) movements color-
coded by number of passengers and trip request origins and destinations, changes in roadway and passenger volumes compared
to a base case, and more. The agent-based simulation covers a 24 hour simulation period; analysts can hone in on specific times
of day to examine, e.g. school pickup/drop-offs or commute trips connecting to rail stations. The tool is in operation for several
small cities and rural regions in Germany and was successfully used as an outreach tool in public meetings. In addition, developers
of the MATSim DRT extension found the visualizations particularly useful for debugging both the algorithms and the scenario
definitions. The code is entirely open source and, while this specific study has a rather esoteric use case, the visualization platform
has an extensible design that could be modified for other purposes.
©2020 The Authors. Published by Elsevier B.V.
This is an open access article under the CC BY-NC-ND license (http://creativecommons.org/licenses/by-nc-nd/4.0/)
Peer-review under responsibility of the Conference Program Chairs.
Keywords: dynamic response transit; data visualization; agent based simulation; matsim; shared taxis
1. Introduction
Augmenting or replacing fixed-route transit lines with automated, connected, shared taxi fleets may be a desirable
alternative for transit agencies in less-densely developed areas. The economics of fixed-route transit are difficult to
square with sparse development patterns, especially with the advent of private ride-hailing services which add the
∗Corresponding author. Tel.: +49 30 314-23308 ; fax: +49 30 314-26269.
1877-0509 ©2020 The Authors. Published by Elsevier B.V.
This is an open access article under the CC BY-NC-ND license (http://creativecommons.org/licenses/by-nc-nd/4.0/)
Peer-review under responsibility of the Conference Program Chairs.

William Charlton et al. / Procedia Computer Science 184 (2021) 728–733 729
Available online at www.sciencedirect.com
Procedia Computer Science 00 (2019) 000–000
www.elsevier.com/locate/procedia
The 10th International Workshop on Agent-based Mobility, Traffic and Transportation Models,
Methodologies, and Applications (ABMTRANS)
March 23 - 26, 2021, Warsaw, Poland
Open-Source Web-Based Visualizer for
Dynamic-Response Shared Taxi Simulations
William Charltona,∗, Gregor Leicha, Ihab Kaddouraa
aTechnische Universit¨at Berlin, Chair of Transport Systems Planning and Transport Telematics, Straße des 17. Juni 135, 10623 Berlin, Germany
Abstract
We describe a unique, web-based data visualization portal developed for use by researchers and public transit agencies investi-
gating future shared-taxi fleet scenarios. Augmenting or even replacing fixed-route transit lines with automated, connected, shared
taxi fleets may be a desirable alternative in less-densely developed areas. The MATSim agent-based transport microsimulation
model is used to study scenarios including the status quo, dynamically-dispatched fleets with drivers, and fully autonomous fleets.
This paper focuses on a data visualization portal which includes many interactive views such as agent (taxi) movements color-
coded by number of passengers and trip request origins and destinations, changes in roadway and passenger volumes compared
to a base case, and more. The agent-based simulation covers a 24 hour simulation period; analysts can hone in on specific times
of day to examine, e.g. school pickup/drop-offs or commute trips connecting to rail stations. The tool is in operation for several
small cities and rural regions in Germany and was successfully used as an outreach tool in public meetings. In addition, developers
of the MATSim DRT extension found the visualizations particularly useful for debugging both the algorithms and the scenario
definitions. The code is entirely open source and, while this specific study has a rather esoteric use case, the visualization platform
has an extensible design that could be modified for other purposes.
©2020 The Authors. Published by Elsevier B.V.
This is an open access article under the CC BY-NC-ND license (http://creativecommons.org/licenses/by-nc-nd/4.0/)
Peer-review under responsibility of the Conference Program Chairs.
Keywords: dynamic response transit; data visualization; agent based simulation; matsim; shared taxis
1. Introduction
Augmenting or replacing fixed-route transit lines with automated, connected, shared taxi fleets may be a desirable
alternative for transit agencies in less-densely developed areas. The economics of fixed-route transit are difficult to
square with sparse development patterns, especially with the advent of private ride-hailing services which add the
∗Corresponding author. Tel.: +49 30 314-23308 ; fax: +49 30 314-26269.
1877-0509 ©2020 The Authors. Published by Elsevier B.V.
This is an open access article under the CC BY-NC-ND license (http://creativecommons.org/licenses/by-nc-nd/4.0/)
Peer-review under responsibility of the Conference Program Chairs.
Available online at www.sciencedirect.com
Procedia Computer Science 00 (2019) 000–000
www.elsevier.com/locate/procedia
The 10th International Workshop on Agent-based Mobility, Traffic and Transportation Models,
Methodologies, and Applications (ABMTRANS)
March 23 - 26, 2021, Warsaw, Poland
Open-Source Web-Based Visualizer for
Dynamic-Response Shared Taxi Simulations
William Charltona,∗, Gregor Leicha, Ihab Kaddouraa
aTechnische Universit¨at Berlin, Chair of Transport Systems Planning and Transport Telematics, Straße des 17. Juni 135, 10623 Berlin, Germany
Abstract
We describe a unique, web-based data visualization portal developed for use by researchers and public transit agencies investi-
gating future shared-taxi fleet scenarios. Augmenting or even replacing fixed-route transit lines with automated, connected, shared
taxi fleets may be a desirable alternative in less-densely developed areas. The MATSim agent-based transport microsimulation
model is used to study scenarios including the status quo, dynamically-dispatched fleets with drivers, and fully autonomous fleets.
This paper focuses on a data visualization portal which includes many interactive views such as agent (taxi) movements color-
coded by number of passengers and trip request origins and destinations, changes in roadway and passenger volumes compared
to a base case, and more. The agent-based simulation covers a 24 hour simulation period; analysts can hone in on specific times
of day to examine, e.g. school pickup/drop-offs or commute trips connecting to rail stations. The tool is in operation for several
small cities and rural regions in Germany and was successfully used as an outreach tool in public meetings. In addition, developers
of the MATSim DRT extension found the visualizations particularly useful for debugging both the algorithms and the scenario
definitions. The code is entirely open source and, while this specific study has a rather esoteric use case, the visualization platform
has an extensible design that could be modified for other purposes.
©2020 The Authors. Published by Elsevier B.V.
This is an open access article under the CC BY-NC-ND license (http://creativecommons.org/licenses/by-nc-nd/4.0/)
Peer-review under responsibility of the Conference Program Chairs.
Keywords: dynamic response transit; data visualization; agent based simulation; matsim; shared taxis
1. Introduction
Augmenting or replacing fixed-route transit lines with automated, connected, shared taxi fleets may be a desirable
alternative for transit agencies in less-densely developed areas. The economics of fixed-route transit are difficult to
square with sparse development patterns, especially with the advent of private ride-hailing services which add the
∗Corresponding author. Tel.: +49 30 314-23308 ; fax: +49 30 314-26269.
1877-0509 ©2020 The Authors. Published by Elsevier B.V.
This is an open access article under the CC BY-NC-ND license (http://creativecommons.org/licenses/by-nc-nd/4.0/)
Peer-review under responsibility of the Conference Program Chairs.
2W. Charlton et al. /Procedia Computer Science 00 (2019) 000–000
“shared taxi” concept to people’s travel options [7]. The same technologies used by private ride-hailing, however, can
also be modified and applied to future transit services.
In this study, known in German as AV ¨
OV1, a new dynamic-response shared taxi service, or “DRT”, is examined
as an alternative approach to serving the population of rural areas and less-dense portions of urban regions. Dynamic-
response transit is analyzed using the MATSim agent-based transport microsimulation model. MATSim is an exten-
sible, activity- and multi-agent based transport simulation, which enables the simulation of large scale scenarios. [6].
Crucially, MATSim simulates passenger transport in both private and public modes [11].
The existing methodology behind using MATSim to simulate DRT is well-described by Bischoffet al [1,2] and is
not the focus of this paper. Rather, in the course of the effort to develop, analyze and compare various DRT scenarios,
a need arose to create some truly unique data visualizations that could assist in improving and displaying the DRT
scenarios themselves. A web-based portal is the result of this research. The portal includes many interactive views,
such as taxi movements color-coded by number of passengers and trip request origins and destinations, changes in
roadway and passenger volumes compared to a base case, and more. The agent-based simulation covers a 24 hour
simulation period; analysts can hone in on specific times of day to examine, e.g. school pickup/drop-offs or commute
trips connecting to rail stations.
The tool is in operation for several small cities and rural regions in Germany, and was successfully used as an
outreach tool in public meetings online. Project partners at transit agencies are interested in understanding the impli-
cations of the DRT simulations, and without a visual component, that would be extremely difficult to provide.
Furthermore, developers of the MATSim DRT extension found the visualizations particularly useful for debug-
ging both the algorithms and the scenario definitions. The latest implementions of MATSim include extensive DRT
capabilities whose methods are continually being optimized and improved.
All code for MATSim and the visualization portal is open source and, while this specific study has a quite esoteric
use case, the portal has an extensible design that could be modified for other purposes.
2. Motivation: Existing Tools and Research
Agent-based microsimulation is quite complex, producing reams of data and overwhelming details that are not
appropriate for stakeholder meetings. PDF reports and PowerPoint slides are the norm in these situations, but building
something truly interactive instead could be much more engaging and useful for decision-making.
Many existing tools can analyze agent-based transport simulation outputs. OTFVis [10] is a venerable open-source
tool designed to integrate tightly with MATSim, however it is not under active development and has neither online
features nor DRT-specific capabilities.
The commercial product Senozon Via [8] is very feature rich, actively maintained, and is currently used by our
research team for myriad internal analysis tasks. It has no online web-based component, although it is very easy to
create high-quality screen recordings of simulation results. The lack of interactive options for outreach meetings, as
well as Via’s focus on advanced analyst tasks, make it a poor fit for outreach despite its many other advantages.
General geographic information system tools, such as ArcGis and its open source corollary QGis, are again very
analyst-focused. Unlike QGis, ArcGis can create high quality online dashboards and interactive maps, and the study
team has used them in other settings. ArcGis does not have any MATSim-specific capabilities; the rich agent-based
details would be entirely lost in the aggregations required to get DRT outputs onto an ArcGis map. ArcGis is also
commercial software and was not considered due to the required financial outlay.
Research by Charlton and Laudan [3] shows that a web-based tool specific to MATSim is now possible, given the
latest advances in graphic technology embedded in modern web browsers. That tool includes a “front-end” website
which runs in the user’s browser. Through this site the user organizes model outputs, and defines aggregate visualiza-
tions for a few typical use cases. The tool also requires a large, complex “back-end” server component which handles
file storage, user authentication, output post-processing, and realtime visualization support. That work is an obvious
starting point for this research, but for reasons that will be described below, much of it was ultimately discarded.
1Automasierter vernetzter ¨
offentlicher Verkehr: Automated, networked public transit

730 William Charlton et al. / Procedia Computer Science 184 (2021) 728–733
W. Charlton et al. /Procedia Computer Science 00 (2019) 000–000 3
In summary, the existing tools are all either incapable of visualizing the disaggregate outputs of the DRT module of
MATSim in an efficient manner, have no web-based online component, or are inappropriate for anyone except highly
trained analysts. Thus the new platform described below is seen as a viable solution.
3. The Visualization Platform
Despite two years of development of the above-mentioned client/server solution for other studies, problems in the
old system are persistent. The two largest: (1) The massive size of MATSim outputs always preclude loading them
into a user’s web browser; a single DRT run can be 800Mb or more. This forces post-processing and/or aggregation
to happen, which can eliminate many of the benefits of a fully disaggregate analysis. (2) The back-end server design
requires extensive effort whenever new visualization capabilities are desired. A strict database design and overwrought
user/group management capabilities result in a rock-solid system that is extremely onerous to modify.
It turns out that complex file and user management is unnecessary.2From trial and error and iteration emerges a
simplified system that eliminates all of the back-end server complexity by eliminating all of the back-end servers:
•File storage is delegated to existing servers, instead of creating a special visualization file server. On site, we
have an existing “Subversion” server [4] which is adept at large-file storage and version history. All access to
the server is via a simple interface that can be easily extended to cloud storage, such as Amazon S3
•As the site is intended to be publicly accessible, we discard all user authentication capabilities. If you have a
web browser, you can view the results of any runs which are stored in the public area of the Subversion server.
Naturally some parts of file storage remain off-limits to the greater Internet
•Analysts define visualizations by creating small configuration text files in the same folder as model outputs.
These files include all of the details of a visualization — usually just a few lines — pointing to the input files
and configuration settings. This eliminates all the hassle of writing code for user interface input dialog boxes.
•Post-processing of outputs must be performed by the analyst as part of their modeling workflow, before up-
loading to Subversion, since browsers cannot ingest MATSim outputs in their entirety. This tool is not an
“end-to-end” GUI which lets analysts define, run, and view outputs of their simulations: it is an output viewer.
The code is designed as a “Single Page Application” or “SPA” which is a modern way of building Javascript-based
websites that behave similarly to desktop applications. Most large consumer websites such as Twitter and Facebook
behave in a similar manner, thus this paradigm is easy for end users to understand.
Again after much trial and error for which there is no space in this brief paper, the platform is the combination of
many different advanced web technologies:
•The overall application framework is based on VueJS, a popular Javascript toolkit for building interactive
websites. VueJS is the glue between user interface clicks and the application code that runs underneath.
•The agent-based visualizations use custom code (“shaders”) written using the Deck.gl visualization library
•Older visualizations borrowed from Charlton et al’s previous research use the Mapbox GL mapping library
•Extensive optimization of memory usage for handling these large datasets with the brilliant crossfilter Javascript
library, which manages lightning-fast filtering of millions-of-rows datasets in multiple dimensions
The entire codebase is open source and is designed with a “plug-in” architecture so that new visualizations can be
developed quickly while relying on common infrastructure for things like file access. To create a new visualization,
the developer copies an existing template, modifies the Javascript code to take advantage of the Deck.gl or MapBox
libraries as needed, and registers it with the main application. End users can then create visualizations by adding
corresponding configuration files to a scenario’s file server folder.
2This invokes the programming mantra “YAGNI” – You Aren’t Gonna Need It: build the simplest possible solution that works, instead of
over-engineering things.
4W. Charlton et al. /Procedia Computer Science 00 (2019) 000–000
4. Dynamic-Response Taxi Visualizations
Several unique visualizations depict details specific to the dynamic-response transit scenarios in this study. Standard
MATSim outputs such as mode shares by time of day, simulation statistics, trip length summaries, and so on are also
available in each scenario subfolder.
The descriptions below fit in the paper’s length, but for best understanding of an interactive website, it is better to
view the site in situ. The project site remains online and is better demonstrated than described.3
4.1. DRT Animation
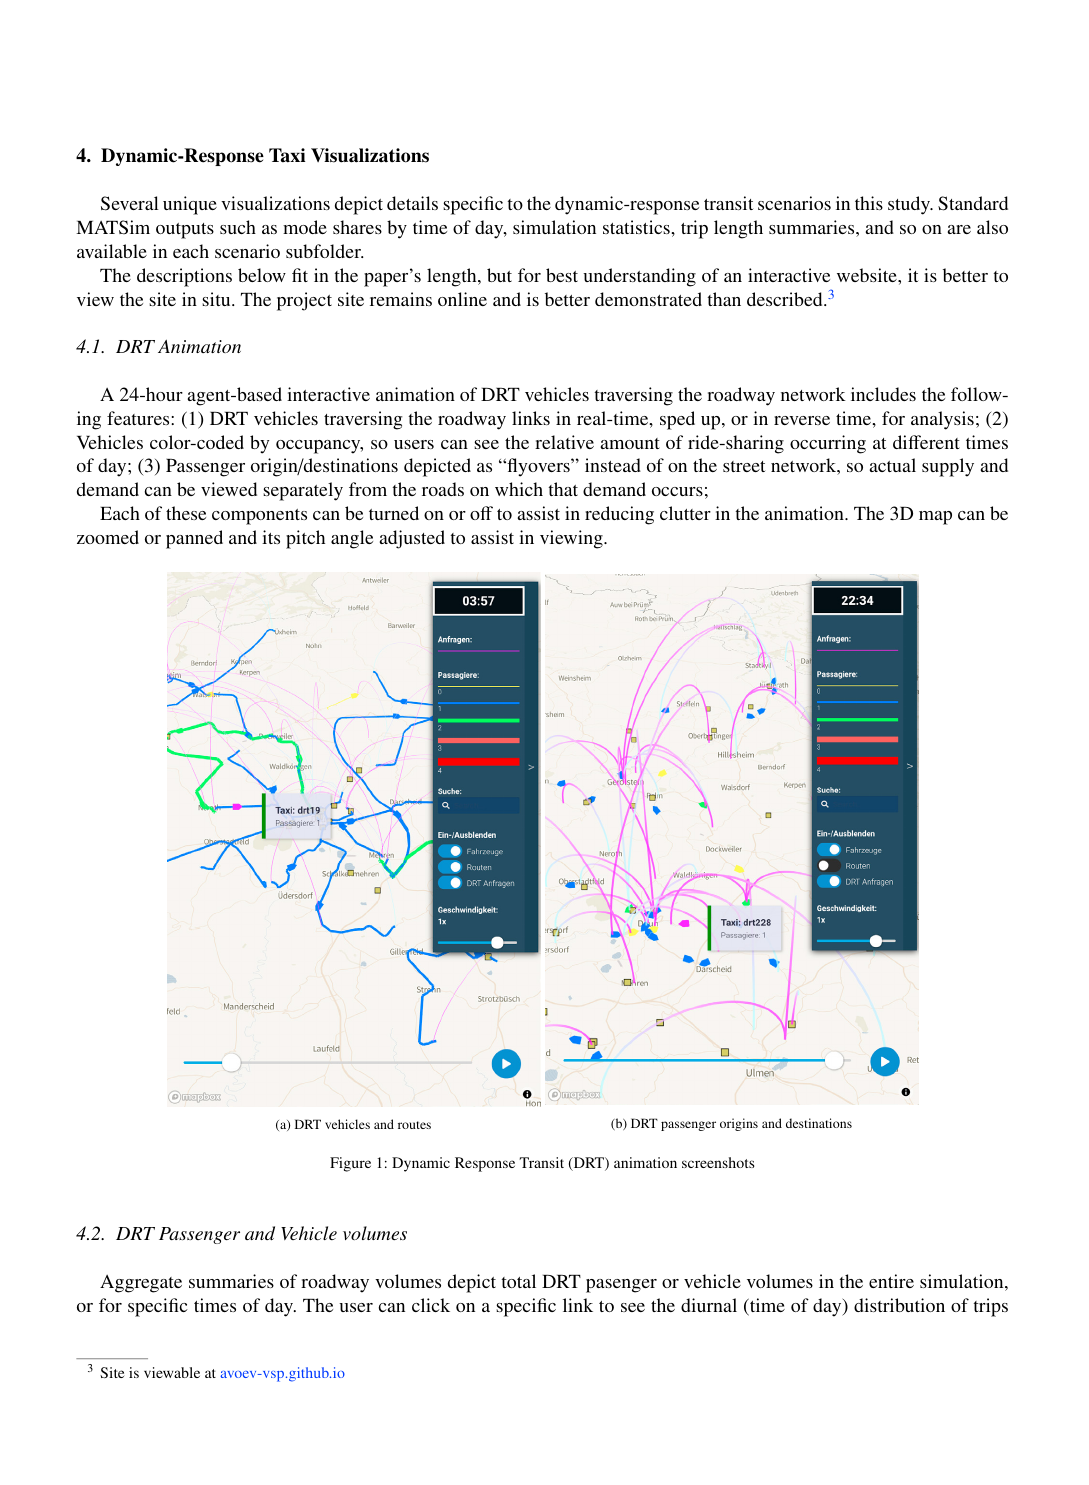
A 24-hour agent-based interactive animation of DRT vehicles traversing the roadway network includes the follow-
ing features: (1) DRT vehicles traversing the roadway links in real-time, sped up, or in reverse time, for analysis; (2)
Vehicles color-coded by occupancy, so users can see the relative amount of ride-sharing occurring at different times
of day; (3) Passenger origin/destinations depicted as “flyovers” instead of on the street network, so actual supply and
demand can be viewed separately from the roads on which that demand occurs;
Each of these components can be turned on or offto assist in reducing clutter in the animation. The 3D map can be
zoomed or panned and its pitch angle adjusted to assist in viewing.
(a) DRT vehicles and routes (b) DRT passenger origins and destinations
Figure 1: Dynamic Response Transit (DRT) animation screenshots
4.2. DRT Passenger and Vehicle volumes
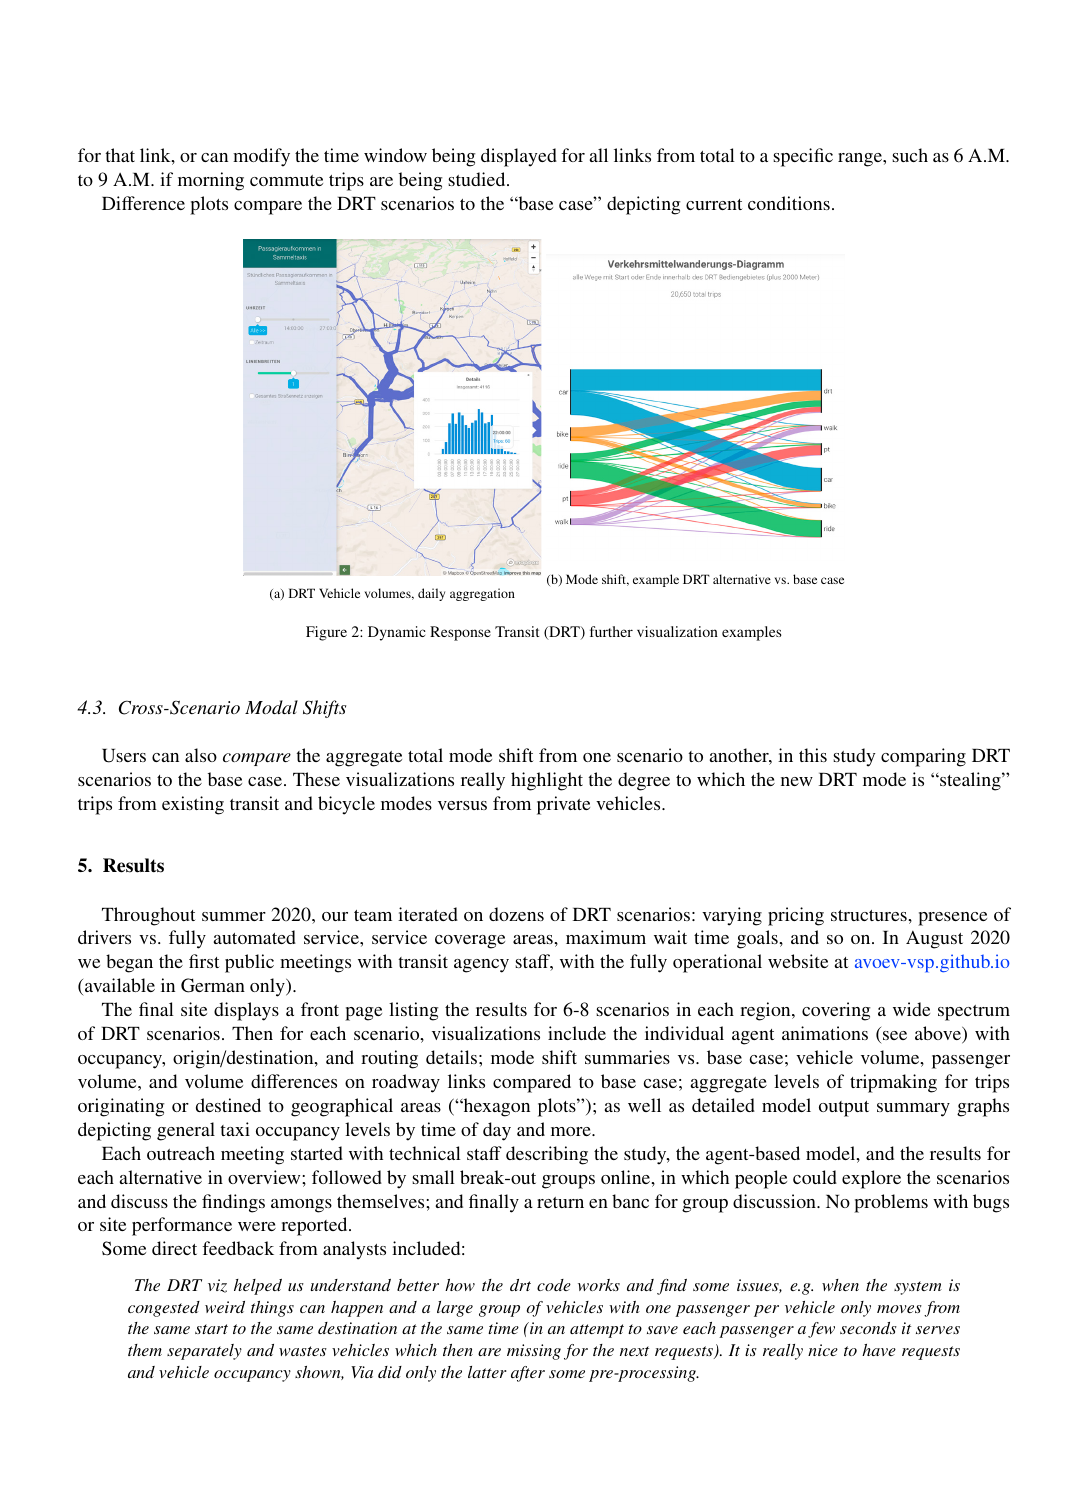
Aggregate summaries of roadway volumes depict total DRT pasenger or vehicle volumes in the entire simulation,
or for specific times of day. The user can click on a specific link to see the diurnal (time of day) distribution of trips
3Site is viewable at avoev-vsp.github.io
William Charlton et al. / Procedia Computer Science 184 (2021) 728–733 731
W. Charlton et al. /Procedia Computer Science 00 (2019) 000–000 3
In summary, the existing tools are all either incapable of visualizing the disaggregate outputs of the DRT module of
MATSim in an efficient manner, have no web-based online component, or are inappropriate for anyone except highly
trained analysts. Thus the new platform described below is seen as a viable solution.
3. The Visualization Platform
Despite two years of development of the above-mentioned client/server solution for other studies, problems in the
old system are persistent. The two largest: (1) The massive size of MATSim outputs always preclude loading them
into a user’s web browser; a single DRT run can be 800Mb or more. This forces post-processing and/or aggregation
to happen, which can eliminate many of the benefits of a fully disaggregate analysis. (2) The back-end server design
requires extensive effort whenever new visualization capabilities are desired. A strict database design and overwrought
user/group management capabilities result in a rock-solid system that is extremely onerous to modify.
It turns out that complex file and user management is unnecessary.2From trial and error and iteration emerges a
simplified system that eliminates all of the back-end server complexity by eliminating all of the back-end servers:
•File storage is delegated to existing servers, instead of creating a special visualization file server. On site, we
have an existing “Subversion” server [4] which is adept at large-file storage and version history. All access to
the server is via a simple interface that can be easily extended to cloud storage, such as Amazon S3
•As the site is intended to be publicly accessible, we discard all user authentication capabilities. If you have a
web browser, you can view the results of any runs which are stored in the public area of the Subversion server.
Naturally some parts of file storage remain off-limits to the greater Internet
•Analysts define visualizations by creating small configuration text files in the same folder as model outputs.
These files include all of the details of a visualization — usually just a few lines — pointing to the input files
and configuration settings. This eliminates all the hassle of writing code for user interface input dialog boxes.
•Post-processing of outputs must be performed by the analyst as part of their modeling workflow, before up-
loading to Subversion, since browsers cannot ingest MATSim outputs in their entirety. This tool is not an
“end-to-end” GUI which lets analysts define, run, and view outputs of their simulations: it is an output viewer.
The code is designed as a “Single Page Application” or “SPA” which is a modern way of building Javascript-based
websites that behave similarly to desktop applications. Most large consumer websites such as Twitter and Facebook
behave in a similar manner, thus this paradigm is easy for end users to understand.
Again after much trial and error for which there is no space in this brief paper, the platform is the combination of
many different advanced web technologies:
•The overall application framework is based on VueJS, a popular Javascript toolkit for building interactive
websites. VueJS is the glue between user interface clicks and the application code that runs underneath.
•The agent-based visualizations use custom code (“shaders”) written using the Deck.gl visualization library
•Older visualizations borrowed from Charlton et al’s previous research use the Mapbox GL mapping library
•Extensive optimization of memory usage for handling these large datasets with the brilliant crossfilter Javascript
library, which manages lightning-fast filtering of millions-of-rows datasets in multiple dimensions
The entire codebase is open source and is designed with a “plug-in” architecture so that new visualizations can be
developed quickly while relying on common infrastructure for things like file access. To create a new visualization,
the developer copies an existing template, modifies the Javascript code to take advantage of the Deck.gl or MapBox
libraries as needed, and registers it with the main application. End users can then create visualizations by adding
corresponding configuration files to a scenario’s file server folder.
2This invokes the programming mantra “YAGNI” – You Aren’t Gonna Need It: build the simplest possible solution that works, instead of
over-engineering things.
4W. Charlton et al. /Procedia Computer Science 00 (2019) 000–000
4. Dynamic-Response Taxi Visualizations
Several unique visualizations depict details specific to the dynamic-response transit scenarios in this study. Standard
MATSim outputs such as mode shares by time of day, simulation statistics, trip length summaries, and so on are also
available in each scenario subfolder.
The descriptions below fit in the paper’s length, but for best understanding of an interactive website, it is better to
view the site in situ. The project site remains online and is better demonstrated than described.3
4.1. DRT Animation
A 24-hour agent-based interactive animation of DRT vehicles traversing the roadway network includes the follow-
ing features: (1) DRT vehicles traversing the roadway links in real-time, sped up, or in reverse time, for analysis; (2)
Vehicles color-coded by occupancy, so users can see the relative amount of ride-sharing occurring at different times
of day; (3) Passenger origin/destinations depicted as “flyovers” instead of on the street network, so actual supply and
demand can be viewed separately from the roads on which that demand occurs;
Each of these components can be turned on or offto assist in reducing clutter in the animation. The 3D map can be
zoomed or panned and its pitch angle adjusted to assist in viewing.
(a) DRT vehicles and routes (b) DRT passenger origins and destinations
Figure 1: Dynamic Response Transit (DRT) animation screenshots
4.2. DRT Passenger and Vehicle volumes
Aggregate summaries of roadway volumes depict total DRT pasenger or vehicle volumes in the entire simulation,
or for specific times of day. The user can click on a specific link to see the diurnal (time of day) distribution of trips
3Site is viewable at avoev-vsp.github.io
732 William Charlton et al. / Procedia Computer Science 184 (2021) 728–733
W. Charlton et al. /Procedia Computer Science 00 (2019) 000–000 5
for that link, or can modify the time window being displayed for all links from total to a specific range, such as 6 A.M.
to 9 A.M. if morning commute trips are being studied.
Difference plots compare the DRT scenarios to the “base case” depicting current conditions.
(a) DRT Vehicle volumes, daily aggregation
(b) Mode shift, example DRT alternative vs. base case
Figure 2: Dynamic Response Transit (DRT) further visualization examples
4.3. Cross-Scenario Modal Shifts
Users can also compare the aggregate total mode shift from one scenario to another, in this study comparing DRT
scenarios to the base case. These visualizations really highlight the degree to which the new DRT mode is “stealing”
trips from existing transit and bicycle modes versus from private vehicles.
5. Results
Throughout summer 2020, our team iterated on dozens of DRT scenarios: varying pricing structures, presence of
drivers vs. fully automated service, service coverage areas, maximum wait time goals, and so on. In August 2020
we began the first public meetings with transit agency staff, with the fully operational website at avoev-vsp.github.io
(available in German only).
The final site displays a front page listing the results for 6-8 scenarios in each region, covering a wide spectrum
of DRT scenarios. Then for each scenario, visualizations include the individual agent animations (see above) with
occupancy, origin/destination, and routing details; mode shift summaries vs. base case; vehicle volume, passenger
volume, and volume differences on roadway links compared to base case; aggregate levels of tripmaking for trips
originating or destined to geographical areas (“hexagon plots”); as well as detailed model output summary graphs
depicting general taxi occupancy levels by time of day and more.
Each outreach meeting started with technical staffdescribing the study, the agent-based model, and the results for
each alternative in overview; followed by small break-out groups online, in which people could explore the scenarios
and discuss the findings amongs themselves; and finally a return en banc for group discussion. No problems with bugs
or site performance were reported.
Some direct feedback from analysts included:
The DRT viz helped us understand better how the drt code works and find some issues, e.g. when the system is
congested weird things can happen and a large group of vehicles with one passenger per vehicle only moves from
the same start to the same destination at the same time (in an attempt to save each passenger a few seconds it serves
them separately and wastes vehicles which then are missing for the next requests). It is really nice to have requests
and vehicle occupancy shown, Via did only the latter after some pre-processing.
6W. Charlton et al. /Procedia Computer Science 00 (2019) 000–000
The website obviously made the AV ¨
OV workshops easier. Instead of only sharing our screen we could hand out a
website where people could click themselves. Unfortunately it seemed that those listeners did not use the website a lot
and rather kept listening to us. Some hypotheses: Maybe because sometimes a group of people shared one computer
and their internet connection was bad, maybe because they are not used to that kind of interaction...
The other plots like passengers/link or vehicles/link are not entirely new; some used QGis to produce those. However,
the website forced us to actually produce all those plots systematically instead of ’we could do that plot, but maybe
it’s not necessary, let’s look into something else or raw data only to avoid the hassle of setting up QGis...’
The feedback that some of these visualizations are not entirely “new” is expected: tools such as QGis and Via provide some
very nice visualization capabilities already. They are not online tools, however, and are not accessible to non-technical staffsuch
as at a public outreach meeting.
Given this level of feedback, we are pleased with the initial roll-out of the visualization platform, and expect to continue
developing it for further analysis of dynamic-response transit systems.
6. Conclusions and Outlook
Several years of trial and error led us to this specific combination of technologies and techniques. The research team is deeply
indebted to the developers of so many components and libraries on which this is based, all of which are freely available online
and without which this work would have been entirely impossible. The final product is more than parts merely cobbled together: a
usable, useful tool for decision-making now exists, and the DRT-specific extensions serve as a template for further work.
Paraphrasing Dennis Ritchie’s early description of the UNIX system in Ritchie and Thompson [9], “Success lies not so much
in new inventions but rather in the full exploitation of a carefully selected set of fertile ideas, and especially in showing that they
can be keys to the implementation of a small yet powerful system.”
Our successful experience using the platform in a public outreach setting confirms our belief that advanced agent-based simu-
lations can be part of a decision framework and public policy discussions – ultimately leading to better informed decision-making.
Further enhancements to the underlying platform and to the DRT visualization capabilities are ongoing; the plugin architecture
enables other Javascript developers to write plugins for their own agent-based models and their own use cases, if they so desire.
The website remains online at avoev-vsp.github.io. All code is available at github.com/avoev-vsp and is licensed under the GNU
GPL Version 3 [5]. The authors welcome feedback and code contributions.
7. Acknowledgements
This research benefited from many discussions with Professor Kai Nagel, and was funded in part by the German Federal
Ministry of Transport and Digital Infrastructure (funding number 16AVF2160)
References
[1] Bischoff, J., Maciejewski, M., 2020. Proactive empty vehicle rebalancing for demand responsive transport services. Procedia Computer
Science 170, 739–744. URL: https://doi.org/10.1016/j.procs.2020.03.162, doi:10.1016/j.procs.2020.03.162.
[2] Bischoff, J., Maciejewski, M., Nagel, K., 2017. City-wide shared taxis: A simulation study in Berlin, in: 2017 IEEE 20th International
Conference on Intelligent Transportation Systems (ITSC), IEEE. doi:10.1109/itsc.2017.8317926.
[3] Charlton, B., Laudan, J., 2020. A web-based data visualization platform for matsim. Transportation Research Record URL: https://doi.
org/10.1177/0361198120935109, doi:10.1177/0361198120935109.
[4] Collins-Sussman, B., Fitzpatrick, B., Pilato, C., . Version control with subversion. For subversion 1.5.
[5] Free Software Foundation, 2007. GNU General Public License. URL: www.gnu.org/licenses/gpl.html.
[6] Horni, A., Nagel, K., Axhausen, K.W. (Eds.), 2016. The Multi-Agent Transport Simulation MATSim. Ubiquity, London. doi:10.5334/baw.
[7] Hough, J., , Taleqani, A.R., 2018. Future of rural transit. Journal of Public Transportation 21, 31–42. URL: https://doi.org/10.5038/
2375-0901.21.1.4, doi:10.5038/2375-0901.21.1.4.
[8] Rieser, M., 2016. Senozon via, in: [6]. chapter 33. doi:10.5334/baw.
[9] Ritchie, D.M., Thompson, K., 1978. The UNIX time-sharing system†. Bell System Technical Journal 57, 1905–1929. URL: https:
//doi.org/10.1002/j.1538-7305.1978.tb02136.x, doi:10.1002/j.1538-7305.1978.tb02136.x.
[10] Strippgen, D., 2016. Otfvis: Matsim’s open-source visualizer, in: [6]. chapter 34. doi:10.5334/baw.
[11] Ziemke, D., Kaddoura, I., Nagel, K., 2019. The MATSim Open Berlin Scenario: A multimodal agent-based transport simulation scenario
based on synthetic demand modeling and open data. Procedia Computer Science 151, 870–877. doi:10.1016/j.procs.2019.04.120.
Loading more pages...