
Vol.:(0123456789)
1 3
Applied Physics A (2021) 127:616
https://doi.org/10.1007/s00339-021-04745-w
T.C. : MATERIALS BYDESIGN UNDER PRESSURE: EXPERIMENTS ANDTHEORY
High‑pressure behavior ofdisodered kesterite‑type Cu2ZnSnS4
IliasEfthimiopoulos1,2 · TimKüllmey3· SergioSpeziale1· AnnaS.Pakhomova4· MarcelQuennet3,5· BeatePaulus3·
AnnaRitscher5,6· MartinLerch6
Received: 24 January 2021 / Accepted: 7 July 2021 / Published online: 22 July 2021
© The Author(s) 2021
Abstract
We have investigated the high-pressure structural and vibrational behavior of the disordered kesterite-type Cu2ZnSnS4 com-
pound at ambient temperature. Our experimental and theoretical investigations have revealed a clear structural transition
to a GeSb-type phase close to 15GPa, a tetragonally distorted variant of the NaCl-type phase. The latter transformation is
accompanied by a cationic coordination increase from fourfold to sixfold with respect to the sulfur anions. In addition, a
change in the compressibility rate was detected at about 8GPa within the pressure stability range of the disordered kesterite-
type phase. Upon decompression, a disordered zinc blende/sphalerite structure is recovered. We discuss our findings in close
conjunction with our recent high-pressure work on the ordered Cu2ZnSnS4 modification.
Keywords Kesterite· Pressure· Structure· XRD· Raman
1 Introduction
The quaternary semiconductor Cu2ZnSnS4 has attracted
considerable attention in recent years due to its potential
use as a solar absorber [1, 2]. The suitability of this mate-
rial in photovoltaic applications originates from its almost
optimal optical band gap (Eg ~ 1.5eV), its high absorption
coefficient in the visible range (~ 104 cm−1), and its earth-
abundant, low-cost, and non-toxic elemental constituents
[3–5]. The current power conversion efficiency for the
pristine Cu2ZnSnS4 thin films, however, has not reached
the theoretical limit of ~ 30% [6]. Hence, it is essential to
explore and understand the physical properties and the phase
diagram of this material further, so as todevelop strategies
to enhance in turn its photovoltaic performance.
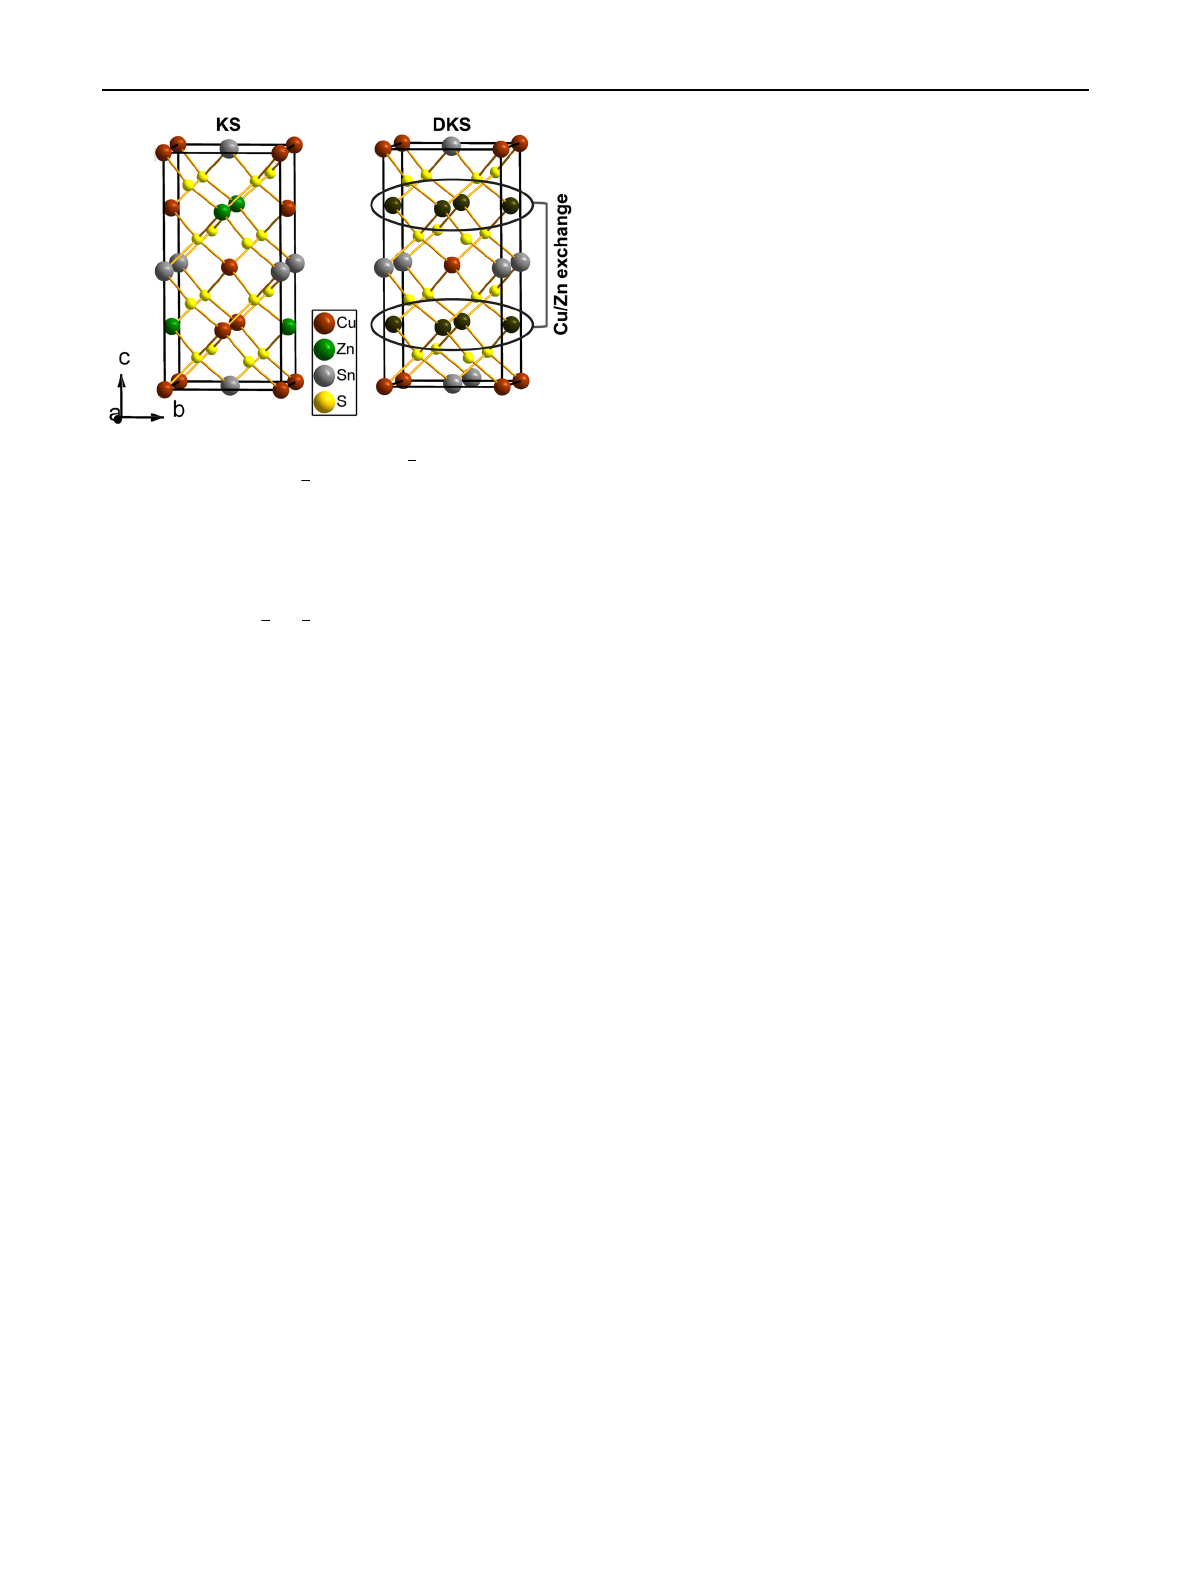
From a structural aspect, Cu2ZnSnS4 adopts the ordered
kesterite-type (KS) structure at ambient conditions (SG I
4
, Z = 2, Fig.1) [7, 8]. This phase is derived from the well-
known zinc blende (ZB)/sphalerite-type structure (SG F
4
2m, Z = 4) by doubling the respective c-unit-cell parameter,
resulting from the alternating cationic arrangement of Cu/
Sn and Cu/Zn layers separated by sulfur anions [9]. Conse-
quently, all of the cations are tetrahedrally coordinated with
respect to the anions. Even though the KS phase represents
an ordered cationic arrangement, with each cation occupying
a unique Wyckoff site, cationic disorder is quite common in
this material [7, 10–13]. The most common type of disorder
is associated with the mutual anti-site exchange of the Cu+
and Zn2+ cations within the z = 1/4 and z = 3/4 layers, which
results in a disordered kesterite-type structural configura-
tion (DKS) with slightly higher symmetry compared to KS
(SG I
4
2m, Z = 2, Fig.1). This type of disorder leads also
to a reduction of the band gap Eg by up to ~ 0.2eV [14, 15].
Some interesting observations were made regarding the
compressibility behavior and structural transitions of the KS
and DKS phases under pressure. In particular, application
of compressive stress was predicted to increase the Eg of
Cu2ZnSnS4, whereas a KS → stannite structural transition
was found at about 32 GPa from theoretical studies [16–18].
* Ilias Efthimiopoulos
1 GFZ German Research Center forGeosciences,
Telegrafenberg, 14473Potsdam, Germany
2 Institut Für Physik, Universität Greifswald,
Felix-Hausdorff-Str. 6, 17489Greifswald, Germany
3 Institut Für Chemie Und Biochemie, Freie Universität Berlin,
Takustr. 3, 14195Berlin, Germany
4 Deutsches Elektronen-Synchrotron, PETRA III,
22607Hamburg, Germany
5 Helmholtz-Zentrum Berlin Für Materialien Und Energie,
Hahn-Meitner-Platz 1, 14109Berlin, Germany
6 Institut Für Chemie, Technische Universität Berlin, Straße
des 17. Juni 135, 10623Berlin, Germany
I.Efthimiopoulos et al.
1 3
616 Page 2 of 11
Our recent combined experimental and abinitio computa-
tional investigations on the KS Cu2ZnSnS4, however, dis-
missed the aforementioned KS → stannite transition; on the
contrary, a concomitant structural and electronic transfor-
mation toward a metallic GeSb-type phase (SG I4/mmm,
Z = 2), a distorted variant of the NaCl-type structure, was
discovered close to 15 GPa [19, 20]. A closer inspection of
the KS compressibility behavior, however, revealed clear
discontinuities in the compressibility of the tetragonal KS
a- and c-axis close to 6–8GPa, whereas no visible effect
was detected in the KS volume [20]. Such behavior is known
to reflect (subtle) structural-related transitions in materi-
als [21–23]. Even though the reason for this effect in KS
Cu2ZnSnS4 is not fully understood, a plausible scenario put
forward earlier involved a pressure-activated Cu/Zn cationic
disorder [19, 20].
Partly motivated by our aforementioned high-pressure
studies on the KS modification, and given that in the major-
ity of synthetic Cu2ZnSnS4 samples the Cu/Zn disorder is
always present to some extent [24–26], we have investigated
the pressure-induced structural and vibrational behavior of
the DKS Cu2ZnSnS4 compound by means of X-ray diffrac-
tion (XRD), Raman spectroscopy, and density functional
theory (DFT) calculations. Similar to KS, DKS Cu2ZnSnS4
undergoes a pressure-induced DKS → GeSb-type structural
transition close to 15GPa, with a disordered ZB-type struc-
ture being recovered upon full decompression [20]. The most
striking result, however, came from the close inspection of
the DKS compressibility behavior; the latter revealed certain
similarities with its KS counterpart, with a clear compress-
ibility change taking place close to 8GPa. This compress-
ibility change is reflected mainly in the pressure-induced
behavior of the a/c axial ratio (i.e., the a- and c-axis exhibit
similar compressibilities) above 8GPa, stemming most
likely from the expansion of the Sn–S bond length beyond
that pressure. The latter effects are common in both the KS
and DKS Cu2ZnSnS4 configurations. On the contrary, the
clear discontinuities observed previously in the F-f plots of
the KS Cu2ZnSnS4 modification were not detected in the
DKS case, implying that a potential pressure-induced Cu/
Zn disorder might be indeed at play for KS Cu2ZnSnS4 [20].
2 Experimental andcomputational details
The investigated disordered Cu2ZnSnS4 sample was avail-
able in polycrystalline powder form. Synthesis and charac-
terization details can be found elsewhere [27–29].
Pressure was generated with symmetric diamond anvil
cells (DACs) equipped with diamonds of 400μm culet diam-
eters. Drilled pre-indented rhenium gaskets with hole diam-
eters of 150–200μm served as sample chambers in separate
runs. The ruby luminescence method was used for measuring
pressure [30]. The error in pressure determination was ΔP
≈ 0.1GPa for the low pressure range (0 ≤ P ≤ 15GPa) and
ΔP ≈ 0.3GPa for the high pressure range (15 ≤ P ≤ 27GPa).
Argon served as a pressure transmitting medium (PTM) in
all experiments, in order to facilitate direct comparison
with our earlier high-pressure investigations on the ordered
Cu2ZnSnS4 modification [19, 20].
The high-pressure Raman measurements were conducted
with a Horiba Jobin Yvon LabRam HR800 VIS single-stage
Raman spectrometer, equipped with a blue (λ = 473nm)
diode-pumped solid-state laser, a 20 × objective lens, an
1800l/mm diffraction grating, and a Peltier-cooled charge-
coupled device (CCD) detector. The measured frequency
range was 100–800 cm−1, with the collection time set to 3
accumulations of 10min each. The incident laser power was
kept below 1mW, in order to avoid any potential damage
on the sample [31]. The Raman-relevant parameters were
obtained from the fitting of the Raman spectra with Lorentz-
ian functions, accompanied by linear background correction/
subtraction.
Angle-resolved high-pressure powder XRD measure-
ments were performed at the Extreme Conditions Beam-
line P02.2 of PETRA III (Hamburg, Germany) [32] with
an incident X-ray wavelength λ = 0.289Å and a beam size
of 2μm × 2μm. Two-dimensional XRD patterns were
collected with a fast flat panel detector XRD1621 from
PerkinElmer (2048 pixels × 2048 pixels, 200 × 200μm2
pixel size) and processed with the FIT2D software [33].
Refinements were performed using the GSAS + EXPGUI
Fig. 1 Unit cell of the kesterite (KS, SG I
4
, Z = 2, left) and disor-
dered kesterite (DKS, SG I
4
2m, Z = 2, right) Cu2ZnSnS4 modifi-
cations. The brown, green, gray, yellow, and black spheres represent
Cu+, Zn2+, Sn4+, S2−, and mixed Cu+/Zn2+ ions, respectively. Notice
that in the KS structure, the Cu+ and Zn2+ cations lying in the same
plane occupy the distinct Wyckoff sites 2c and 2d, respectively. In the
DKS structure on the other hand, the respective Cu+ and Zn2+ cations
are randomly distributed in these two positions, leading to a change in
the space group from I
4
to I
4
2m, whereas the Wyckoff positions 2c
and 2d transform to position 4d
High-pressure behavior ofdisodered kesterite-type Cu2ZnSnS4
1 3
Page 3 of 11 616
software packages [34]. The Birch–Murnaghan equation
of state (B–M EoS) function [35, 36] was fitted to the
obtained pressure–volume (P–V) data of each Cu2ZnSnS4
phase. Given that the Ar PTM becomes solid at 1.4 GPa
[37], we used its EoS as an additional pressure calibrant
[38, 39].
The periodic density functional theory (DFT) calcula-
tions were performed with the Vienna Abinitio Simula-
tion Package (VASP) 5.3.5 in the athermal limit [40–43].
A plane wave basis set with an energy cutoff of 550eV
with the projector-augmented wave (PAW) potentials [44,
45] was used, whereby the 4s and 3d electrons of Cu and
Zn, the 5s, 5p, and 4d electrons of Sn, and the 3s and
3p electrons of S were explicitly considered. The elec-
tronic convergence criteria were set at least to 10–5eV,
whereby the block Davidson algorithm was applied as
implemented in VASP. The structural relaxation of inter-
nal and external lattice parameters was set to a force con-
vergence of 4 × 10⁻²eV/Å2, performed with the conjugate
gradient algorithm implemented in VASP. The freedom of
spin polarization was enabled, and a Gaussian smearing
approach with a smearing factor σ of 0.01eV was utilized
for all structural optimizations.
The DKS and the high-pressure GeSb-type phases of
Cu2ZnSnS4 were treated in the same manner as stated before
[15, 20, 46]. In a nutshell, for the DKSstructure, we use the
most stable Cu ↔ Zn disorder pattern which can be found
in the KS unit cell, with SG P
4
2c [47]. A total of 16 atoms
were simulated, which corresponds to the number of atoms
in the DKS unit cell (Z = 2). On the other hand, for the GeSb-
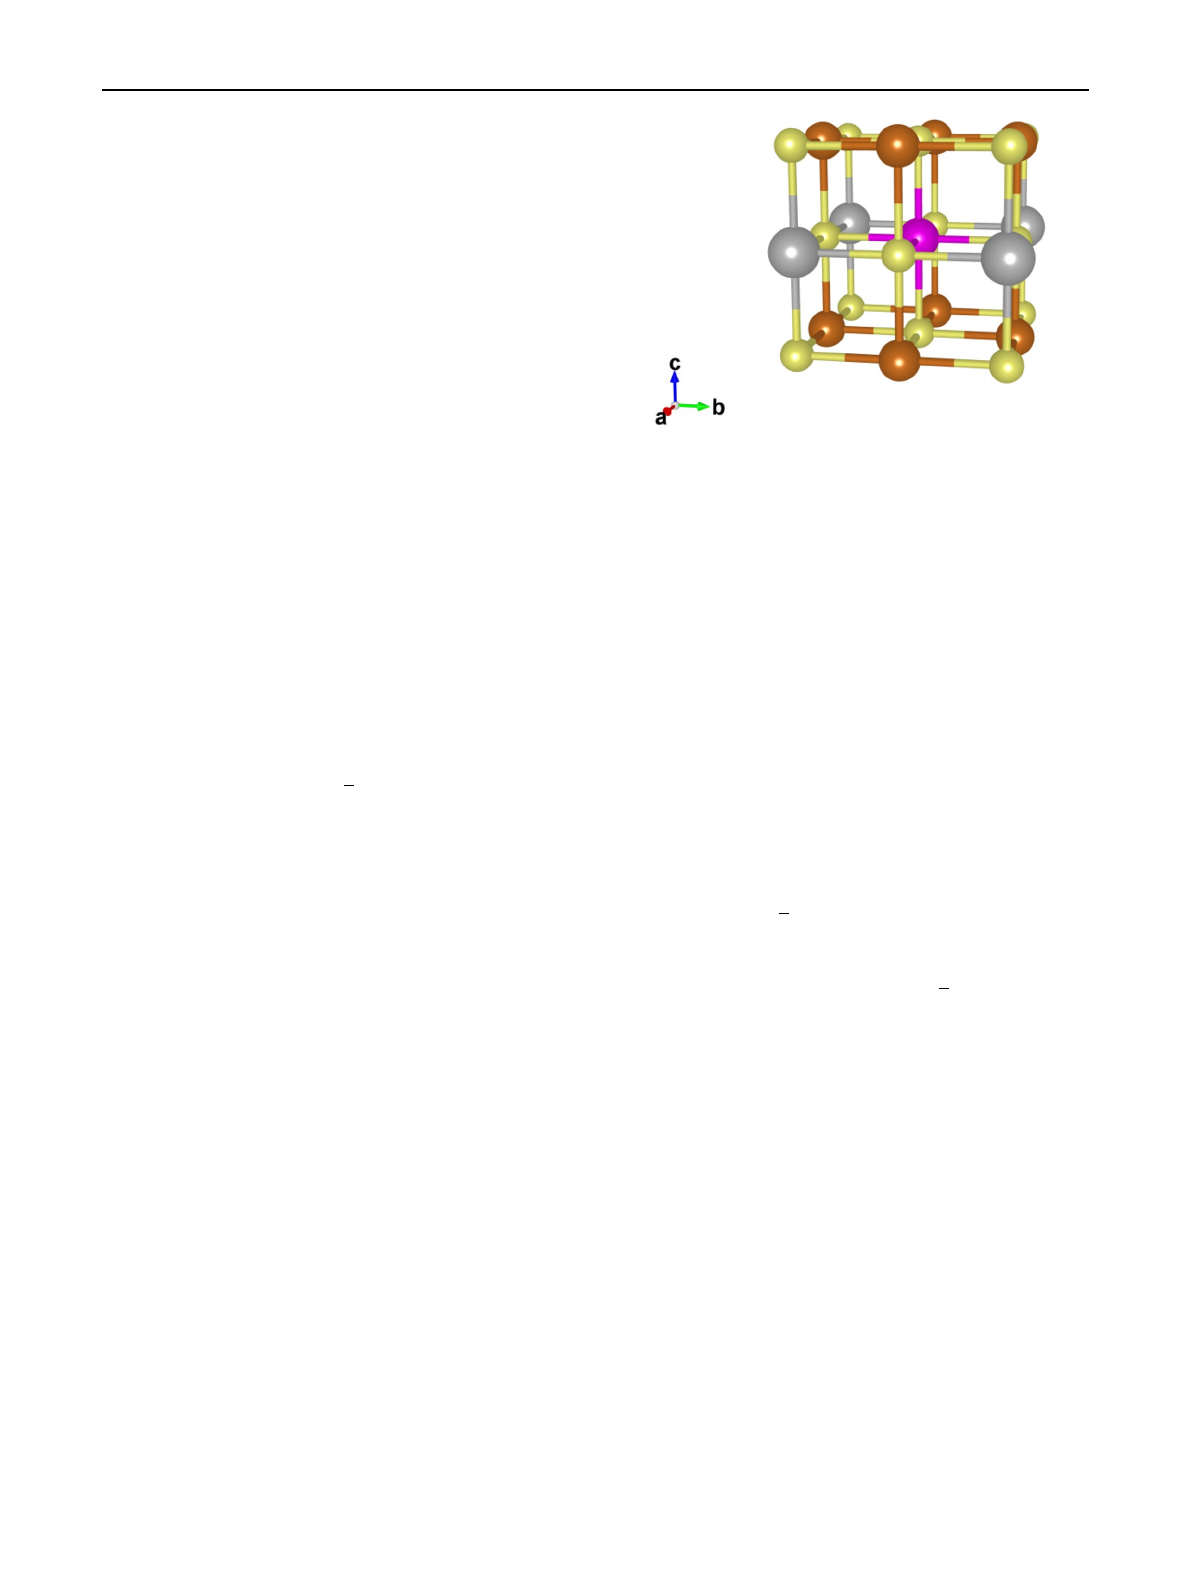
type phase, we omit the disorder in our model and calculate
only one distribution of the cations (Fig.2), rather than
averaging over all possible distributions. This approach is
sufficient to predict the transition pressure, since the energy
differences between the different GeSb-type cationic pat-
terns are smaller compared to the difference associated with
the DKS → GeSb-type structural change. For the GeSb-type
phase, we created 1 × 1 × 2 supercells to match the number
of atoms of the DKS phase. The cells were fully optimized
with a 8 × 8 × 4k-grid constructed via the Monkhorst–Pack
scheme [48] and centered at the Γ-point with the Perdew,
Burke, and Ernzerhof (PBE) functional [49].
The EoS for each phase was determined by selecting vol-
ume points in a range of about ± 100Å3 around the minima.
This corresponds to a pressure range of 0–100GPa. We used
a step size of 8Å3, which led to 23 (DKS) and 24 (GeSb-
type) volume points. At each volume point, we optimized
the cell shape and the atomic positions. We fitted the B–M
EoS function [35, 36] to the total energy E as a function of
volume V for each Cu2ZnSnS4 phase. Then, the pressure of
each volume was obtained from the P(V) formulation of the
same B–M EoS. Consequently, the enthalpy (H = E + PV)
can be obtained for each phase as a function of pressure.
3 Results anddiscussion
3.1 Effects ofdisorder intheRaman spectra
of Cu2ZnSnS4
Before proceeding to our high-pressure results for the DKS
phase, we find it useful first to briefly address the effects of
the Cu/Zn anti-site disorder in the structural and vibrational
properties of Cu2ZnSnS4. As we mentioned earlier, this type
of disorder is mainly restricted in the z = ¼ and z = ¾ cati-
onic planes of the I
4
KS phase due to the ZnCu and CuZn
anti-site exchange (Fig.1) [11, 25, 28]. Consequently, this
random distribution of the Zn2+ and Cu+ cations leads to
the adoption of the ‘more symmetric’ I
4
2m DKS phase.
Except from the change in space group, the Cu/Zn disorder
results also in an expansion of the c-axis due to the inequiva-
lence of the Zn–S and Cu–S bond length values; the a-axis,
on the other hand, does not appear to be affected [15, 46].
Regarding now the Raman activity, a total set of 14
Raman-active modes is expected for the DKS phase [24, 50]:
whereas 15 Raman-active modes are predicted for the
ordered Cu2ZnSnS4 KS phase [51]:
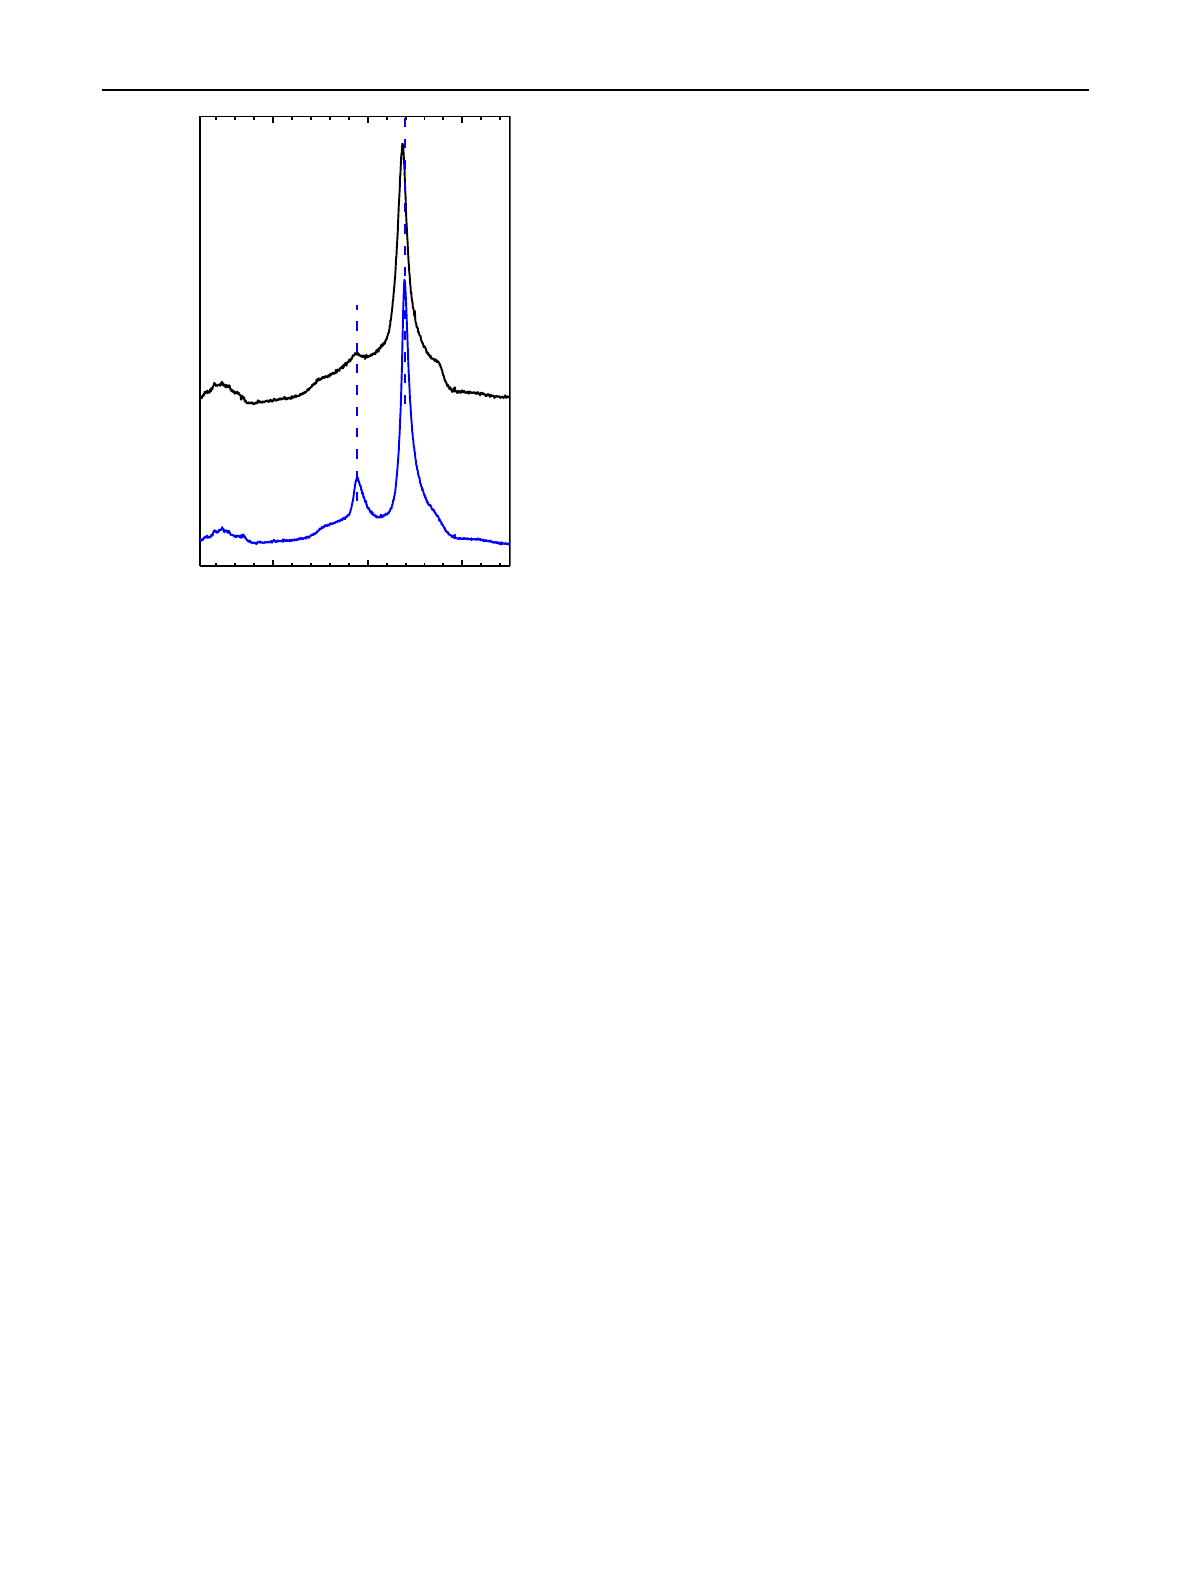
In Fig.3, we compare the Raman spectra of the DKS and
KS Cu2ZnSnS4 modifications measured at ambient condi-
tions with the same experimental parameters (λ = 473nm).
Both of these KS and DKS samples were readily available
(1)
Γ=2A1
+
2B1
+
4B2
+
6E
(2)
Γ=3A +6B + 6E
Fig. 2 The GeSb-type unit cell (SG P4/mmm, Z=) used in our DFT
calculations. In order to match the number of atoms of the DKS unit
cell, we use 2 GeSb-type unit cells stacked along the c-axis. The
brown, magenta, gray, and yellow spheres represent Cu+, Zn2+, Sn4+,
and S2− ions, respectively. Notice that in the GeSb-type structure, all
of the Cu+, Zn2+, Sn4+ cations are randomly distributed in the same
Wyckoff site 2a, whereas the S2− anions occupy the Wyckoff position
2b
I.Efthimiopoulos et al.
1 3
616 Page 4 of 11
in polycrystalline powder form and originate from the
same source [27, 28]. Generally, the ambient-pressure KS
Cu2ZnSnS4 Raman response is consistent with the reported
Raman spectra collected either with green or blue laser
light excitation, with the most intense Raman features lying
at ~ 291 cm−1 and ~ 338 cm−1 [13, 51–53]. These Raman
peaks correspond to vibrations of A symmetry and reflect
sulfur motions mainly along the ab plane (291 cm−1) and the
c-axis (338 cm−1), respectively [54].
Coming now to the DKS sample, the main Raman-related
differences between the KS and DKS modifications are: (1)
the slight broadening (by ~ 4 cm−1) and frequency downshift
of the strongest 338 cm−1 KS peak (down to 335 cm−1) and
(2) the notable Raman intensity reduction of the 291 cm−1
KS mode. Both of these observations are consistent with the
KS → DKS Raman-related changes reported in the litera-
ture [13, 31]. We should point out that the frequency drop
of the strong 338 cm−1 KS peak (S motions along c-axis)
upon passing to the DKS modification is connected with
the expansion of the c-axis in the latter due to the Cu/Zn
exchange. Given that the Cu/Zn cationic disorder does not
seemingly affect the a-axis as mentioned earlier; however, no
apparent frequency shift would be expected for the 291 cm−1
KS peak present also in the DKS phase (S motions mainly
along the ab-plane). Contrastingly, the Cu/Zn disorder has
a pronounced influence on the 291 cm−1 Raman peak inten-
sity, leading to a substantial reduction (Fig.3); the latter
effect has been frequently used in the literature as a means
of monitoring the Cu/Zn disorder in Cu2ZnSnS4 thin films
via resonant Raman scattering [55–57].
We finally mention that the presence of Cu/Zn disorder
diminishes the electronic/optical band gap of Cu2ZnSnS4 by
up to 200meV, thus effectively affecting the photovoltaic
properties of the material [5, 16, 56].
3.2 High‑pressure Raman investigation ofDKS
Cu2ZnSnS4
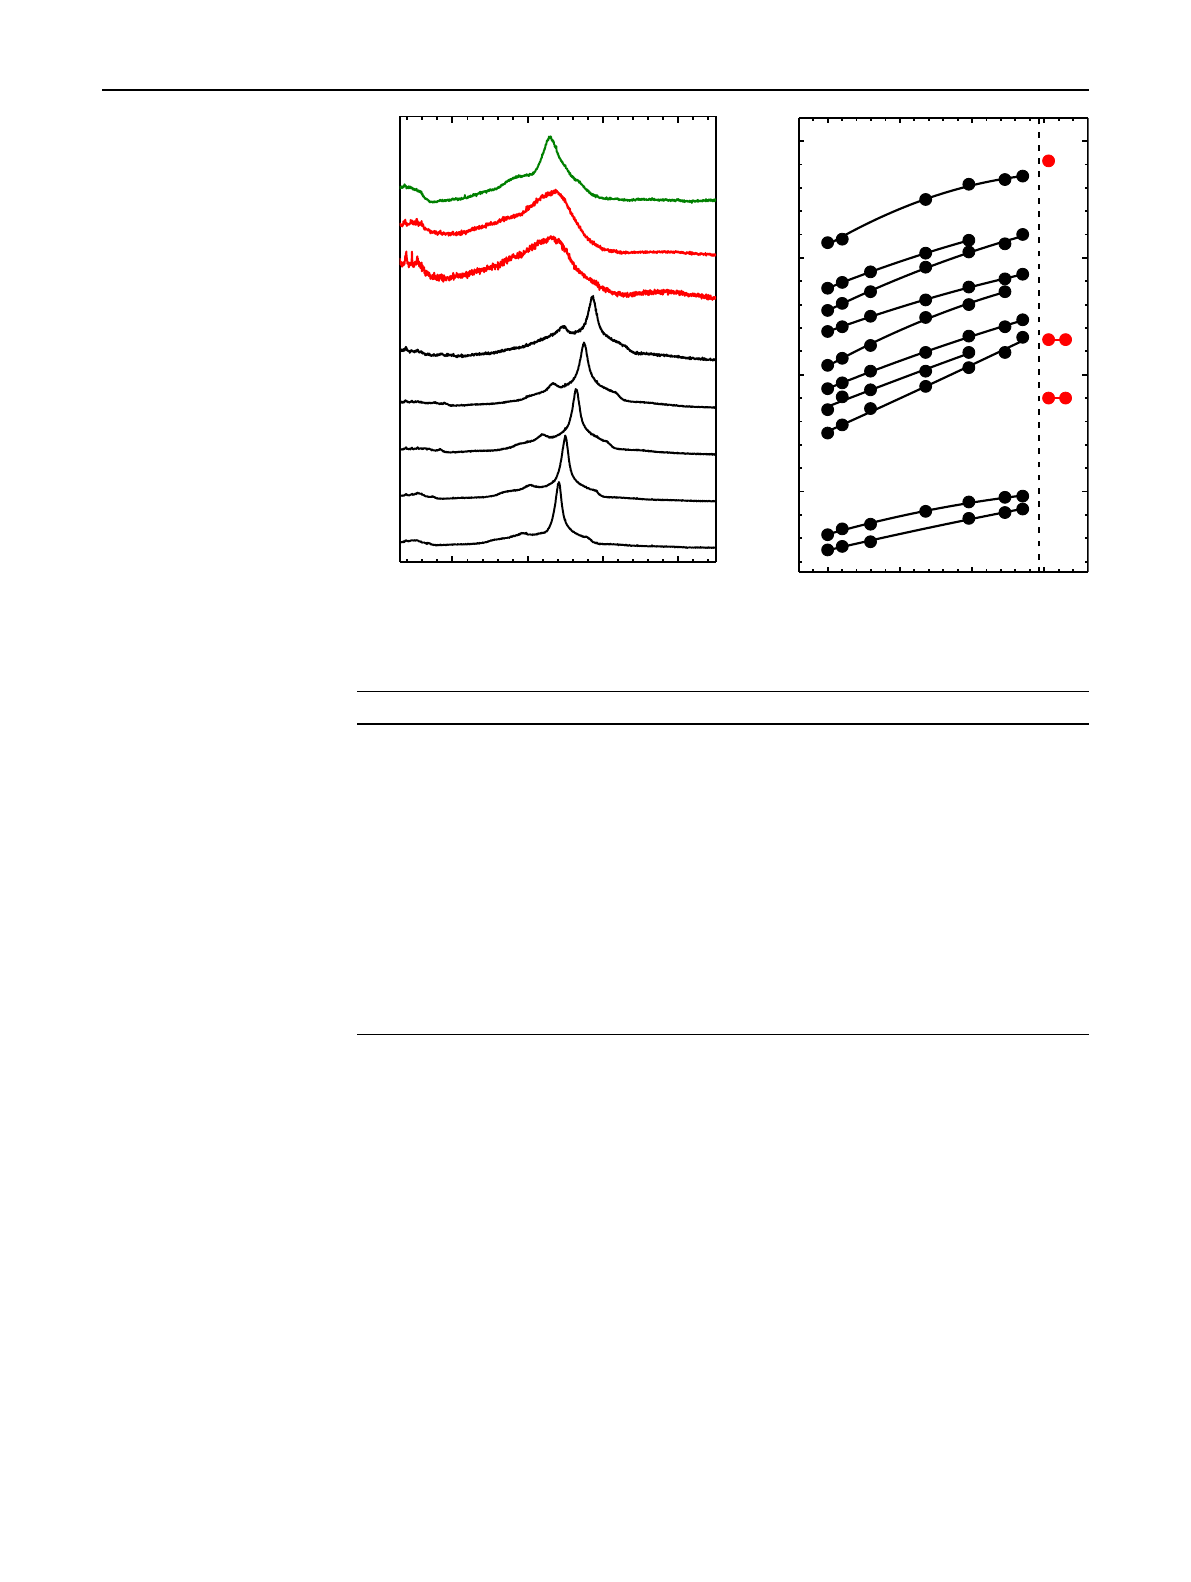
In Fig.4, we present collectively our high-pressure Raman
spectroscopic results on DKS Cu2ZnSnS4. At ambient condi-
tions, we could resolve 10 Raman-active modes for the DKS
modification (Table1) out of the 14 expected (Eq.1). We
note that only 3–4 Raman-active modes are clearly visual-
ized in our Raman spectra (Fig.4a); the remaining Raman
features arise from the careful inspection and deconvolution
of the low-intensity part of the measured spectra.
As already shown (Fig.3), the strongest Raman features
of the DKS phase at ambient conditions are the two Raman
peaks at 291 cm−1 and 335 cm−1. Both of these modes, as
well as the rest of the resolved DKS Raman peaks, exhibit
a rather regular behavior under compression, with their
frequencies shifting to higher values upon increasing pres-
sure (Fig.4b). Contrary to its KS counterpart, no additional
changes are observed in the DKS Cu2ZnSnS4 Raman spectra
upon increasing pressure, e.g., the gradual emergence of a
sideband in the strongest 335 cm−1 Raman mode as in the
KS case [19].
A clear change of the DKS Cu2ZnSnS4 Raman spectra
can be evidenced close to 15GPa, with the vanishing of the
DKS-related Raman features and the appearance of a broad
band centered at ~ 320 cm−1 (Fig.4a). In conjunction with
our high-pressure XRD results presented in the next Section,
this Raman-related change is the signature of a pressure-
induced structural transition of the DKS Cu2ZnSnS4 com-
pound toward a disordered GeSb-type phase, similar to KS
Cu2ZnSnS4 [19]. We should note here that no first-order
Raman activity is expected for the GeSb structure according
to group theory [61]; the size inequivalence of the Cu, Zn,
and Sn cations occupying the unique Wyckoff site available
in the GeSb-type structure, however, may result in disorder-
induced Raman activity [62].
Upon full decompression, we recover a Raman signal
reminiscent of the original DKS phase, yet with substantial
disorder as indicated by the broad Raman features (Fig.4a).
As we discuss below, this recovered phase corresponds to
a disordered zinc blende/sphalerite-type structure, a differ-
ently disordered phase compared to the DKS Cu2ZnSnS4
modification. We note finally that both the GeSb-type and
ZB-type Raman spectra of the DKS and KS Cu2ZnSnS4
modifications appear essentially identical {see Fig.4a above
& Fig.2b from Ref. [19]}.
200 300 400
DKS
).u.a(ytisnetninamaR
Raman shift (cm
-1
)
KS
Cu2ZnSnS4
P = 1 bar
291
338
335
Fig. 3 Raman spectra of the DKS (black, top) and the KS (blue, bot-
tom) Cu2ZnSnS4 modifications at ambient conditions (λ = 473nm)
High-pressure behavior ofdisodered kesterite-type Cu2ZnSnS4
1 3
Page 5 of 11 616
3.3 Structure ofDKS Cu2ZnSnS4 underpressure
Following our Raman results, we have performed insitu
high-pressure XRD investigations on DKS Cu2ZnSnS4 in
order to identify the structural changes under compres-
sion. We should mention that minor traces of Cu2S were
detected at ambient conditions, a well-known secondary
phase formed during the synthesis of Cu2ZnSnS4 [12].
The results are presented in Fig.5. We can observe that
the DKS phase persists up to ~ 15GPa; at this pressure, the
vanishing and merging of individual DKS Bragg peaks, as
well as the appearance of novel Bragg features in the XRD
patterns, denote a clear structural transition. The structural
Fig. 4 a Raman spectra of
Cu2ZnSnS4 at selected pressures
(λ = 473nm, T = 300K). The
black, red, and green spectra
correspond to the DKS, GeSb-
type, and ZB-type phases,
respectively. b Raman mode
frequency evolution as a func-
tion of pressure for the DKS
(black) and the GeSb-type (red)
Cu2ZnSnS4 phases. The solid
lines passing through the data
points representpolynomial
least square fittings. The vertical
dashed line indicates the DKS-
to-GeSb-type transition
200 300 400 500
).u.a(ytisnetninamaR
Raman shift (cm-1)
0.7
2.7
6.5
9.5
13.2
15
18.8
1 bar (R)
P (GPa)
DKS
(a)
0510 15
200
300
400
500
mc(tfihsnamaR
-1
)
Pressure (GPa)
DKS
(b)
Table 1 Assignment [51, 58,
59], zero-pressure frequencies
ω0, pressure coefficients, and
mode Grüneisen parameters
γi of the Raman-active modes
of DKS Cu2ZnSnS4 and its
high-pressure GeSb-type
modification.
The Raman mode pressure dependence is given by the relation: ωi(P) = ωi0 + aiP + biP2. The mode Grü-
neisen parameters are estimated from the equation: γi = (B0/ωi0) × (∂ωi/∂P), where B0 = 43GPa is the bulk
modulus at ambient conditions for the DKS phase, as estimated here (Table2). The data in parentheses
correspond to earlier results for the KS phase [19]
a We have additionally detected a low-intensity Raman feature at 411 cm−1; since no Raman activity
is expected in this frequency region for either the KS or DKS-Cu2ZnSnS4 phases [51, 59, 60], and the
411 cm−1 band does not correspond to any known Cu2ZnSnS4-related impurity [53], we tentatively assign
it as a second-order Raman feature
Mode symmetry ωi0 (cm−1) ∂ωi/∂P (cm−1/GPa) ∂2ωi/∂P2 (cm−1/GPa2)γi
B2 (E) 150 (146) 2.9 (2.7) − 0.02 0.83
E (B) 163 (168) 3.5 (2.2) − 0.07 0.92
E (E) 251 (254) 5.6 (5.1) - 0.96
E (A) 273 (270) 4.8 (5.1) - 0.76
A1 (A) 290 (291) 5 (4.2) - 0.74
B1 (E) 307 (299) 6.7 (8.7) − 0.13 (− 0.24) 0.94
A1 (A) 335 (338) 4.5 (4.7) − (− 0.09) 0.58
E (B) 355 (356) 6 (6) − 0.09 (− 0.09) 0.73
B2 (B) 374 (369) 4.9 (4.7) - 0.56
Second-order 411 (411)a7.2 (5.8) − 0.21 (− 0.11) 0.75
GeSb-type 280 (280) 0.1 (0.4)
330 (284) 0.2 (2.8)
Loading more pages...