
Factors influencing thermal conductivity and compressive strength of
natural fiber-reinforced geopolymer foams
Katharina Walbrück
a
,
*
, Lisabeth Drewler
a
, Steffen Witzleben
a
, Dietmar Stephan
b
a
Department of Natural Sciences, Bonn-Rhine-Sieg University of Applied Sciences, von-Liebig-Str. 20, 53359, Rheinbach, Germany
b
Building Materials and Construction Chemistry, Department of Civil Engineering, Technische Universit€
at Berlin, Gustav-Meyer-Allee 25, 13355, Berlin, Germany
ARTICLE INFO
Keywords:
Geopolymer
Foaming
Fiber reinforcement
Miscanthus
Thermal conductivity
Compressive strength
ABSTRACT
New sustainable, environmentally friendly materials for thermal insulation of buildings are necessary to reduce
their carbon footprints. In this study, Miscanthus fiber-reinforced geopolymer composites, foamed with sodium
dodecyl sulfate (SDS), were developed using fly ash as a geopolymer precursor. The effects of fiber content, fiber
size, curing temperature, foaming agent content, fumed silica specific surface area and fumed silica content on
thermal conductivity and compressive strength were evaluated using a Plackett-Burman design of experiment.
Furthermore, the microstructure of geopolymer composites was investigated using X-ray diffraction (XRD), X-ray
micro-computed tomography (
μ
CT) and scanning electron microscopy (SEM). The measured characteristic values
were in the following ranges: Thermal conductivity 0.057 W (m K)
1
to 0.127 W (m K)
1
, compressive strength
0.007 MPa–0.719 MPa and porosity 49 vol% to 76 vol%. The results reveal an enhancement of thermal con-
ductivity by elevated fiber size and foaming agent content. In contrast, the compressive strength is enhanced by
high fiber content. Additionally, SEM images indicate a good interaction between the fibers and the geopolymer
matrix, because nearly the whole fiber surface is covered by the geopolymer.
1. Introduction
A variety of thermal insulation materials is available on the European
market. About 60% of the market is dominated by mineral or inorganic
fibrous materials like glass and stone wool, 30% by organic foamy ma-
terials (expanded polystyrene, extruded polystyrene and polyurethane)
and 10% account for combined materials (wool-wool, gypsum-foam) and
new technology materials like nano-cellular-foams or transparent mate-
rials [1]. However, due to the energy consumption during the production
and the use of non-renewable materials, thermal insulations cause sig-
nificant adverse effects on the environment. Especially in respect of the
advancing climate change, limited fossil resources and the global energy
demand, the reduction of energy consumption of buildings is one of the
most important challenges of the 20th century. Therefore, the develop-
ment of sustainable thermal insulation materials based on renewable
resources and industrial waste are becoming more attractive [2,3].
Very promising groups of renewable resources with numerous ad-
vantages are fast-growing low input grasses such as Miscanthus. Mis-
canthus, which is originates from (sub) tropical regions in Asia, is a
perennial rhizomatous sweet grass (Poaceae) with a C
4
photosynthetic
pathway [4]. Due to the remarkable adaptability to a wide range of
environmental conditions, Miscanthus is suitable for establishment and
distribution under European climatic conditions. Currently, the genus
Miscanthus includes approximately 17 species, especially; Miscanthus
sinensis,Miscanthus sacchariflorus, Miscanthus floridulus and Miscanthus x
giganteus have received much attention in Europe. The genotype Mis-
canthus x giganteus is a triploid hybrid between the diploid Miscanthus
sinensis and the tetraploid Miscanthus sacchariflorus. [5–9] Due to its C
4
photosynthetic pathway, Miscanthus is extremely efficient in CO
2
capture
and storage. Unlike C
3
plants such as rice, C
4
plants are able to fixCO
2
into the four-carbon (C
4
) compounds malate and aspartate [8–13]. Be-
side the increased photosynthesis activity, Miscanthus possesses several
further advantages such as low density, low thermal conductivity, high
biomass yield and low greenhouse gas emissions [4,14,15].
In the context of advancing climate change, irresponsible waste
management is besides increasing CO
2
emissions, one of the significant
problems. Cement is the most essential binding material in the world but
releases a vast amount of CO
2
during production. Nowadays, by partially
replacing it with industrial waste like fly ash, metakaolin, silica fume,
steel slag and zeolite, the usage of cement can be minimized. However, in
order to reduce greenhouse gas emissions, the demand for sustainable,
eco-friendly building materials is growing. Aluminosilicate polymers, so-
* Corresponding author.
Contents lists available at ScienceDirect
Open Ceramics
journal homepage: www.editorialmanager.com/oceram
https://doi.org/10.1016/j.oceram.2021.100065
Received 4 December 2020; Received in revised form 26 January 2021; Accepted 27 January 2021
Available online 31 January 2021
2666-5395/©2021 The Authors. Published by Elsevier Ltd on behalf of European Ceramic Society. This is an open access article under the CC BY-NC-ND license
(http://creativecommons.org/licenses/by-nc-nd/4.0/).
Open Ceramics 5 (2021) 100065

called geopolymers, offers a novel way to produce sustainable, environ-
mentally friendly building materials. In principle, these are two-
component systems consisting of an aluminosilicate source and an
alkaline activator, usually an alkali metal silicate or hydroxide. The most
commonly used aluminosilicate components are fly ash (FA), granulated
blast-furnace slag (GGBFS) or metakaolin (MK). The three-dimensional
aluminosilicate network consists of cross-linked aluminate and silicate
tetrahedrons, whose negative charge is balanced by the incorporation of
alkali cations such as Na
þ
or K
þ
[16–25].
In order to combine the advantages of foam concrete and geo-
polymers, recent innovations in the field of geopolymers, are focused on
the development of geopolymer foams for thermal insulation. The pro-
duction of geopolymer foams is done either by chemical or mechanical
foaming or through the formation of syntactic foams. In the chemical
foaming method, the voids are generated after adding aluminum powder
or hydrogen peroxide as a result of a gas releasing reaction. In compar-
ison, mechanical foaming is either performed by mixing a pre-made foam
with the geopolymer slurry or during the mixing process after adding a
surfactant. The third method for the production of geopolymer foams is
the formation of syntactic foams. Hereto, hollow spheres like ceno-
spheres, hollow glass micro-balls or hollow polymeric microspheres are
embedded into the binding matrix [20,21,26–29]. In the present study,
geopolymer foams reinforced with Miscanthus x giganteus fibers are syn-
thesized, and the effects of fiber content, fiber size, foaming agent con-
tent, curing temperature, fumed silica specific surface area and fumed
silica content is investigated using Plackett-Burman design to find the
optimum thermal conductivity and compressive strength.
1.1. Design of experiments
In the field of research and production, experiments are often con-
ducted aiming at optimizing a specific process. This optimum can depend
on various parameters and it can be measured by one or more properties.
Conventional approaches to find this optimum are trial and error or
changing one factor at a time. For complex problems with a great number
of influencing variables, they have proven to be ineffective, regarding
time, costs and resources [30–32]. Design of experiments (DoE) is a
systematic approach for product and process optimization using statis-
tical models, allowing understanding of how variables influence the
result. One of its advantages is testing multiple factors simultaneously,
thus minimizing the number of experiments required and making it an
efficient tool [31,33,34]. The DoE consists of two phases, screening and
optimizing: During factor screening, the most significant input variables
affecting the result of the experiment are identified. The aim is to reduce
the number of parameters demanding further investigation. These most
crucial influencing factors are further investigated in the following
optimization experiments to provide more details on the relationship
between the factors and the output variables [33,35]. Several different
types of experimental designs find application such as Bayesian experi-
mental design, block design, Box–Behnken design, central composite
design, fractional factorial design, optimal design, Plackett-Burman
design, Latin squares or Taguchi methods [30,32,36,37]. In this pre-
sent investigation, Plackett-Burman design using Minitab software is
applied. It is a two-level multifactorial design, meaning all influencing
factors are varied on a low and a high value. This method was selected
because it determines crucial factors as well as interactions using as few
experimental runs as possible [31,33,36]. Other possible design methods
often used for screening are 2-level fractional factorial design, supersat-
urated design and definitive screening design [31,33].
2. Material and methods
2.1. Materials
In order to prepare sustainable, environmentally friendly foamed
Table 1
Considered factors for the DOE and their high and low levels.
Factor Lower level Higher limit
Fiber content 30 wt% 40 wt%
Fiber size 125–250
μ
m 250–500
μ
m
Foaming agent content 0.2 wt% 0.4 wt%
Curing temperature 50 C70 C
Fumed silica specific surface area 90 m
2
g
1
200 m
2
g
1
Fumed silica content 1.0 wt% 3.0 wt%
Table 2
Mixture design combinations for natural fiber-reinforced geopolymer foam concrete.
Combination Fiber content Fiber size Foaming agent content Curing temperature Fumed silica specific surface area Fumed silica content
[wt%] [
μ
m] [wt%] [C] [m
2
g
1
] [wt%]
S1 40 125 0.2 70 90 1
S2 40 250 0.4 50 90 1
S3 30 250 0.2 70 90 3
S4 40 125 0.4 70 200 1
S5 40 250 0.4 50 90 3
S6 40 250 0.2 70 200 3
S7 30 250 0.4 70 200 1
S8 30 125 0.4 70 90 3
S9 30 125 0.4 50 200 3
S10 40 125 0.2 50 200 3
S11 30 250 0.2 50 200 1
S12 30 125 0.2 50 90 1
Table 3
Effects and P-values of the factors for thermal conductivity.
Source Effect P-Value Significance
Constant 0.000
Fiber content 0.13470 0.073 significant
Fiber size 0.02990 0.004 significant
Foaming agent content 0.02577 0.008 significant
Curing temperature 0.00870 0.204 not significant
Fumed silica specific surface area 0.00970 0.164 not significant
Fumed silica content 0.00970 0.164 not significant
Table 4
Effects and P-values of the factors for compressive strength.
Source Effect p-Value Significance
Constant 0.015
Fiber content 0.2246 0.094 significant
Fiber size 0.3142 0.038 significant
Foaming agent content 0.2474 0.074 significant
Curing temperature 0.0304 0.782 not significant
Fumed silica specific surface area 0.0744 0.509 not significant
Fumed silica content 0.0856 0.451 not significant
K. Walbrück et al. Open Ceramics 5 (2021) 100065
2
geopolymer composites, fly ash (FA), sodium silicate, Miscanthus x
giganteus, sodium dodecyl sulfate (SDS) and fumed silica nanoparticles
are used. The fly ash with the commercial name EFA-Füller®HP is
supplied by BauMineral GmbH, Germany. Sodium silicate with a
composition of 28.50 wt% SiO
2
and 8.29 wt% Na
2
O is obtained from Carl
Roth GmbH þCo. KG, Germany. The Miscanthus x giganteus was culti-
vated in 2012 at the field lab Campus Klein-Altendorf (University of
Bonn, Germany) and harvested in April 2018. The dry biomass was
milled using a BHS 100 (Buschhoff) hammer mill equipped with a 1.1
mm sieve (University of Bonn). As foaming agent sodium dodecyl sulfate
(SDS), from Carl Roth, is used. The fumed silica nanoparticles Aerosil®
90 and Aerosil®200 (Evonik Industries AG, Germany) are used as a foam
stabilizer.
2.2. Experimental design
The geopolymer experiments were performed using design of exper-
iments (DoE) as a tool to evaluate the effects of fiber content, fiber size,
foaming agent content, curing temperature, specific surface area of
fumed silica and fumed silica content on thermal conductivity and
compressive strength of the natural fiber-reinforced geopolymer foams.
The DoE used was a Plackett-Burman design, consisting of six factors and
12 experiments (N ¼12), as presented in Table 2. The six factors
considered in this study are summarized in Table 1, including their high
and low levels. The selection of the high and low levels were based on
preliminary tests and through a review of relevant literature [21,38]. The
responses analyzed were thermal conductivity and compressive strength.
The results were assessed by analysis of variances (ANOVA) and Pareto
diagram with Minitab 18 (Minitab, Inc., USA) to verify the factors dis-
playing a significance higher then 10%.
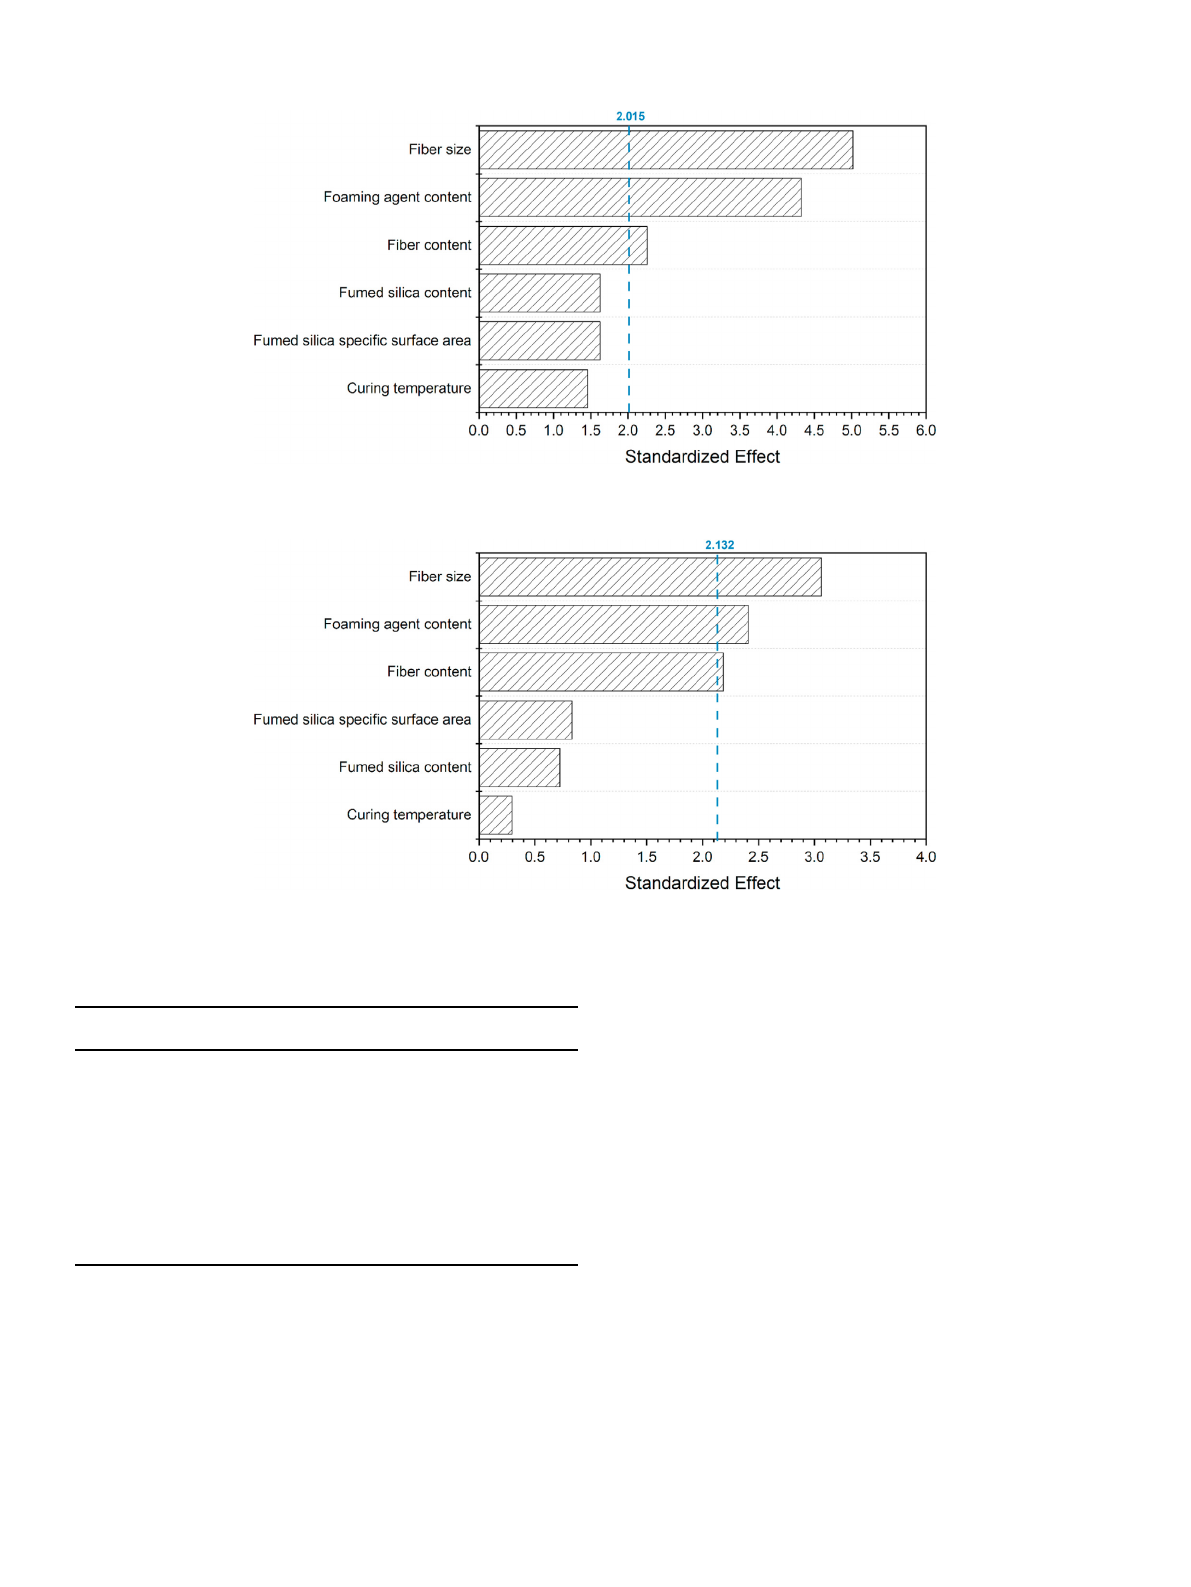
Fig. 1. Pareto plot of the standardized effects for thermal conductivity (
α
¼0.1).
Fig. 2. Pareto plot of the standardized effects for compressive strength (
α
¼0.1).
Table 5
Thermal conductivity and compressive strength.
Sample Thermal conductivity
W(mK)
1
Compressive strength MPa
S1 0.127 0.011 0.719 0.023
S2 0.062 0.004 0.017 0.002
S3 0.062 0.002 0.018 0.004
S4 0.091 0.023 0.390 0.173
S5 0.062 0.003 0.007 0.001
S6 0.079 0.004 0.196 0.019
S7 0.060 0.001 n.r.
a
S8 0.057 0.003 0.021 0.004
S9 0.093 0.013 0.174 0.035
S10 0.121 0.008 0.676 0.032
S11 0.088 0.006 0.272 0.018
S12 0.103 0.018 0.193 0.021
a
n. r. ¼no result.
K. Walbrück et al. Open Ceramics 5 (2021) 100065
3
2.3. Synthesis of natural fiber-reinforced geopolymer foams
Foam geopolymer concrete was prepared, by activating a dry mix of
fly ash, Miscanthus x giganteus, sodium dodecyl sulfate and fumed silica
(specific surface area 90 m
2
g
1
or 200 m
2
g
1
) with an alkaline solution.
The alkaline solution is a mixture of 64 wt% sodium silicate solution and
36 wt% water. The slurry was stirred at high speed (speed position 2 of
the mixer) for 5 min using a Hobart N50 mortar mixer. Afterwards, the
resultant mixture was poured into a 40 40 160 mm
3
triplet steel
mold for X-ray diffraction, X-ray micro-computed tomography and
scanning electron microscopy tests, and in 140 140 40 mm
3
steel
molds for thermal conductivity and compressive strength tests. The
samples were cured at 50 C/70 C and ambient pressure for 48 h and
afterwards at room temperature until 28 d.
2.4. Characterization
Characterization of the geopolymer foam concrete was carried out
using thermal conductivity tests, compressive strength, X-ray micro-
computed tomography (
μ
CT), X-ray diffraction (XRD) and scanning
electron microscopy (SEM).
2.4.1. Thermal conductivity
The thermal conductivity of the 140 140 40 mm
3
specimens was
measured by using a heat flow meter apparatus (HFM 446 Lambda Small,
Netzsch, Germany). Two external thermocouples were placed in the
center on the front and back side of the specimens with aluminum ad-
hesive tape. Three samples of each formulation were measured and for
each sample, at least six measurements were performed to ensure
reproducibility.
2.4.2. Compressive strength
A Z010 universal strength testing apparatus (1 kN and 10 kN capacity,
Zwick/Roell, Germany) with a testing speed of 2 mm min
1
was used to
determine the compressive strength. The samples (140 140 40 mm
3
)
were cut to a size of 60 60 40 mm
3
and the compressive strength was
measured at 10% deformation. Each measurement was carried out four
times.
2.4.3. X-ray micro-computed tomography
X-ray micro-computed tomography (
μ
CT) was used to determine the
porosity of natural fiber-reinforced geopolymer foam concrete. The
μ
CT
measurements were performed using SkyScan 1275 (Bruker) with a
micro focus X-ray tube (100 kV and 100
μ
A) and a flat-panel detector.
The samples (40 40 160 mm
3
) were cut with a diamond hole saw to
create a cylinder with a diameter of 20 mm. The cylindrical samples were
scanned over a 360interval with a rotation step of 0.5and a resolution
of 14
μ
m.
2.4.4. X-ray diffraction
X-ray diffraction (XRD) analysis was performed using a D2 Phaser X-
ray diffractometer (Bruker AXS) with a Cu K
α
radiation source (30 kV
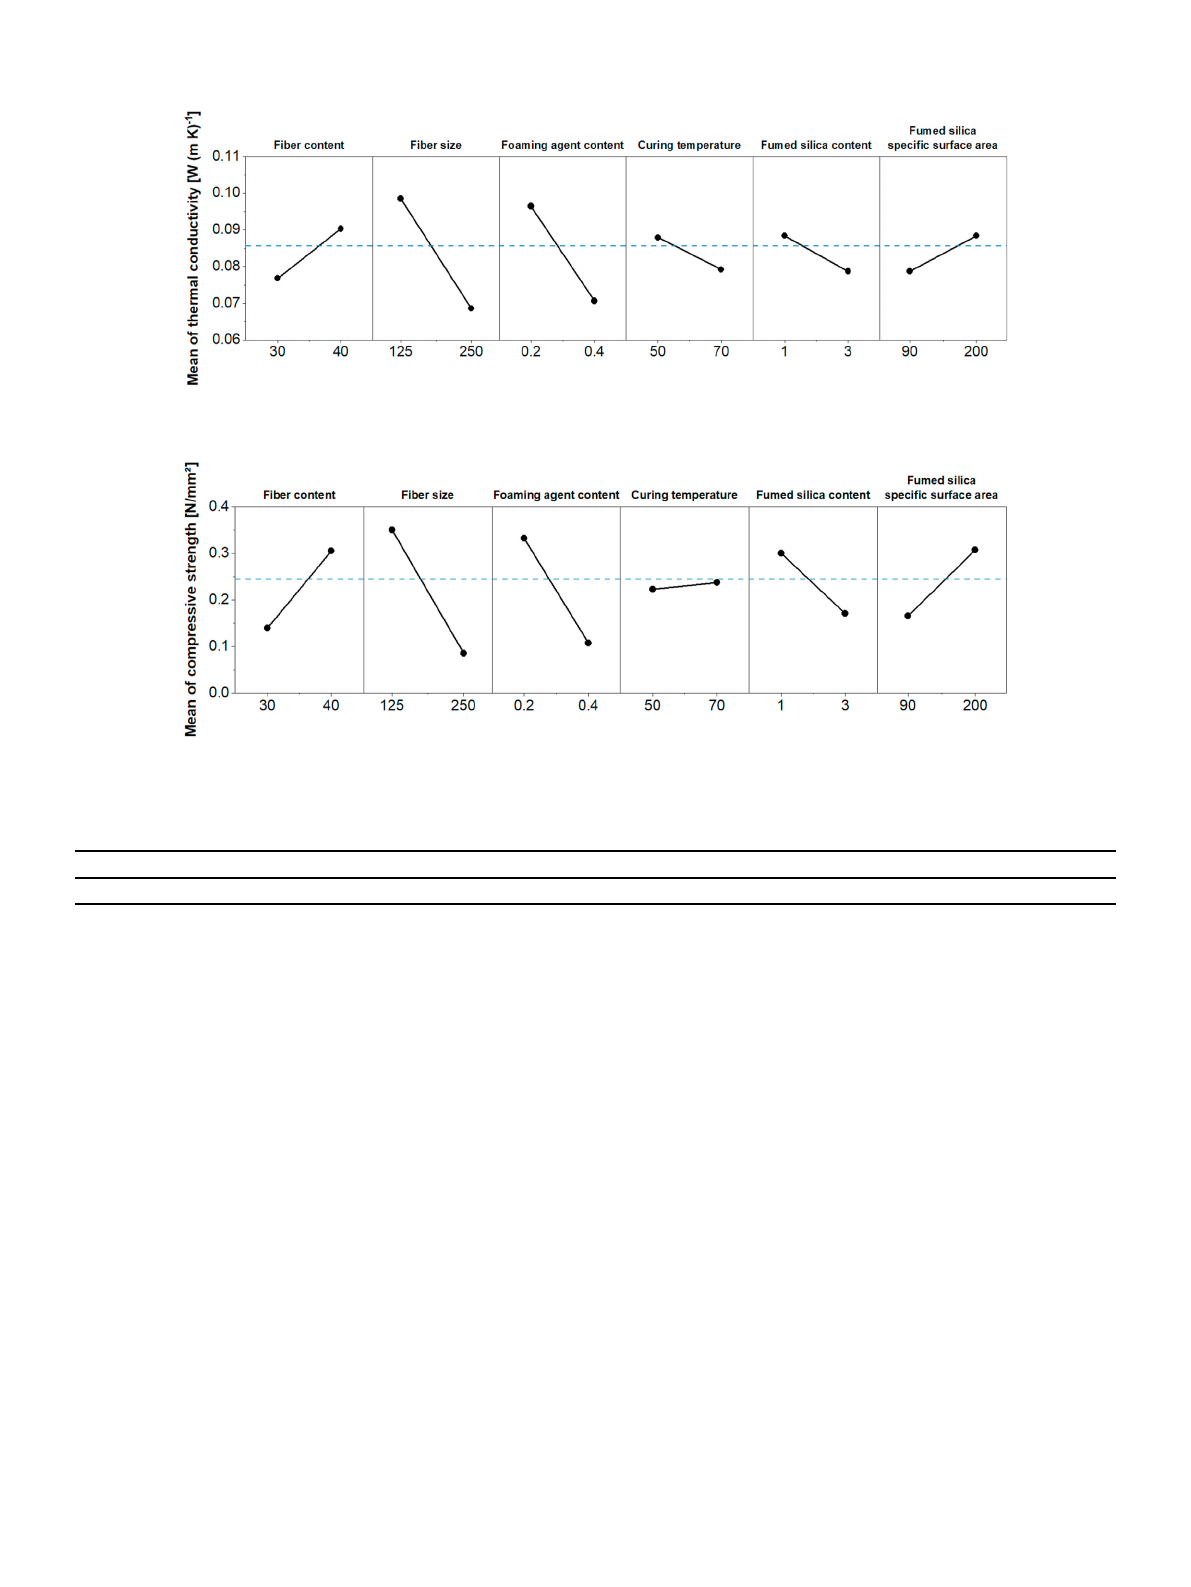
Fig. 3. Main effects plot for thermal conductivity.
Fig. 4. Main effects plot for compressive strength.
Table 6
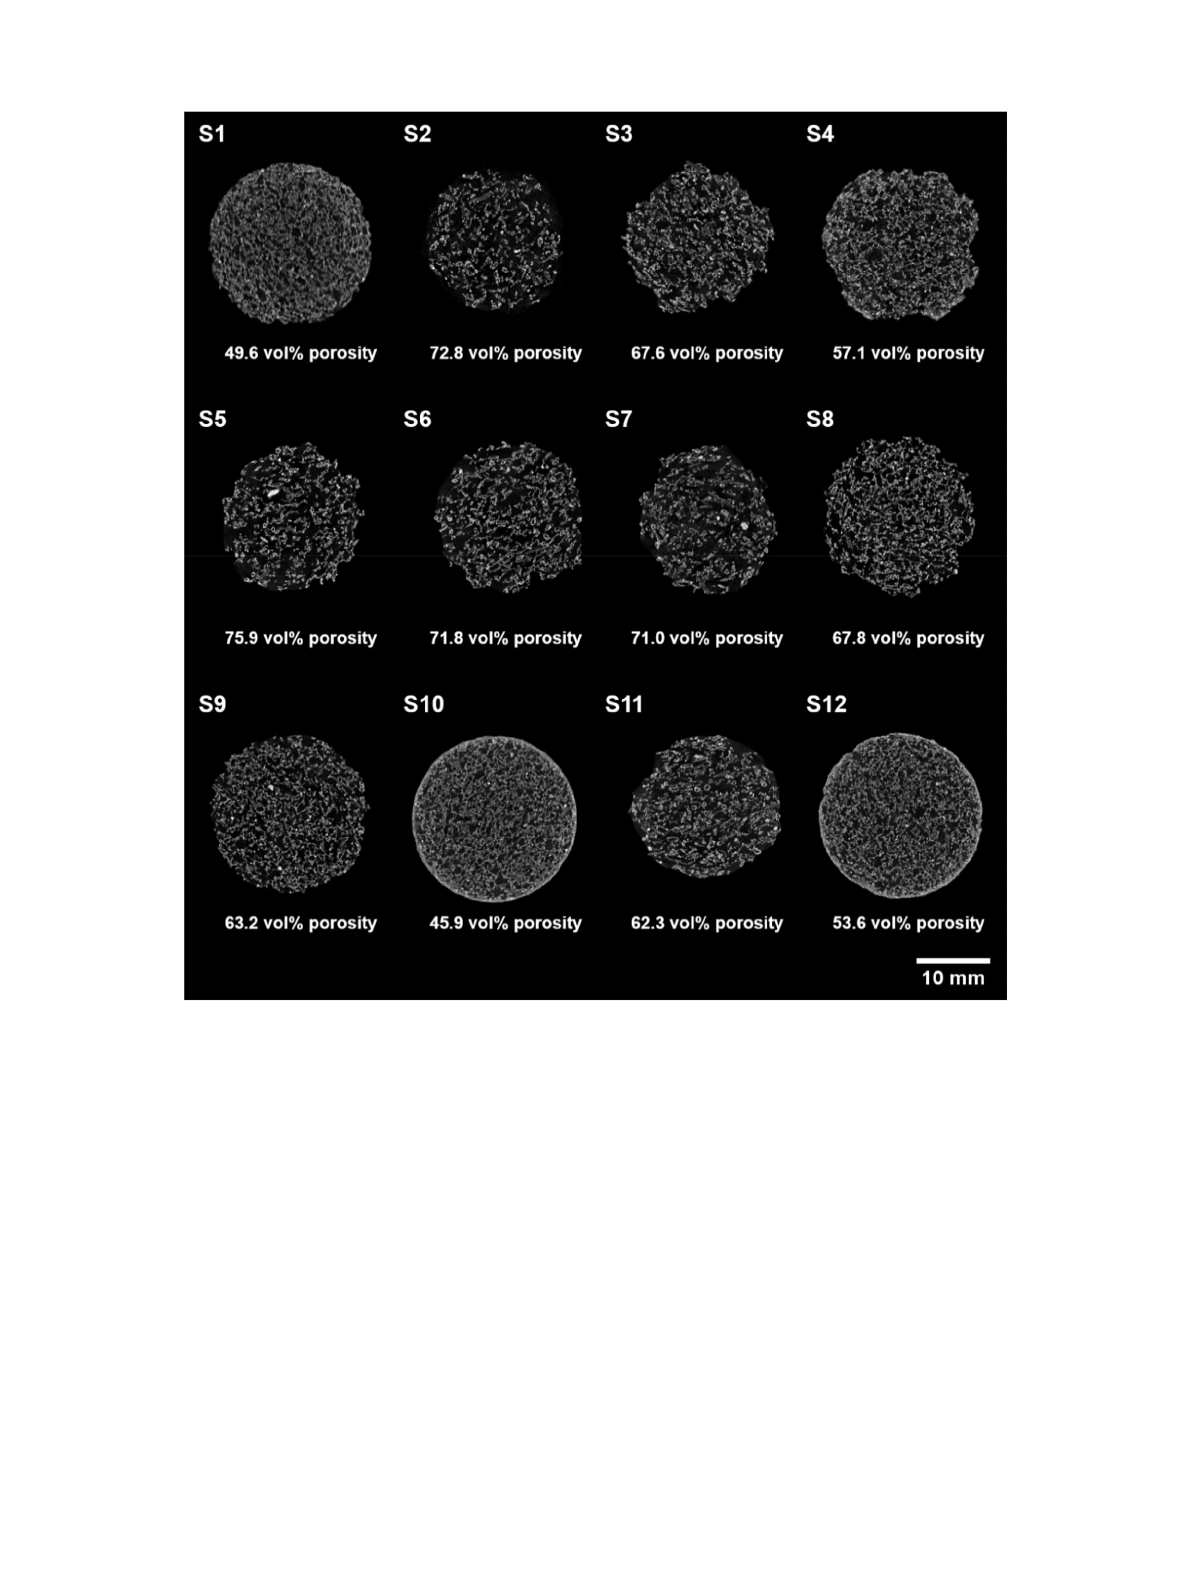
Total porosity of the samples obtained by micro tomography.
Sample S1 S2 S3 S4 S5 S6 S7 S8 S9 S10 S11 S12
Total porosity (vol%) 49.6 72.8 67.6 57.1 75.9 71.8 71.0 67.8 63.2 45.9 62.3 53.6
K. Walbrück et al. Open Ceramics 5 (2021) 100065
4
and 10 mA) and a LynxEye detector. The powder patterns are collected in
the 2θrange 10–65with a step size of 0.01and a time of 2.0 s step
1
.
The samples were prepared by grinding and mixing 600 mg of the geo-
polymer powder (<63
μ
m) with 20 mg of Lanthanum hexaboride (LaB
6
,
Sigma-Aldrich) as an internal standard. The use of an internal standard
allows the determination of the crystalline and amorphous content.
Diffrac. Eva and Diffrac. Topas software from Bruker were used for phase
identification and Rietveld refinement.
2.4.5. Scanning electron microscopy (SEM)
The surface morphology of the foamed geopolymer concrete was
investigated using a field emission scanning electron microscope JSM-
7200 F (JEOL). For the observation, the specimens were cut into small
pieces and were mounted on a bulk sample holder.
3. Results and discussion
3.1. Design of experiments
Analysis of variance (ANOVA) on thermal conductivity and
compressive strength of Miscanthus fiber-reinforced geopolymer foams
was used to determine the optimum level of the considered factors. As
shown in Tables 3 and 4, the fiber content, fiber size and foaming agent
content have the highest negative and positive effect on both thermal
conductivity and compressive strength. Furthermore, the P-value gives
information about the influence level of the different input parameters on
the response variable. A P-value less than
α
¼0.1 indicates an input
parameter with a significant influence. Thereby, both responses are
significantly influenced by the input parameters fiber size, foaming agent
content and fiber content. However, the other facts do not influence the
both responses.
To support the findings, the Pareto plot of the standardized effects in
Figs. 1 and 2 compare the significance of each effect. Any factor that
extends past the blue reference line is potentially important. For both
response variables, thermal conductivity and compressive strength, the
Pareto plot shows that the factors fiber size, foaming agent content and
fiber content are significant. However, the factors curing temperature,
fumed silica specific surface area and fumed silica content are not sig-
nificant for thermal conductivity and compressive strength.
Fig. 5.
μ
-CT cross-sectional images.
K. Walbrück et al. Open Ceramics 5 (2021) 100065
5
Loading more pages...