
JOURNAL OF QUATERNARY SCIENCE (2024) 39(1) 102–118 ISSN 0267-8179. DOI: 10.1002/jqs.3574
Quaternary alluvial paleosols of the Atbara River, eastern Sudan:
description and paleoenvironments
M. MOHAMMEDNOOR,
1,2,3
* F. BIBI,
2
A. EISAWI,
3,4
S. TSUKAMOTO
5
and R. BUSSERT
1
1
Technische Universität Berlin, Institute of Applied Geosciences, Berlin, Germany
2
Museum für Naturkunde, Leibniz Institute for Evolution and Biodiversity Science, Berlin, Germany
3
Department of Geology, University of Khartoum, Khartoum, Sudan
4
Al Neelain University, Faculty of Petroleum and Minerals, Khartoum, Sudan
5
Leibniz Institute for Applied Geophysics, Hannover, Germany
Received 12 May 2023; Revised 15 September 2023; Accepted 16 October 2023
ABSTRACT: Quaternary climatic changes in the Nile Basin and their effects on the evolution of African mammals and
vegetation are poorly understood, particularly for the last 1 Ma. Pleistocene (~230 to <17 ka) alluvial sediments exposed
along the middle stretches of the Atbara River in eastern Sudan are rich in fossil vertebrates and are ideal for
paleoenvironmental reconstruction during this time interval. We performed petrographic, mineralogical and
geochemical analyses on the middle Atbara paleosols to reconstruct the paleoclimate and paleolandscape. We
describe Aridisols/Calcisols characterized by calcretes and containing gypsum and halite, and Vertisols with pedogenic
slickensides and a relatively large amount of smectite. The paleosols indicate that the study area transitioned from an arid
to semi‐arid climate during Marine Isotope Stage (MIS)7/6, to a more humid climate during MIS5, and then a return to
more arid conditions during MIS2. The studied paleosols likely supported a range of grassland and wooded grassland
savanna habitats. Our study confirms that the Atbara River Valley provided favorable living conditions for Pleistocene
large mammal communities including Homo, potentially facilitating dispersals out of Africa through the Nile corridor.
©2023 The Authors Journal of Quaternary Science Published by John Wiley & Sons, Ltd.
KEYWORDS: Atbara River; calcrete; paleosols; Pleistocene; Sudan
Introduction
The East African region witnessed major climatic changes
during the Quaternary. Due to regional factors such as tectonic
activity in the East African Rift Valley, and global factors such
as the establishment of tropical Walker Circulation and
intensification of northern hemisphere glaciations (Maslin &
Trauth, 2009; Trauth et al., 2021), Plio‐Pleistocene African
environments shifted towards more open conditions with
grassland habitats expanding at the expense of woody cover
(Cerling et al., 2015). Over the last 8 Ma, the currently hyper‐
arid Saharan region has experienced numerous humid
episodes, with some 230 humid intervals identified in oceanic
dust records (Larrasoaña et al., 2013; Skonieczny et al., 2019),
the most recent of which occurred between 11 and 5 ka
(Tierney et al., 2017). During these ‘green Sahara’events,
grassland and shrubland were established across areas that are
today desert (Tierney et al., 2017; Blanchet et al., 2021).
An important region in this regard is the Sahel, which
encompasses Senegal, Mauritania, Mali, Burkina Faso, Niger,
Nigeria, Chad, Sudan and Eritrea. Today this area straddles the
transitional zone between the humid savannas and forests of
central Africa to the south, and the arid savannas and Sahara
Desert to the north. Despite stretching over 5900 km from east to
west, very little information is present on Pleistocene environ-
mental conditions within this large area from terrestrial records.
Furthermore, in the eastern Sahel, the Nile Valley is a unique
hydrographical feature that connects equatorial eastern Africa
with the Mediterranean, forming an important dispersal corridor
for vegetation and animals through the Sahara. The Nile has been
in existence in some form since the Oligocene (Fielding
et al., 2018; Faccenna et al., 2019) but studies revealing
information on paleoenvironmental changes from the terrestrial
sedimentary record within the Nile Basin are scarce, in particular
regarding the last 1 Ma. To close this information gap, it is
important to investigate sediment archives that document long
periods of the Pleistocene and contain fossils and archeological
finds. Such sediment archives exist in eastern Sudan along the
Atbara River, which today has its headwaters in the northern
Ethiopian Plateau and is the last major tributary of the Nile before
it flows through the Sahara. Pleistocene deposits along the Atbara
have produced mammalian fossils and stone tools from the
Acheulean and Middle Stone Age, which indicate that the Atbara
River or its precursors and the surrounding floodplains provided
suitable habitats for terrestrial mammal communities including
hominins (Abbate et al., 2010; Masojćet al., 2019, 2021; Ehlert
et al., 2022). Additionally, these sediments host fossil soils
(paleosols) that provide information on climatic and environ-
mental conditions during deposition.
Here, we report the results of mineralogical, petrographic and
geochemical investigations of the middle Atbara paleosols in
order to reconstruct the Pleistocene paleoenvironments of this
transitional zone between the humid and arid Sahelian belt.
Geological background
The study area is located near Khashm El Girba, at the northern
rim of the Gedaref Basin in eastern Sudan (Fig. 1). The Gedaref
©2023 The Authors Journal of Quaternary Science Published by John Wiley & Sons, Ltd.
This is an open access article under the terms of the Creative Commons Attribution License, which permits use, distribution and reproduction in any
medium, provided the original work is properly cited.
*
Correspondence: M. Mohammednoor, as above.
E‐mail: [email protected]
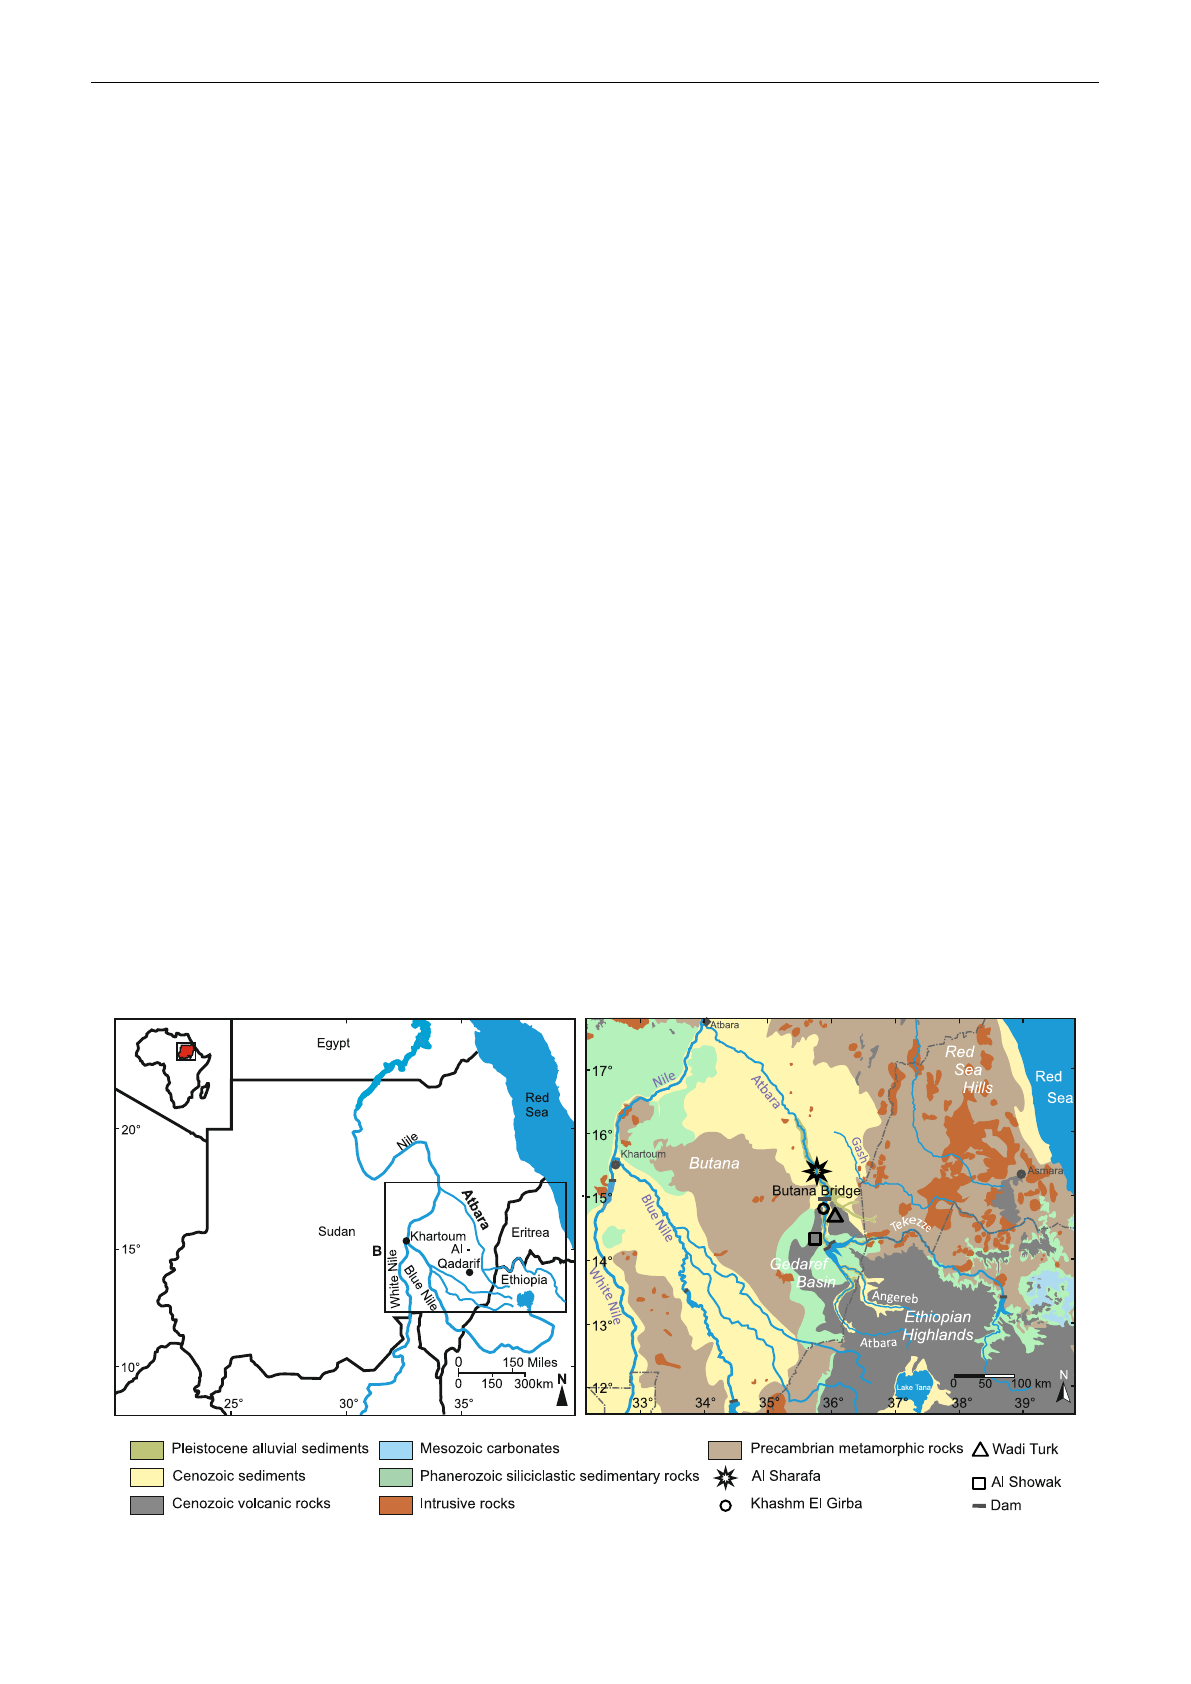
Basin is surrounded by Precambrian metavolcanics and metasedi-
ments (Fig. 1b) and is filled with fluvial to deltaic sediments of the
Late Cretaceous Gedaref Formation (Eisawi and Schrank, 2009).
These are partially overlain by Cenozoic basalts (Vail, 1988;
Fig. 1b) and intruded by basaltic sills and dykes.
Quaternary alluvial sediments exposed along the middle
Atbara River comprise sands and gravels representing channel
deposits alternating with silt and clay floodplain deposits. The
sediments contain abundant vertebrate remains and stone
tools. The Pleistocene alluvial sediments were studied by
Abbate et al. (2010) over a 20‐km stretch north of Khashm El
Girba, around Butana Bridge. The authors identified and
named two major sedimentary units: the older Butana Bridge
Synthem (BBS) and the younger Khashm El Girba Synthem
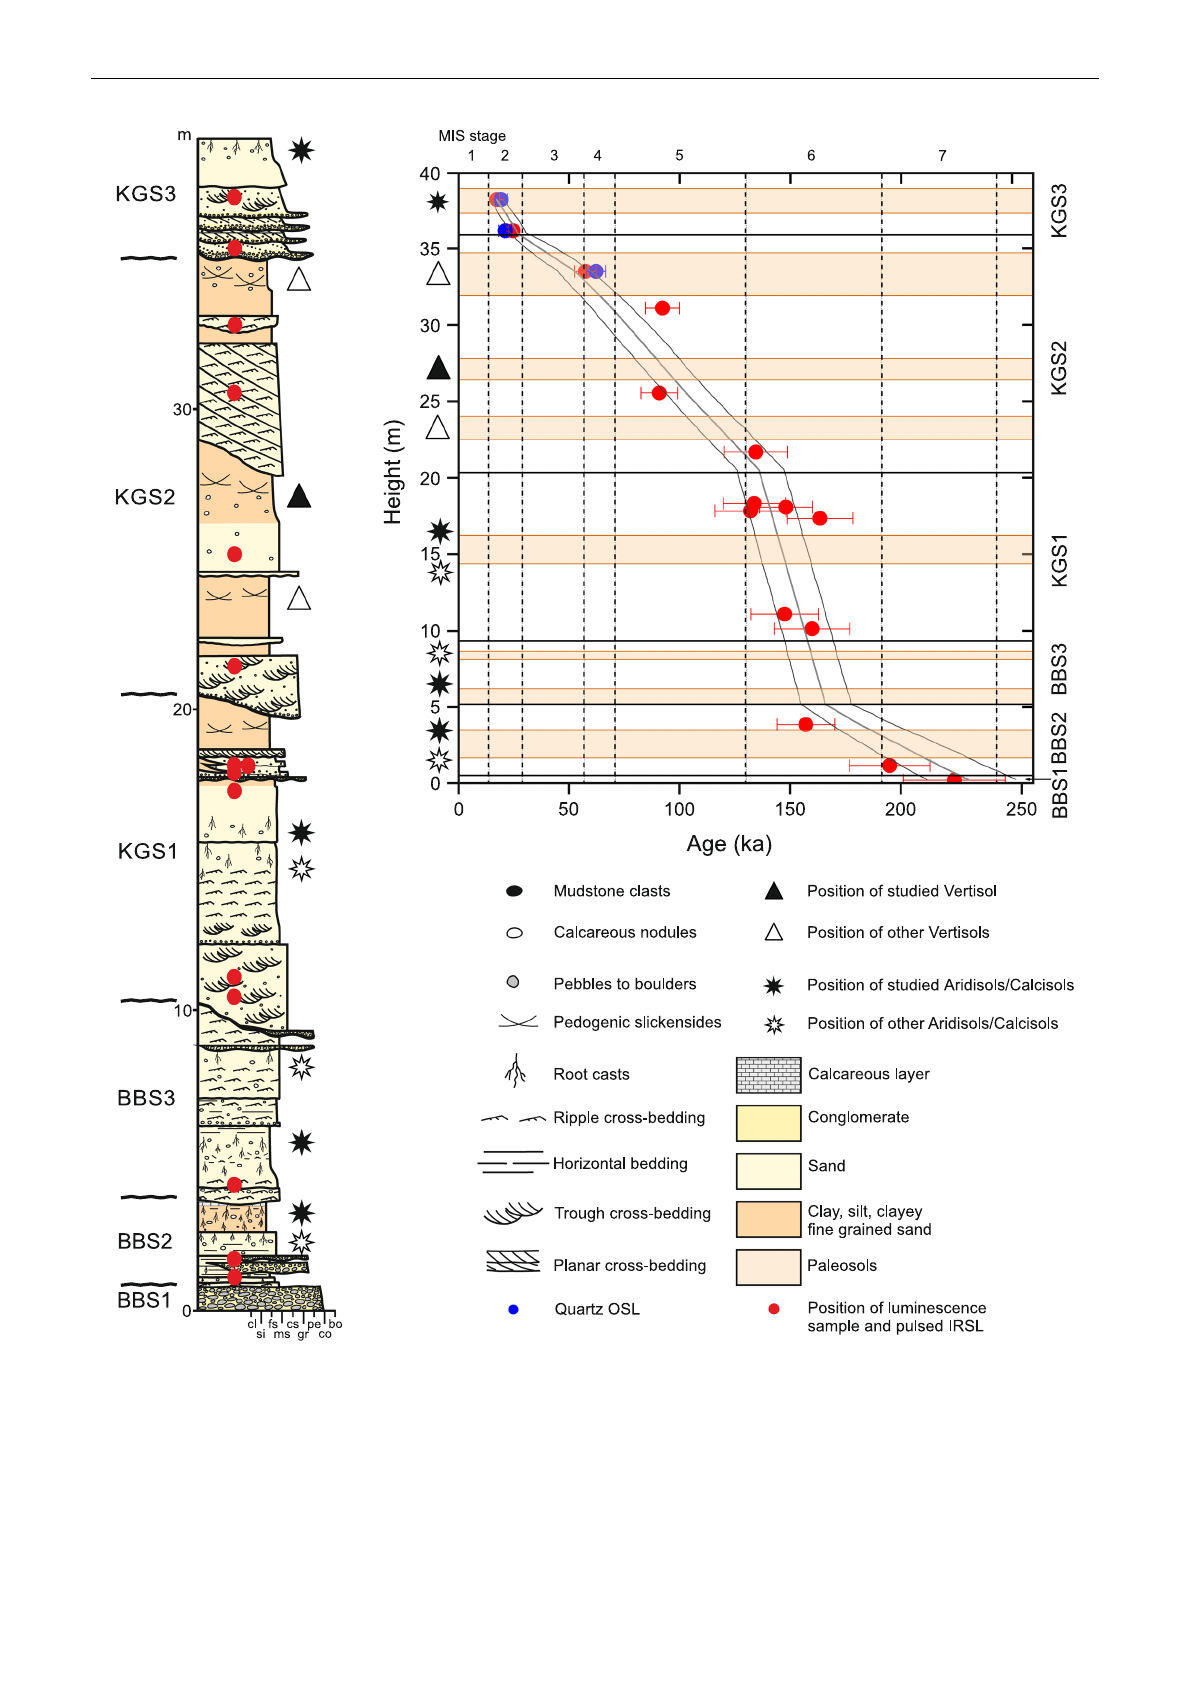
(KGS), separated by a major unconformity. Each of these units
was further divided into three intervals (BBS1–3) or sub-
synthems (KGS1–3) separated by minor unconformities
(Fig. 2a). The BBS1 interval consists of amalgamated gravel
channel deposits, BBS2 mainly of pedogenized silt with
manganese (Mn) and calcrete nodules, and BBS3 of fluvial
sand and pedogenized sandy silt. KGS1 is gravelly, but
predominantly comprises sandy channel fills and floodplain
deposits. KGS2 is very coarse basally, with pebbly sand
overlain by trough cross‐bedded coarse sandy channel fills, the
upper parts of which are composed of ripple cross‐bedded
fine‐grained sand. These sandy channels are interbedded with
brownish fine sandy to silty floodplain paleosols characterized
by slickensides, calcretes, and Fe and Mn nodules. The lower
part of the KGS3 is composed of stacked channel fills of
conglomerate overlain by crudely cross‐bedded, poorly sorted
sand, while the upper part is made up of highly calcareous fine
sand to silty floodplain paleosols.
The sandy bodies in the lower part of the KGS2 and KGS3
are covered by river oyster (Etheria) patch reefs with
stromatolitic coatings. U–Th dating of two Etheria shells by
Abbate et al. (2010) gave ages of 126.1 ±1.0 and 92.2 ±0.7 ka
for the bases of the KGS2 and KGS3, respectively, while
mammalian biochronology in combination with magnetostra-
tigraphy indicated a late Early to early Middle Pleistocene age
for the BBS1 interval (i.e. around or after 800 ka), with the
BBS2–3 spanning most of the Middle Pleistocene, and a
temporal gap of around 100 ka between the BBS and KGS
(Abbate et al., 2010). However, a recent study including
luminescence, radiocarbon and
230
Th/U dating revealed ages
of ~220–160, ~160–130, ~130–30, and ~30 to <17 ka for the
BBS, KGS1, KGS2 and KGS3, respectively (Fig. 2b; Tsukamoto
et al., 2022), which indicates relatively continuous deposition
with no major temporal gaps, and no sediments older than the
late Middle Pleistocene in the BBS–KGS sequence.
Materials and methods
Field methods
Paleosols intercalated with Pleistocene alluvial sediments
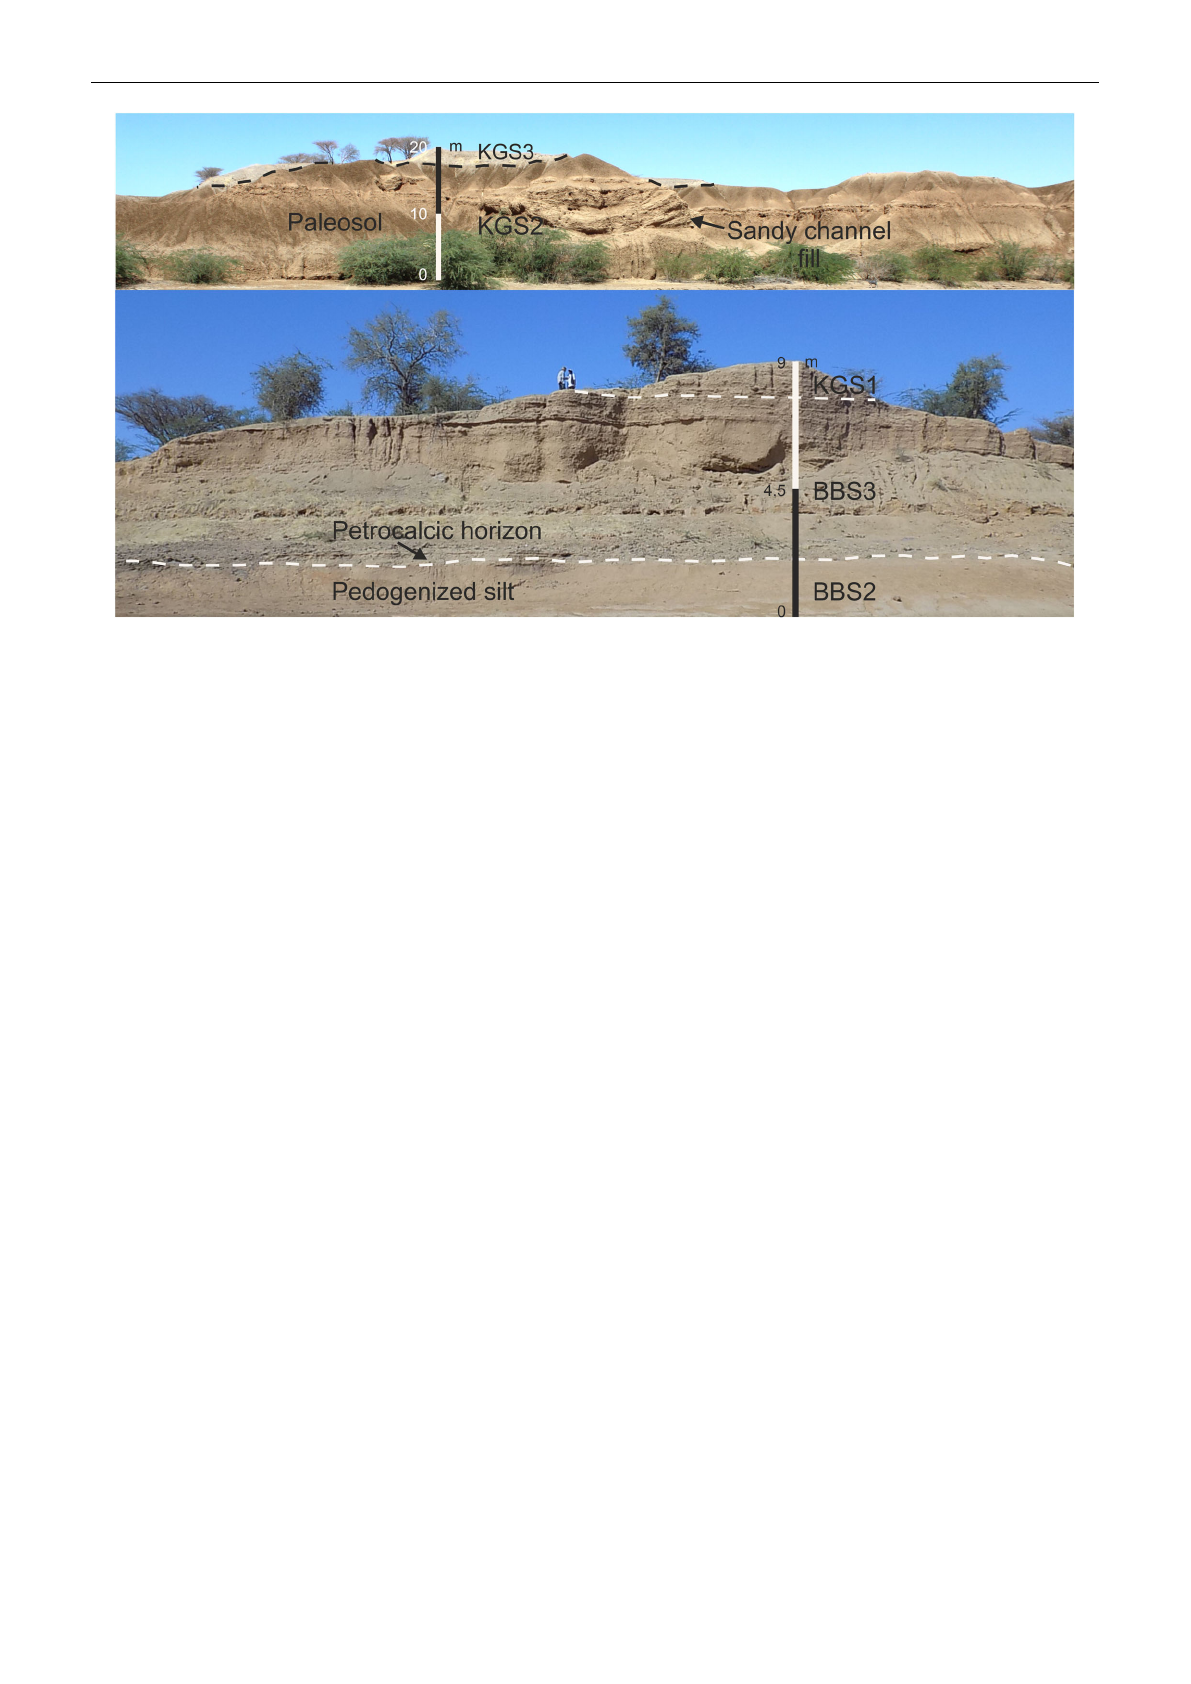
(Figs. 2a and 3) along the middle Atbara River were studied
and sampled in the vicinity of Butana Bridge near the village of
Al Sharafa (15°03′00″N, 35°55′59″E; Fig. 1b). From each
sedimentary unit –except the BBS1 interval which lacked
paleosols –all paleosols were noted in the field, and the
paleosol profiles which contained the most developed
pedogenic features were selected for study and sampling.
Detailed paleosol sections were measured after digging
trenches to access sediments unaffected by modern weath-
ering. Paleosols were described following Tabor et al. (2017).
Within each studied paleosol, fresh samples were collected at
regular intervals (every 10 cm) for mineralogical, geochemical
and grain size analyses, which were carried out at the
Department of Applied Geochemistry, Technische Universität
(TU) Berlin. Paleosol color was described using the Munsell
Capsure Color Matching Tool RM200SOIL. Rhizoliths were
classified following Klappa (1980) as root casts and root
petrifications. The former are tubular voids left by decayed
roots and then filled by sediment or cement or both, while the
latter are impregnations or replacements of organic matter by
minerals without total loss of root tissues. The abundance of
calcareous rhizoliths was estimated by counting their number
©2023 The Authors Journal of Quaternary Science Published by John Wiley & Sons, Ltd. J. Quaternary Sci., Vol. 39(1) 102–118 (2024)
AB
Figure 1. Maps of (A) the location and (B) the geology of the study area (modified from Tsukamoto et al., 2022) and the sampling position of the
potential parent rocks. [Color figure can be viewed at wileyonlinelibrary.com]
PLEISTOCENE PALEOSOLS OF EASTERN SUDAN 103
in areas 10 cm thick and 100 cm wide, and averaged for each
paleosol horizon. The presence of more than 10 rhizoliths in
such an area was classified as many, between five and 10 as
common, and fewer than five as few. For describing the
abundance of the calcareous nodules, we followed the US Soil
Survey (Soil Survey Staff, 2017); nodules were classified as
many when they formed more than 20% of the exposed
surface, common if they formed 2–20%, and few when they
©2023 The Authors Journal of Quaternary Science Published by John Wiley & Sons, Ltd. J. Quaternary Sci., Vol. 39(1) 102–118 (2024)
AB
Figure 2. The BBS (Butana Bridge Synthem) and KGS (Khashm El Girba Synthem) Pleistocene alluvial sediments near the village of Al Sharafa. (A)
Stratigraphic log showing the sampling position of the studied paleosols (see Fig. 5), luminescence dating ages and the position of other paleosols. (B)
Luminescence age model (mean modeled ages with 95% confidence interval), and corresponding marine isotope stages (MIS) showing the formation
time of the studied and other paleosols (modified from Tsukamoto et al., 2022). Abbreviations: cl =clay; si =silt; fs =fine sand; ms =medium sand;
cs =coarse sand; gr =granule; pe =pebble; co =cobble; bo =boulder. [Color figure can be viewed at wileyonlinelibrary.com]
104 JOURNAL OF QUATERNARY SCIENCE
were <2%. Blocks of oriented samples were carefully
extracted from BBS2 paleosol with a trowel and hammer,
and were then wrapped with appropriate protection. In
addition to these oriented samples, calcrete samples (nodules,
crusts and rhizoliths), which were collected from the Butana
Bridge area and other locations in the study area, were
micromorphologically analyzed. To determine the source
rocks of the sediments, samples were collected from three
outcrops south of the studied sections (Fig. 1b): a Precambrian
gneiss from near Khashm El Girba, and two Cenozoic basalts
exposed in the Wadi Turk and Al Showak areas.
For paleosol classification, we used the taxonomy of the Soil
Conservation Service of the USA (Soil Survey Staff, 2022), the
World Reference Base for Soil Resources (WRB, 2022) and the
paleosol classification of Mack et al. (1993). The US soil
taxonomy system classifies soils based on their diagnostic
horizons and features and the WRB classification is based on
diagnostic horizons, properties and materials, which should be
measurable and observable in the field and which are often
similar to the diagnostic horizons and characteristics of the US
system (Blume et al., 2016). Mack et al. (1993) based their
classification on pedogenic features that have the highest
preservation potential. They classified paleosols into nine orders,
four of which (Histosol, Spodosol, Oxisol and Vertisol) were
borrowed from the US classification, with other orders excluded.
Retallack (2019) suggested that modern soil classifications should
be used because they are helpful in understanding paleosols.
For describing the paleosol horizons, we used the soil
nomenclature of the US Department of Agriculture (Soil Survey
Staff, 2022). From top to bottom a typical soil profile consists of O,
A, B and C master horizons. O is the zone where organic matter
has accumulated; A is the leaching zone, which is characterized
by the accumulation of humified organic matter mixed with the
mineral fraction; B is the zone of accumulation, which shows
enrichment in clay, carbonate and sesquioxides; and C comprises
unweathered parent material. The master horizon is described in
detail to identify specific physical or chemical characteristics.
These are denoted by lowercase suffixes: k indicates accumulation
of carbonates, o of sesquioxides, t of clay (argillic) and ss the
presence of pedogenic slickensides.
Laboratory methods
Optical microscopy
The micromorphology of soils is extremely valuable in the
characterization of pedogenic processes and climatic condi-
tions during soil formation (Stoops, 2018). Twelve thin sections
of calcretes and oriented paleosol samples were prepared for
micromorphological analyses. Pedogenic features were iden-
tified according to the guidelines of Wright and Tucker (1991).
Calcrete is an accumulation of calcium carbonate near to the
surface, where the vadose and shallow phreatic groundwaters
become saturated in calcium carbonate, which occurs in soil
profiles, bedrock and sediments in various forms from
powdery to indurated (Wright & Tucker, 1991). Gile et al.
(1966) and Machette (1985) classified pedogenic calcrete
based on its development stages in the soil profile. It starts with
few filaments in the soil (stage I) to scattered nodules (stage II),
then develops over time to dense nodules in a firm to
moderately cemented matrix (stage III). In the more developed
stages (stage IV), thin (<0.2 cm) to moderately thick (1 cm)
laminae form in the upper part of the K horizon (calcium
carbonate‐rich massive layer; Soil Survey Staff, 2022). Over
time, the thickness of laminae exceeds 1 cm (stage V), and in
the late stages of development, multiple generations of
cemented laminae, breccia and pisolites are formed (stage VI).
Carbonate content and grain‐size analysis
The carbonate content was determined using the ‘Karbonat‐
Bombe’method according to Müller and Gastner (1971).
Prior to grain‐size analysis, the authigenic carbonates (cal-
cretes) in the samples were dissolved by using 20% HCl; samples
were not treated for the organic materials, because the paleosols
are poor in organic materials. The grain‐size distribution (sand,
©2023 The Authors Journal of Quaternary Science Published by John Wiley & Sons, Ltd. J. Quaternary Sci., Vol. 39(1) 102–118 (2024)
Figure 3. The BBS (Butana Bridge Synthem) and KGS (Khashm El Girba Synthem) Pleistocene alluvial sediments with the intercalated BBS2 and
KGS2 paleosols exposed along the Middle Atbara River near Butana Bridge (bottom: 15°04′39.3″N, 035°57′29.2″E) and village of Al Sharafa (top:
15°04′57.1″N, 035°56′56.4″E). [Color figure can be viewed at wileyonlinelibrary.com]
PLEISTOCENE PALEOSOLS OF EASTERN SUDAN 105

silt, clay) was determined by sieving the samples with a 63‐µm
sieve and subsequent centrifugation and sedimentation analysis
of the silt fraction using an areometer.
Age–depth modeling
The ages of the paleosols were assumed using the quartz and
feldspar luminescence ages of Tsukamoto et al. (2022) (Fig. 2b).
An age–depth model was created for every 10 cm for the
whole 40‐m sediment sequence using the rbacon package
(Age‐Depth Modeling using Bayesian Statistics; Blaauw and
Christen, 2011) using R (R Core Team, 2022). This age
modeling divides a sediment sequence into equally sized
sections and assumes a linear accumulation within each
section. We divided the sequence into 20‐cm sections, and
added boundaries at depths of 4, 19.5 and 34.8 m (36, 20.5
and 5.2 m in the stratigraphic column in Fig. 2a), which are the
boundaries of KGS3/2, KGS2/1 and BBS3/2. However, no
boundary was set between KGS and BBS, where we see little
age difference. The code we used, plus the input and output
data can be found in the Supplementary Data 1–3. The age
range of each paleosol profile was calculated from the mean
modeled age of the upper and lower limits of the paleosols. For
the uppermost paleosol in KGS3, the upper limit age was
calculated by a linear extrapolation of the modeled curve. The
depositional ages of different units (BBS, KGS1, KGS2 and
KGS3) were also calculated using the modeled age.
X‐ray diffraction
The mineralogy of the paleosols depends strongly on the
weathering intensity, and thus on the local paleoclimate. The
most useful indicators here are pedogenic minerals such as
carbonates, evaporites and clay minerals (Beverly et al., 2018).
The bulk mineralogy of 55 paleosol samples was identified
using X‐ray diffraction (XRD) analysis. The samples were first
pulverized in an XRD‐milled McCrone mill for 15 min together
with 10 mL of 95% ethanol. The milled, randomly oriented
samples were then measured in a Bruker D2 diffractometer
from 3°to 80°2θwith a 0.02°step width and 0.5‐s
measurement time per step using Cu‐Kαradiation. The
minerals were determined from the position of the diffracted
peaks using the DIFFRAC.SUITE EVA (Bruker) software with
the PDF‐4 mineral database, in which the sample height is
corrected to the position of quartz (101) at 26.644°2θ.
The clay mineralogy of the paleosols was determined on 25
samples. Clay minerals are chemically reactive and thus
potentially of high paleoenvironmental and local paleoclimatic
significance (e.g. Singer, 1984; Chamley, 1989; Birkeland, 1989).
The clay fraction (<2 µm) was separated from aliquots using
centrifugation. X‐ray diffractograms of smear slides were then
obtained in three runs using a Bruker D2 Phaser and Cu‐Kα
radiation between 3°and 30°2θwith 0.01°step width and 0.5‐s
measurement time per step, first after air drying, second after
ethylene‐glycol solvation in vapor mode and finally after heating at
550 °C for 2 h (Moore and Reynolds, 1997).
For calculating the bulk mineralogy, semi‐quantitative analysis
was conducted based on the pattern's relative height of identified
peaks and the values of intensity Analyte to intensity Corundum
(I/I
cor
) which are available from the PDF‐4 mineral database.
X‐ray fluorescence
Data of the major and minor element composition of the paleosol
and the basement rock samples were analyzed with a Bruker AXS
S8 TIGER X‐ray fluorescence (XRF) device. Pulverized samples
were first heated at 105 °C for 24 h to remove volatiles such as
water, and then samples were heated at 1000 °Cfor3hto
determine the loss on ignition. Then, 0.5 g of the ignited samples
were mixed with 8.5 g of lithium tetraborate as a fusion agent and
then fused at 1200 °C with a Fluxana XRF application solution;
the fused discs were then measured using XRF. Calibration was
performed using 32 standard samples and five validation
standards. The summed masses range between 100.2 and
99.4% with an average of 99.9%. The obtained major and
minor element compositions were molecular weight normalized
to calculate weathering indices and molecular ratios.
The geochemistry of paleosols can provide information on
weathering intensity. Various weathering indices (CIA, CIA‐K, WIP
and CALMAG) were calculated from geochemical analyses
(Table 1). The chemical index of alteration (CIA) of Nesbitt and
Young (1982) is a measure of the weathering of feldspars and their
degradation to clay minerals. Maynard (1992) proposed to
calculate the CIA without potash (CIA‐K) to account for the
influence of potassium metasomatism in paleosols. The weathering
index of Parker (WIP) is another index used to estimate the
weathering potential for silicate rocks where hydrolysis is the main
agent of weathering (Parker, 1970). The calcium–magnesium
weathering index (CALMAG) of Nordt and Driese (2010) is similar
to CIA but uses Mg instead of Na and K in mol% to evaluate
weathering intensity specifically in Vertisols. CIA, CIA‐KandWIP
were used to determine the weathering intensity that the studied
paleosols underwent.
Paleoprecipitation (MAP =mean annual precipitation) was
calculated for non‐calcareous (<5% CaCO
3
) paleosol samples.
CALMAG was used to calculate the paleoprecipitation for
Vertisols only, while CIA‐K was used for all paleosol types.
Molecular ratios such as base loss, clayeyness, leaching and
salinization can provide additional information on pedogenic
processes (Sheldon et al., 2002; Retallack, 2019). Useful
proxies for assessing the extent of hydrolysis in paleosols are
the sum of the bases (Na +Mg +K+Ca) divided by Al
(Σbases/Al) and Al/Si ‘clayeyness’, as Al accumulates in clay
minerals relative to the silicate parent material (Sheldon
et al., 2002; Retallack, 2019). Soil salinity can be assessed
based on the (Na +K/Al) ratio (Sheldon et al., 2002) and
leaching by determining base loss ratios, where the abundance
of a given base is related to the abundance of Ti (base/Ti)
(Sheldon et al., 2002). Based on the geochemical proxies or
molecular ratios, several climofunctions have been proposed
to calculate paleoprecipitation (MAP) (Table 2).
Results
Field and petrographic investigations
The BBS and KGS units in the study area contain paleosols
(Figs. 2a and 3) which are easily identified in the outcrops by
©2023 The Authors Journal of Quaternary Science Published by John Wiley & Sons, Ltd. J. Quaternary Sci., Vol. 39(1) 102–118 (2024)
Table 1. Equations and reference sources of the weathering indices.
Weathering index Equation Reference
CIA Al/(Al +Ca +Na +K)
×100
Nesbitt and
Young, 1982
CIA‐K Al/(Al +Ca +Na) ×100 Maynard, 1992
WIP (Na/0.35 +Mg/0.9 +K/
0.25 +Ca/0.7) ×100
Parker, 1970
CALMAG Al/(Al +Ca +Mg) ×100 Nordt and
Driese, 2010
CIA, chemical index of alteration; CIA‐K, chemical index of alteration
minus potassium; WIP, weathering index of Parker; CALMAG,
calcium–magnesium weathering index.
106 JOURNAL OF QUATERNARY SCIENCE
Loading more pages...