
Fatma Cansu Yücel, Fabian Habicht, Myles D. Bohon, Christian
Oliver Paschereit
Autoignition in stratified mixtures for pressure gain
combustion
Open Access via institutional repository of Technische Universität Berlin
Document type
Journal article | Accepted version
(i. e. final author-created version that incorporates referee comments and is the version accepted for
publication; also known as: Author’s Accepted Manuscript (AAM), Final Draft, Postprint)
This version is available at
https://doi.org/10.14279/depositonce-15713
Citation details
Yücel, F. C., Habicht, F., Bohon, M. D., & Paschereit, C. O. (2021). Autoignition in stratified mixtures for
pressure gain combustion. In Proceedings of the Combustion Institute (Vol. 38, Issue 3, pp. 3815–3823).
Elsevier BV. https://doi.org/10.1016/j.proci.2020.07.108.
Terms of use
This work is protected by copyright and/or related rights. You are free to use this work in any way permitted by
the copyright and related rights legislation that applies to your usage. For other uses, you must obtain
permission from the rights-holder(s).

Autoignition in Stratified Mixtures for Pressure Gain Combustion
Fatma Cansu Y¨
ucela,∗, Fabian Habichta, Myles Bohona, Christian Oliver Paschereita
aTechnical University of Berlin, Institute of Fluid Dynamics and Technical Acoustics, M¨uller-Breslau-Strasse 8, Berlin and 10623, Germany
Abstract
The reliable generation of quasi-homogeneous autoignition inside a combustor fed by a continuous air flow would
represent a milestone in realizing pressure gain combustion in gas turbines. In this work, the ignition distribution in-
side a stratified fuel–air mixture is analyzed. The ability of precise and reproducible injection of a desired fuel profile
inside a convecting air flow is verified by applying tunable diode laser absorption spectroscopy in non-reacting mea-
surements. High-speed, static pressure sensors and ionization probes allow for simultaneous detection of the flame and
pressure rise at several axial positions in reactive measurements with dimethyl ether as fuel. A second, exchangeable
combustion tube enables optical observation of OH∗intensity in combination with pressure measurements. Experi-
ments with three arbitrary fuel profiles show a set of ignition distributions that vary in shape, homogeneity, and the
number of simultaneous autoignition events. Although the measurements show notable variation, a significant and
reproducible influence of the fuel injection on the ignition distribution is observed. Results show that uniform au-
toignition leads to a coupling of the reaction front with the pressure rise and, therefore, induces a greater aerodynamic
constraint than non-uniform ignition distributions, which are dominated by propagating deflagration fronts.
Keywords:
homogeneous autoignition, fuel stratification, pressure gain combustion, shockless explosion combustor
∗Corresponding author:
(Fatma Cansu Y¨
ucel)
Preprint submitted to Proceedings of the Combustion Institute May 16, 2022

1. Introduction
Replacing the conventional isobaric combustion of the
gas turbine cycle by pressure gain combustion is a
promising concept to achieve improvements in cycle ef-
ficiency. Different approaches have been investigated,
such as pulse detonation combustion (PDC) [1] and ro-
tation detonation combustion (RDC) [2]. Both concepts
utilize propagating detonation wave(s), the high tem-
peratures and pressures of which present significant en-
gineering challenges. An alternative approach, called
shockless explosion combustion (SEC) [3], overcomes
these challenges by using quasi-homogeneous autoigni-
tion to achieve approximately constant volume combus-
tion without the presence of a detonation wave or me-
chanical constraints.
Homogeneous autoignition occurring in well mixed
combustible mixtures was originally referred to as ther-
mal explosion by Zel’dovich [4] as a concept of sponta-
neous flames, leading to an increase in pressure sim-
ilar to constant volume combustion. However, non-
uniformities in the mixture, such as variations in tem-
perature, pressure or equivalence ratio, can cause devi-
ations in ignition delay time and result in a propagating
autoignition front instead. The propagation velocity of
this autoignition front uai is inversely proportional to the
spatial gradient of the ignition delay time τai. Assum-
ing constant temperature Tand pressure pacross the
mixture, the ignition delay time τai is a function of the
equivalence ratio ϕsuch that uai can be expressed as:
uai = ∂τai
∂x!−1
= ∂τai
∂ϕ
∂ϕ
∂x!−1
.(1)
Comparing uai to the speed of sound aleads to the di-
mensionless parameter ξ, where
ξ=a
uai
=a∂τai
∂ϕ
∂ϕ
∂x.(2)
This allows for the description of different combustion
modes [4, 5]. A subsonic propagation of the reaction
front occurs when ξ > 1. For ξ=1 the propagation
velocity of the autoignition front is equal to the speed
of sound, allowing amplification by coupling and en-
abling deflagration-to-detonation transition (DDT). The
ideal process of thermal explosion, which occurs for
ξ=0, is not practical in experiments due to unavoid-
able perturbations of the initial conditions and mixture
inhomogeneity, leading to gradients in reactivity. How-
ever, ξ < 1 results in a quasi-homogeneous autoignition
leading to an approximate constant volume combustion
while avoiding DDT. Similar behavior in pressure rise
quasi-homogeneous
refilling of the tube
burned gas
stratified fuel-air mixture
stratified fuel-air mixture
burned gas
air-buffer quasi-homogeneous autoignition
p>p0
τ=const.
expansion wave
pressure wave
autoignition
a)
b)
c)
d)
Figure 1: Sketch of the single tube SEC test rig
can be observed in the case of multiple separate igni-
tion sources that ignite quasi-simultaneously [6]. This
regime of quasi-homogeneous autoignition and/or many
distributed ignition points is the objective for the imple-
mentation of SEC.
Along these principles, the realization of homoge-
neous charge compression ignition (HCCI) has been in-
vestigated intensively in the past [7]. Preventing engine
knock is a major challenge in HCCI and has been ad-
dressed by applying different methods, such as modifi-
cation of oxidizer and fuel properties, equivalence ra-
tio, exhaust gas recirculation, or engine parameters [8].
However, the implementation of this concept in a gas
turbine cycle for pressure gain combustion is a new ap-
proach.
The SEC is based on a periodic combustion process
as sketched in Fig. 1. The cycle begins with a strati-
fied, autoignitable fuel–air mixture throughout the com-
bustor (Fig. 1a). This stratification has been tailored
to compensate for the gradient in residence time, re-
sulting in a quasi-homogeneous autoignition (Fig. 1b).
The pressure rise during combustion induces a pressure
wave propagating downstream which is reflected as an
expansion wave when reaching the acoustically open
combustor outlet (Fig. 1c). When this wave reaches the
combustor inlet, the refilling process begins (Fig. 1d)
and the cycle restarts.
The objective of this work is to investigate the igni-
tion processes within a stratified fuel–air mixture. First,
the ability of injecting a defined mixture profile in a con-
vecting air flow is analyzed. Subsequently, the homo-
geneity of measured autoignition times and pressure rise
as a function of the fuel stratification are examined. Fi-
nally, the processes of autoignition homogeneity, flame
propagation, and process variability are studied in high-
speed images of OH∗chemiluminescence.
2
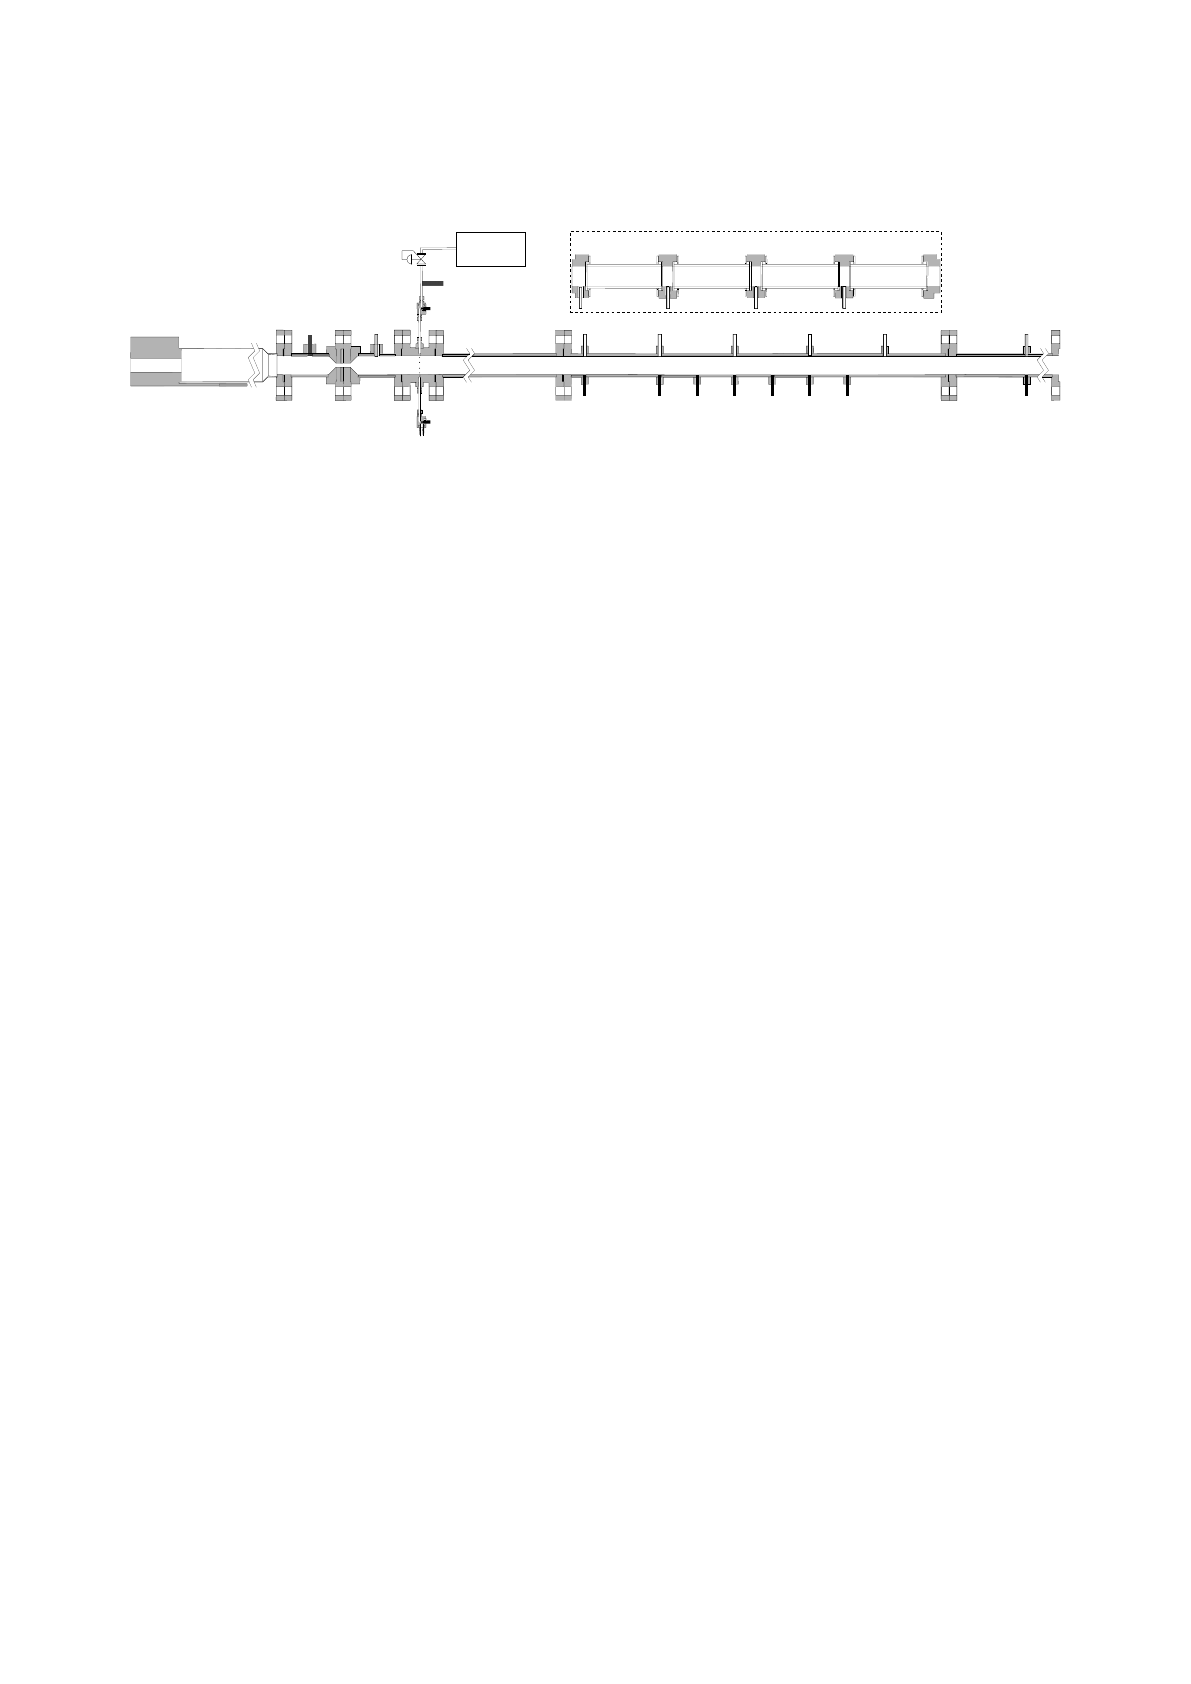
injection station
vaporizer
pressure regulator
FF
FAT1P1P2P3P4P5
I1I2I3I4I5I6I7
T2
I8
preheater restriction convection tube combustor exhaust tube
solenoid valve
optical access combustor
1 2 34
a)
b)
Figure 2: Sketch of the test rig. Sensors: low-speed, static pressure sensors (FA, FF), thermocouples (T1, T2), high-speed, static pressure sensors
(P1–P5), ionization probes (I1–I8). The inset subfigure b) shows the exchangeable version of the combustor tube with optical access.
2. Experimental Setup and Measurement Procedure
A sketch of the test rig for the experimental investiga-
tion of autoignition of an axially stratified fuel–air mix-
ture in a convecting flow is shown in Fig. 2. The test
rig is composed of several sections, including reactant
injection, convection (0.5 m), combustor (0.5 m), and
exhaust (1 m) sections. All sections have an inner di-
ameter of 40 mm. The rig was originally designed by
Bobusch et al. [3, 9] and later used by Reichel et al. [10].
However, in these works, reproducibility was limited
and consistent homogeneous autoignition was difficult
to achieve. The control of the injection process has since
been improved by Y¨
ucel et al. [11].
In the reacting cases, a preheater is used to raise the
temperature of the constant air flow to 1023 K measured
at T1. Downstream of the preheater, the air flow is
forced through a restriction in order to prevent back-
flow of hot gases into the preheater due to ignition.
Fuel is injected via ten radial ports with 1 mm diam-
eter each, which are individually controlled by high-
speed solenoid valves (Staiger VA 204-716). A dome-
loaded pressure regulator (Swagelok RD6) is installed
upstream of the injection station to control the fuel
supply pressure. Two static pressure sensors FAand
FF(Festo SPTW) are installed to monitor the air and
fuel supply pressures. The fuel injection duration is
∆tinj =50 ms, and is divided into ten time windows,
each with a length of 5 ms. The number of open valves
is individually set for each time window defining the in-
jected fuel profile.
The modular setup allows for exchanging the stain-
less steel combustor for a quartz tube (Fig. 2b) in order
to achieve optical access. This configuration is used for
fuel concentration measurements and OH* chemilumi-
nescence imaging of the ignition distribution.
2.1. Fuel Concentration Measurements
Fuel concentration measurements using near-infrared
tunable diode laser absorption spectroscopy (TDLAS)
are conducted as proposed by Li et al. [12]. These
measurements are used to validate the control of the
injection geometry to achieve a desired mixture pro-
file within a defined time frame. This technique has
been used previously for time-resolved fuel concentra-
tion measurements in a similar configuration [10, 13].
While the combustion experiments in this work are con-
ducted with dimethyl ether (DME) as fuel, the concen-
tration measurements are done with methane to match
the absorption features around a wavelength of 1654 nm
utilizing the available laser. In the scope of this work,
we expect the variation in the injected mixture fraction
profile to be primarily controlled by turbulent diffusion
and mixing. Since turbulent fluctuations scale with the
Reynolds number, it is considered as the dominant mix-
ing parameter rather than molecular diffusion (which
is of the same order for both fuels). However, when
comparing the Reynolds numbers for the non-reacting
(approx. 48000) to reacting (approx. 6000) cases, it is
expected that the non-reacting cases will exhibit much
greater turbulent diffusion and a blurring of the mixture
profile. Lastly, the residence time is kept constant for all
measurements by matching the flow velocities, allowing
an equal amount of time to diffuse. Considering this, it
is reasonable to conclude that for the reacting cases the
resulting gradients are steeper than TDLAS measure-
ments reveal. While this prevents quantifying the exact
local equivalence ratio for the reacting DME cases, it
does allow for a qualitative measure of the reproducibil-
ity and accuracy of the injection scheme.
2.2. Reactive Measurements
For reactive measurements, the initial temperature is
monitored via two Type-K thermocouples. Five water-
cooled, high-speed pressure sensors are installed in the
combustor with a distance of 100 mm to record the static
pressure variation. The flame is detected via 8 ioniza-
tion probes that are mounted in the combustor and the
exhaust tube. Figure 2 shows the naming convention for
3
each sensor.
The temperature at the injection station remains con-
stant during the measurements. At the beginning of each
measurement, a gradient in wall temperature of about
50 K between sensors T1and T2is observed. Heat-
ing during the run increases T2by approximately 50 K.
However, the measurement data show no correlation be-
tween the ignition time throughout the measurement re-
gion and the measured wall temperature. Therefore, it
is reasonable to assume the impact of the transient wall
temperature on the ignition process to be negligible.
DME is used as fuel resulting in ignition times in
the range of 60 ms to 80 ms for the applied conditions
(p=1 atm, T=1023 K and 1 ≤ϕ≤2). This assures
autoignition of the convecting mixture inside the com-
bustor. The fuel supply pressure is FF=5.7 bar and the
equivalence ratio is controllable from ϕ=0 (all valves
closed) to ϕ=2 (ten valves open). The average fuel
mass flow rate was measured under steady state con-
ditions using a Coriolis mass flow meter. To assure a
gaseous state, the fuel is vaporized and guided through
a heated pipe (330 K) before injection.
The ignition behavior of DME is characterized by a
negative temperature coefficient (NTC) region, which
is studied in more detail by Burke et al. under high
pressure conditions [14]. However, calculating the rel-
evant ignition delay times with Cantera [15] for a zero-
dimensional constant volume reactor using the mech-
anism AramchoMech2.0 that has been validated for
DME-kinetics in previous works, reveal that all tests
were conducted outside the NTC region of DME. Op-
erating in the NTC region of DME would require ac-
counting for additional non-linear behavior of DME au-
toignition, and is therefore avoided.
The optically accessible section is composed of a se-
ries of four quartz tubes, each 120 mm long, supported
by stainless steel flanges fitted with one pressure sen-
sor each. An optical band-pass filter (CWL =310 nm,
FWHM =10 nm), an intensifier (Lambert Instruments
HiCATT) and a high-speed camera (Photron Fastcam
SA-Z) are used to detect the reaction zones by light
emission of OH∗intensity. The recorded high-speed im-
ages allow for observation of the ignition distribution at
87500 fps and a spatial resolution of 2.7 px/mm.
3. Results and Discussion
The results will be broken into two sections. First, the
control of the fuel injection profile will be investigated,
and three example contours will be discussed. The sec-
ond section will then examine the autoignition charac-
teristics of these profiles, focusing on the pressure rise
(as representing aerodynamic confinement) and corre-
0 20 40 60
tin ms
0
2
4
6
8
10
number of open valves
a) valve commands
0 20 40 60 80
tin ms
0.02
0.04
0.06
0.08
0.1
0.12
0.14
0.16
0.18
XCH4
b) measured injection curves
V-curve
Λ-curve
u-curve
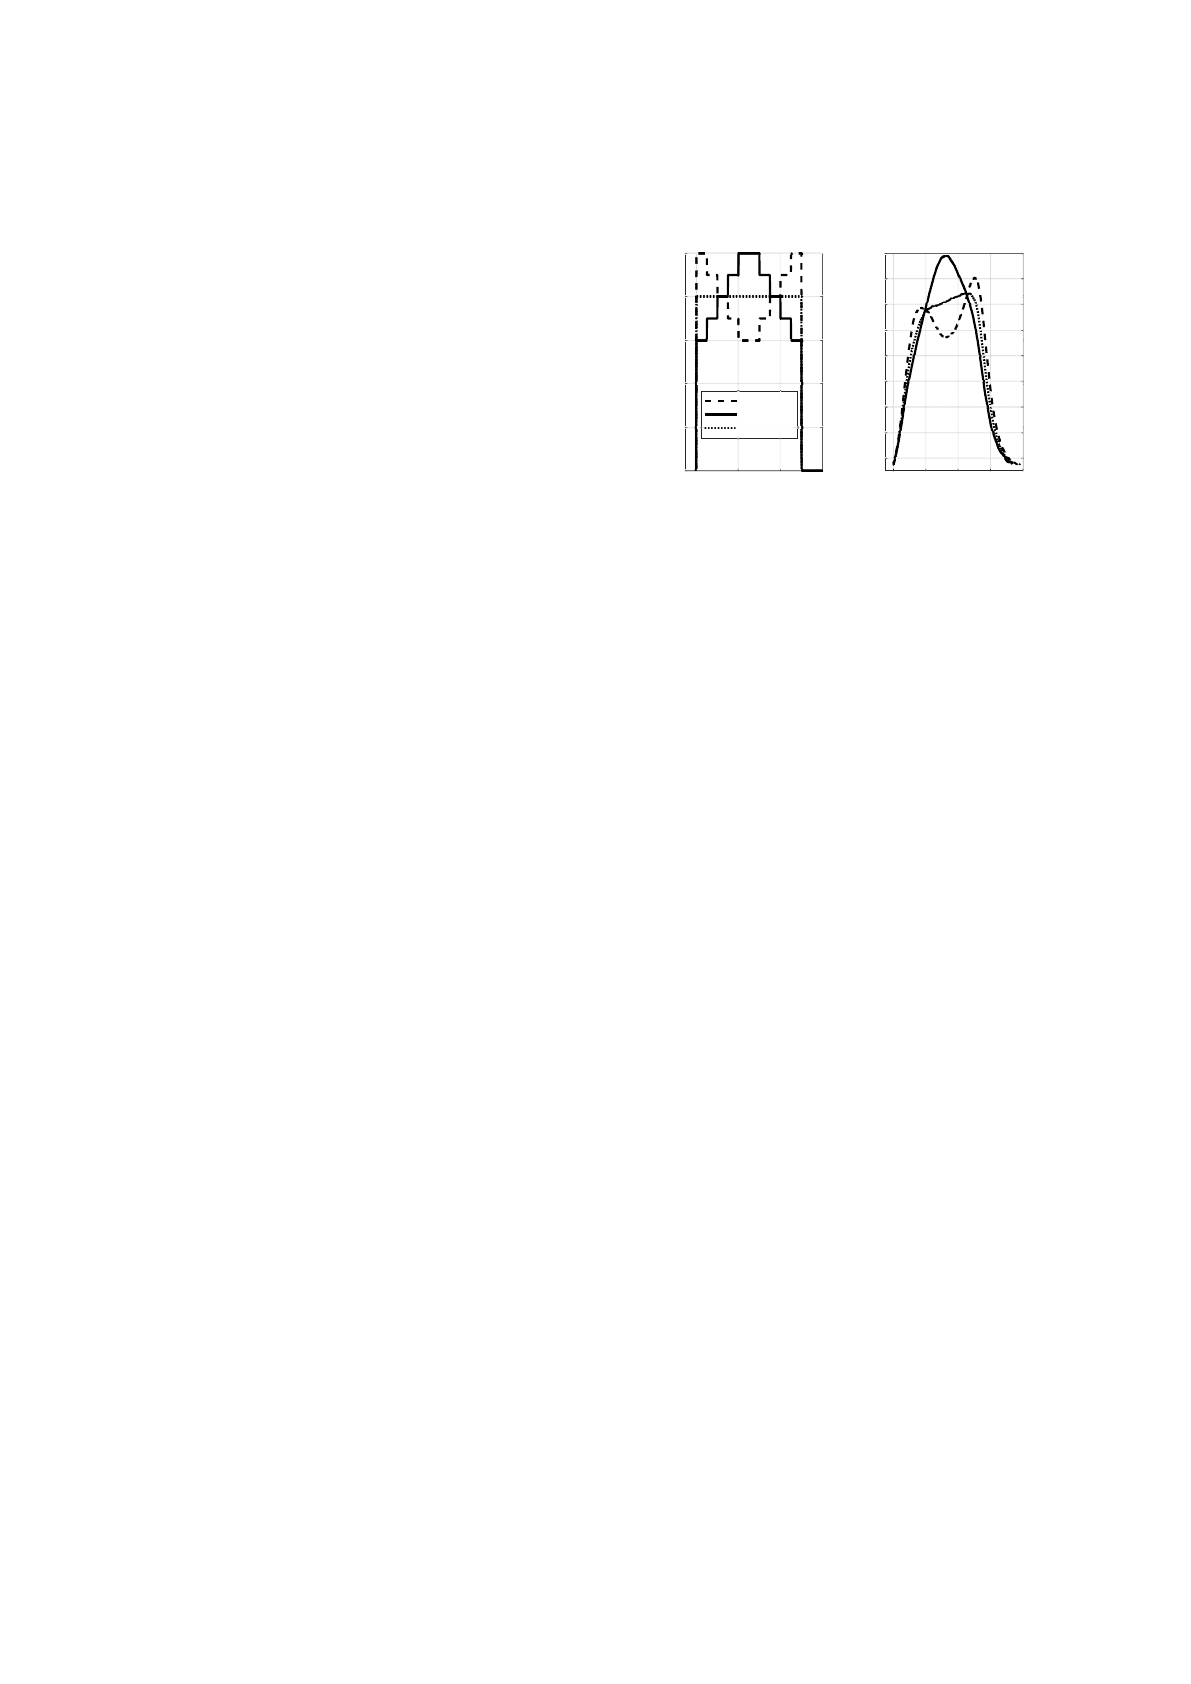
Figure 3: Injection curve commands for V-, Λ- and u-curve (a) and
measured methane concentration 50 mm downstream of the combus-
tor inlet averaged over 150 cycles (b).
late the variation in pressure rise with direct observa-
tions of the homogeneity of autoignition.
3.1. Fuel Injection
The mass flow rates of fuel and air are set to match
the mixture bulk flow velocity for reacting experiments
(ubulk =18 m/s). Each control sequence is injected for
150 cycles with an operating frequency of 5 Hz. Three
different injection profiles are investigated at ambient
pressure and temperature: (i) Λ-curve, (ii) V-curve and
(iii) u-curve. The control sequences and the respec-
tive TDLAS measured, cycle averaged fuel concentra-
tion for the three trajectories are shown in Fig. 3.
The averaged results clearly show the capability of
replicating a desired fuel profile within the given time
span ∆tinj. The measured fuel profiles of individual cy-
cles show a standard deviation (std) of less than 5 %
throughout the injection. There is a clear smoothing ef-
fect, especially in the regions of high gradient. This is
expected and can be attributed to two effects: (i) turbu-
lent diffusion and (ii) shear layer effects. Diffusion will
smooth the sharp features of the injection profile (begin-
ning and end of injection period). The shear layer effect
near the wall causes a variation in the velocity profile
through the tube and induces a spatial distortion of the
injection profile. This phenomenon can only be mea-
sured as an integrated value across the tube through the
line-of-sight measurement. It is also important to men-
tion that due to inertia of the valves, there is a hysteresis
to the valve response when opening and closing, the ef-
fects of which are difficult to account. Currently, there
is no way to avoid these effects, and must instead be
accounted for when interpreting the reacting results.
For reacting tests, it is important to maintain a con-
stant cycle-averaged fuel flow rate, otherwise differ-
ences in pressure rise might occur due to variations in
total heat release. For this, the total valve-open time
4
Loading more pages...