
sensors
Article
Hyperspectral Imaging Tera Hertz System for Soil
Analysis: Initial Results
Volker Dworak 1,*, Benjamin Mahns 1, Jörn Selbeck 1, Robin Gebbers 1and
Cornelia Weltzien 1,2
1Department Engineering for Crop Production, Leibniz-Institute for Agricultural Engineering and
2Faculty V of Mechanical Engineering and Transport Systems, Chair of Agromechatronics,
Technische Universität Berlin, Strasse des 17. Juni 136, 10623 Berlin, Germany
*Correspondence: [email protected]; Tel.: +49-331-5699-420; Fax: +49-331-5699-849
Received: 7 August 2020; Accepted: 30 September 2020; Published: 3 October 2020
Abstract:
Analyzing soils using conventional methods is often time consuming and costly due to
their complexity. These methods require soil sampling (e.g., by augering), pretreatment of samples
(e.g., sieving, extraction), and wet chemical analysis in the laboratory. Researchers are seeking
alternative sensor-based methods that can provide immediate results with little or no excavation and
pretreatment of samples. Currently, visible and infrared spectroscopy, electrical resistivity, gamma ray
spectroscopy, and X-ray spectroscopy have been investigated extensively for their potential utility in
soil sensing. Little research has been conducted on the application of THz (Tera Hertz) spectroscopy
in soil science. The Tera Hertz band covers the frequency range between 100 GHz and 10 THz of
the electromagnetic spectrum. One important feature of THz radiation is its correspondence with
the particle size of the fine fraction of soil minerals (clay <2
µ
m to sand <2 mm). The particle size
distribution is a fundamental soil property that governs soil water and nutrient content, among other
characteristics. The interaction of THz radiation with soil particles creates detectable Mie scattering,
which is the elastic scattering of electromagnetic waves by particles whose diameter corresponds
approximately to the wavelength of the radiation. However, single-spot Mie scattering spectra are
difficult to analyze and the understanding of interaction between THz radiation and soil material
requires basic research. To improve the interpretation of THz spectra, a hyperspectral imaging
system was developed. The addition of the spatial dimension to THz spectra helps to detect relevant
features. Additionally, multiple samples can be scanned in parallel and measured under identical
conditions, and the high number of data points within an image can improve the statistical accuracy.
Technical details of the newly designed hyperspectral imaging THz system working from 250 to
370 GHz are provided. Results from measurements of different soil samples and buried objects
in soil demonstrated its performance. The system achieved an optical resolution of about 2 mm.
The sensitivity of signal damping to the changes in particle size of 100
µ
m is about 10 dB. Therefore,
particle size variations in the
µ
m range should be detectable. In conclusion, automated hyperspectral
imaging reduced experimental effort and time consumption, and provided reliable results because
of the measurement of hundreds of sample positions in one run. At this stage, the proposed setup
cannot replace the current standard laboratory methods, but the present study represents the initial
step to develop a new automated method for soil analysis and imaging.
Keywords: hyperspectral imaging; Mie scattering; soil imaging; soil sensing
Sensors 2020,20, 5660; doi:10.3390/s20195660 www.mdpi.com/journal/sensors

Sensors 2020,20, 5660 2 of 22
1. Introduction
Soil is a fundamental resource in the earth’s ecosystems and for human life. The understanding
of the soil’s status and function is highly relevant because soils contribute to the recycling, filtering,
transformation, and buffering of substances, in addition to the production of food, forage, and biogenic
raw materials. In particular, for sustainable agriculture soils must be analyzed regularly to assess
their fertility. However, soil analysis with conventional sampling and laboratory-based methods
is expensive and time consuming. Thus, scientists are searching for new, sensor-based methods
that can analyze soils more efficiently. The development of soil sensors is a challenging task due to
the complexity of the soil and its many interfering parameters. This is also true for proximal soil
sensing [
1
,
2
]. To date, visible and infrared spectroscopy, electrical resistivity, gamma ray spectroscopy,
and X-ray spectroscopy have been investigated extensively [
2
]. One versatile candidate sensor for
performing nondestructive soil measurements is Tera Hertz (THz) spectroscopy, which covers the
electromagnetic frequency range between 100 GHz and 10 THz [
3
]. An important feature of THz
radiation is its correspondence with the particle size of the fine fraction of soil minerals (clay <2
µ
m
to sand <2 mm). The particle size distribution is a fundamental soil property which governs soil
water and nutrient content, among other characteristics. Another important feature of THz radiation
is its ability to penetrate materials. Furthermore, it is nondestructive and not hazardous. However,
little research has been conducted on the application of THz spectroscopy in soil science. Moreover,
the development of THz systems is ongoing. Some non-continuous wave systems are used and
the applications are in their infancy [
4
,
5
]. Even fewer studies have been performed on continuous
wave (CW) THz systems [
6
] and hyperspectral imaging [
7
] in soil samples. The first results using
THz radiation for soil analysis in the range of 258–375 GHz demonstrated a specific interaction with
soil particles [
8
]. In this frequency band, the particle size in the range of a millimeter causes Mie
scattering [
9
–
11
]. Mie scattering, named after the physicist Gustav Mie, is the elastic scattering of
electromagnetic waves by particles whose diameter corresponds approximately to the wavelength
of the radiation. In the case of multiparticle scattering, Mie scattering shows a complex spectral
behavior and varies depending on the local position of the beam. Hyperspectral imaging overcomes
the problem of the local variability within the sample and the problem of the interpretation of a single
measurement because it combines imagery and spectral behavior. Therefore, most hyperspectral
applications and research result from this combination [
12
–
23
]. The human eye can easily interpret the
image and identify different areas, interface regions, and buried objects. Therefore, THz imaging is
used for defect or artifact detection [
24
]. Additionally, critical samples can be simultaneously measured
under identical conditions, with fewer time effects caused by the long measuring time. Conversely,
the time effects can be compared in a simultaneous measurement, and exchanges between different
samples can be analyzed. The measurement of multiple data points helps to overcome individual
effects, and common areas can be interpreted statistically. In this way, new images can be created.
A disadvantage of this imaging method is the additional complexity of the focus plane. Sharp results
can be produced only for features in the focus plane. The high Mie scattering of sand particles prevents
beam formation in the material, and a focus plane does not exist under such conditions. This makes
generating imagery of soil samples difficult. In order to develop a THz measurement system for a
challenging task such as soil characterization, an experimental setup must be developed that allows
differentiating and isolating the many different influencing parameters, and at the same time enables an
imaging approach by precise localization of each measurement reading within the sample’s dimension.
Such an experimental setup will enable basic research on the potential of soil sample characterization
through hyperspectral analysis of THz radiation transmission/reflection patterns. This paper describes
the development of a THz hyperspectral imaging experimental system for soil sample characterization.
With this setup, the authors note the advantages of this method for testing complex samples such as
soil samples. This paper discusses the following research questions:
•Can the effect of scattering on image quality be demonstrated by hyperspectral imaging?
Sensors 2020,20, 5660 3 of 22
•Can the imaging localize artifacts or measurement errors?
•How can the imaging identify homogenous sample regions for statistical comparisons?
2. Materials and Methods
Hyperspectral imaging of difficult samples with terahertz radiation is a complex task because of
the influence of many physical parameters. It starts with the complicated behavior of the Rayleigh
and Mie scattering of thousands of particles. In previous studies, the CELES software [
25
] enabled
the simulation of such complex Mie scattering arrangements and can be used to visualize the results.
However, the simulation is not a part of the current work; rather, the measurement possibilities of the
presented setup will be demonstrated. The experimental setup described consists of the soil samples
and holders, the THz spectrometer, the sample positioning system, the operating software, and the
data analysis.
Additionally, natural soil is a complex sample material and soil functionality depends on multiple
parameters, including particle size distribution, mineral content, carbon content or organic matter,
water, biology, and physical and chemical properties. Therefore, all first measurements were made on
simplified soil samples to reduce the number of parameters. The results in this article focus on the
imaging possibility of hyperspectral THz measurement.
2.1. Soil Samples and Holders
The measurement is influenced by the sample holder, the preparation of the sample, the filling
of the sample holder, and the compaction (process) in the sample holder. Even the measurement of
the empty sample holder is not adequate for calibration because of the different interface situation
at the sample holder walls. The best filling substance for calibration is oil [
26
], but this discussion is
not part of this work. The sample holders demonstrated may not be the best solution but rather are
a good practical approach. All samples in this study were placed in sample holders made of HDPE
(high density polyethylene) with a wall thickness of 2 mm. The holders were parallel, box-shaped,
or wedge-shaped. The wedge-shaped sample holder enables simultaneous measurements of different
thickness. The sample thickness was addressed accordingly. In some cases, the sample holder was
separated into domains with different samples (Figures 1–4) to demonstrate the resulting contrast in
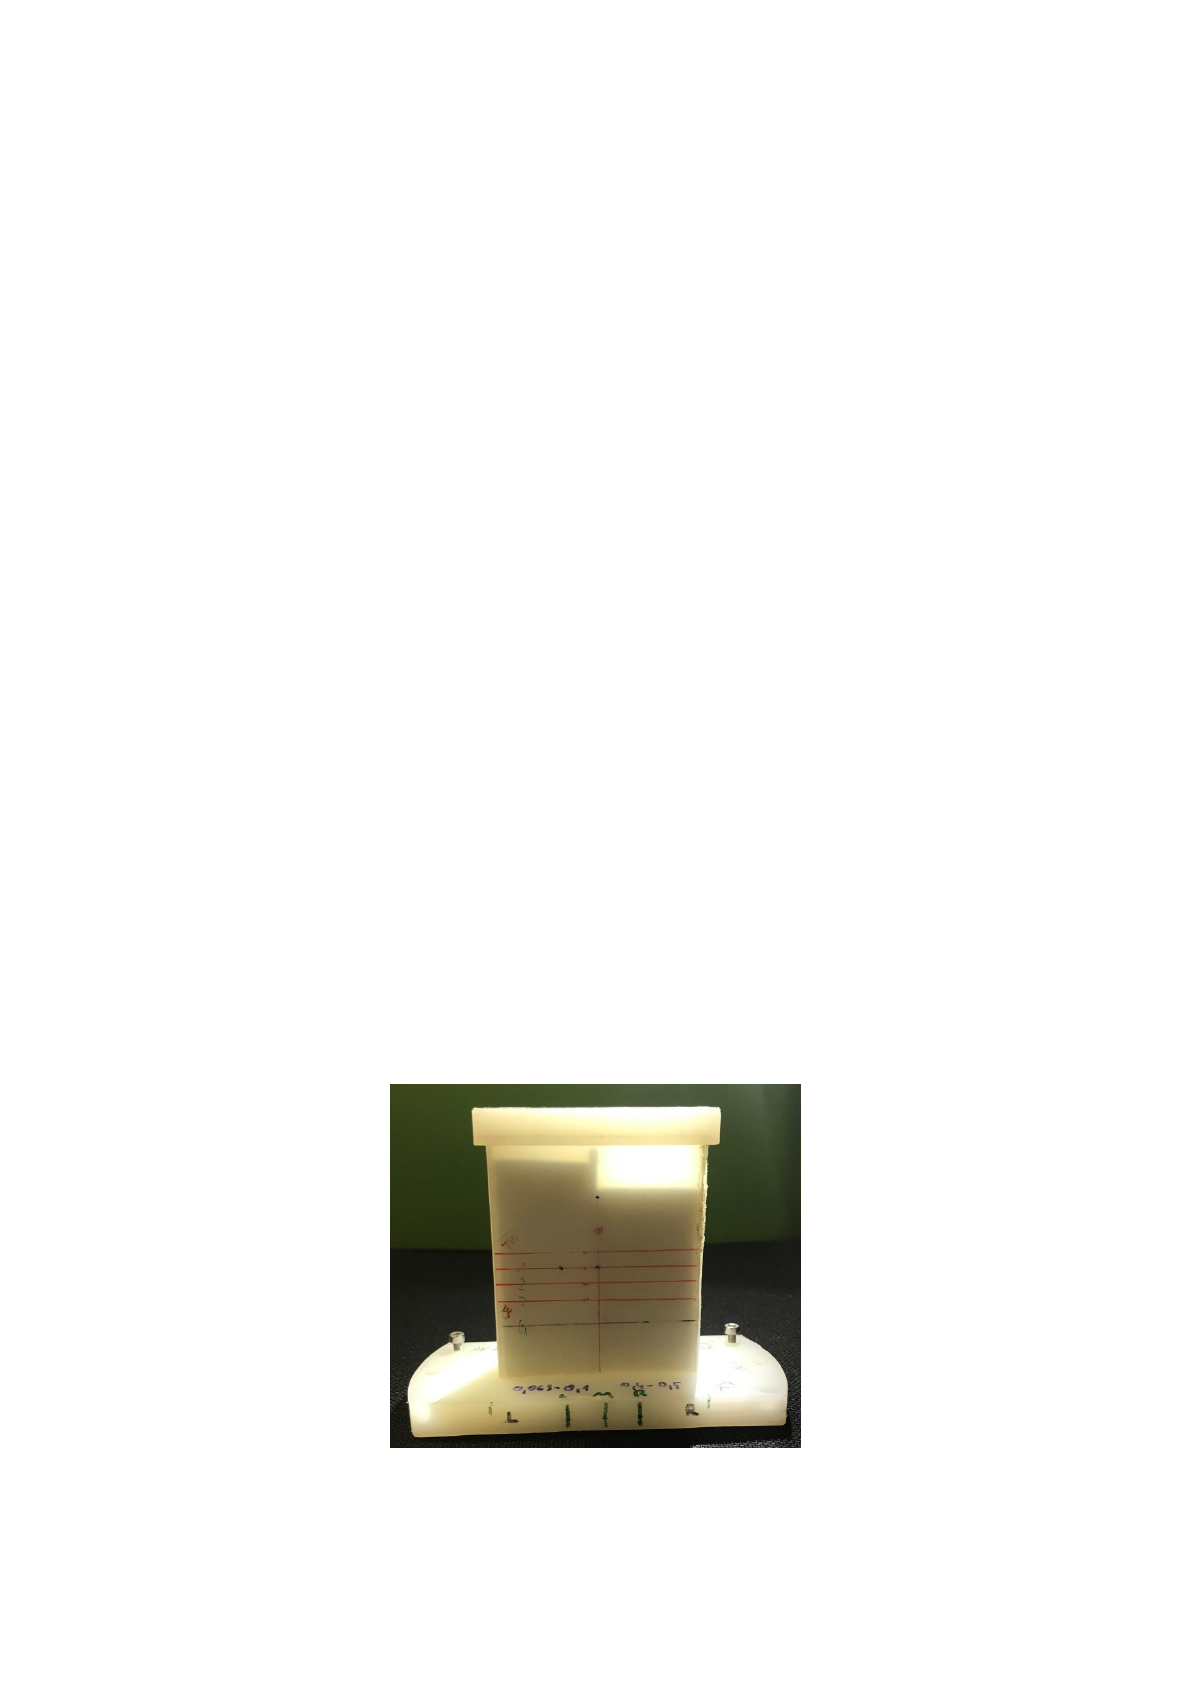
the corresponding image. Figure 1shows a box-shaped sample holder with a 10 mm sample thickness.
The box was divided with a 2 mm thick piece of paper and filled with quartz particles in different
size fractions.
Sensors 2019, 19, x FOR PEER REVIEW 3 of 23
2. Materials and Methods
Hyperspectral imaging of difficult samples with terahertz radiation is a complex task because of
the influence of many physical parameters. It starts with the complicated behavior of the Rayleigh
and Mie scattering of thousands of particles. In previous studies, the CELES software [25] enabled
the simulation of such complex Mie scattering arrangements and can be used to visualize the results.
However, the simulation is not a part of the current work; rather, the measurement possibilities of
the presented setup will be demonstrated. The experimental setup described consists of the soil
samples and holders, the THz spectrometer, the sample positioning system, the operating software,
and the data analysis.
Additionally, natural soil is a complex sample material and soil functionality depends on
multiple parameters, including particle size distribution, mineral content, carbon content or organic
matter, water, biology, and physical and chemical properties. Therefore, all first measurements were
made on simplified soil samples to reduce the number of parameters. The results in this article focus
on the imaging possibility of hyperspectral THz measurement.
2.1. Soil Samples and Holders
The measurement is influenced by the sample holder, the preparation of the sample, the filling
of the sample holder, and the compaction (process) in the sample holder. Even the measurement of
the empty sample holder is not adequate for calibration because of the different interface situation at
the sample holder walls. The best filling substance for calibration is oil [26], but this discussion is not
part of this work. The sample holders demonstrated may not be the best solution but rather are a
good practical approach. All samples in this study were placed in sample holders made of HDPE (high
density polyethylene) with a wall thickness of 2 mm. The holders were parallel, box-shaped, or wedge-
shaped. The wedge-shaped sample holder enables simultaneous measurements of different thickness.
The sample thickness was addressed accordingly. In some cases, the sample holder was separated into
domains with different samples (Figures 1–4) to demonstrate the resulting contrast in the
corresponding image. Figure 1 shows a box-shaped sample holder with a 10 mm sample thickness. The
box was divided with a 2 mm thick piece of paper and filled with quartz particles in different size
fractions.
Figure 1. HDPE (high density polyethylene) sample holder for 10 mm sample thickness. A two
millimeter thick piece of paper separates the holder in the middle. The left chamber is filled with the
63–100 µm quartz fraction, and the right chamber is filled with 400–500 µm quartz particles.
The free configuration of the scan positions helps to reduce measurement times. For a sample
preparation as shown in Figure 1, only the interface regions are sampled with smaller step widths for
higher resolution. Areas in a homogenous sample region can be represented with a few measurements
and can be scanned with a larger step width.
Figure 1.
HDPE (high density polyethylene) sample holder for 10 mm sample thickness.
A two millimeter thick piece of paper separates the holder in the middle. The left chamber is filled with
the 63–100 µm quartz fraction, and the right chamber is filled with 400–500 µm quartz particles.
Sensors 2020,20, 5660 4 of 22
The free configuration of the scan positions helps to reduce measurement times. For a sample
preparation as shown in Figure 1, only the interface regions are sampled with smaller step widths for
higher resolution. Areas in a homogenous sample region can be represented with a few measurements
and can be scanned with a larger step width.
Sensors 2019, 19, x FOR PEER REVIEW 4 of 23
Additionally, the dependency of the sample thickness can be analyzed simultaneously if a wedge-
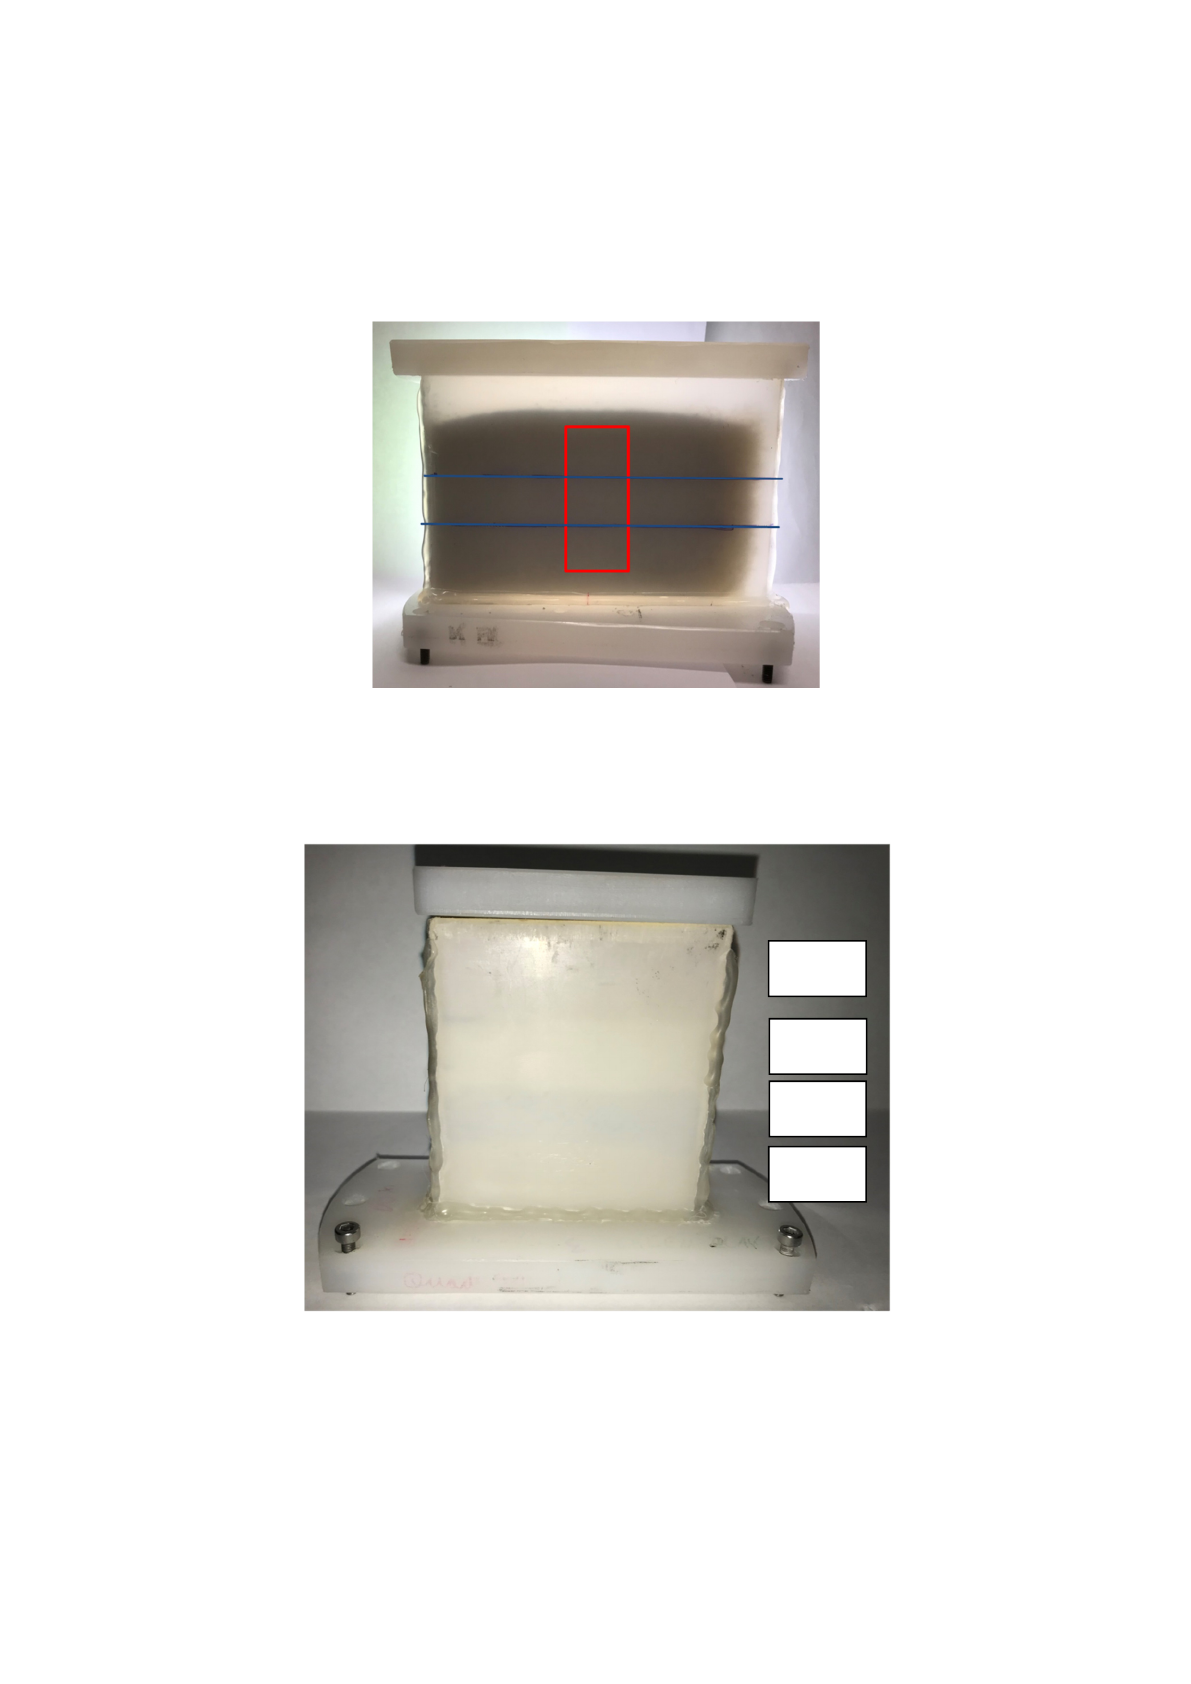
shaped sample holder is used (Figure 2). The sample holder was filled with quartz sand of three
different particle sizes. The overlay in Figure 2 with the blue lines indicates the boundary between the
three samples. These sample holders have a length-to-thickness ratio of 5:1. The smallest sample holder
started at zero thickness, the middle sample holder started at 5 mm, and the largest sample holder
started at 10 mm.
Figure 2. Wedge-shaped sample holder filled with three different soil samples. The blue horizontal
lines show the lines between the samples. Samples are quartz sand with different particle sizes. At
the bottom is the 100–200 µm fraction, in the middle is the 400–500 µm fraction, and on top is the 500–
600 µm fraction. The red rectangle shows the measurement area for this example.
Additionally, the sample holder can be filled with different materials, as shown in Figures 3 and
4. Therefore, identical measurement conditions are established, and quantitative differentiation is
enabled. For samples that change over time, the fastest scan line across the different materials is selected
to minimize the time difference. Every scan pattern for the image can be implemented by the user (see
Section 2.4).
Figure 3. HDPE sample holder for 10 mm sample thickness filled with four different soil samples. The
topsoil is pure Luvos
®
Healing Earth. The next sample is Luvos with 20% sulfur added. The third
Luvos
S
P2O5
K2CO3
Figure 2.
Wedge-shaped sample holder filled with three different soil samples. The blue horizontal
lines show the lines between the samples. Samples are quartz sand with different particle sizes. At the
bottom is the 100–200
µ
m fraction, in the middle is the 400–500
µ
m fraction, and on top is the 500–600
µ
m
fraction. The red rectangle shows the measurement area for this example.
Sensors 2019, 19, x FOR PEER REVIEW 4 of 23
Additionally, the dependency of the sample thickness can be analyzed simultaneously if a wedge-
shaped sample holder is used (Figure 2). The sample holder was filled with quartz sand of three
different particle sizes. The overlay in Figure 2 with the blue lines indicates the boundary between the
three samples. These sample holders have a length-to-thickness ratio of 5:1. The smallest sample holder
started at zero thickness, the middle sample holder started at 5 mm, and the largest sample holder
started at 10 mm.
Figure 2. Wedge-shaped sample holder filled with three different soil samples. The blue horizontal
lines show the lines between the samples. Samples are quartz sand with different particle sizes. At
the bottom is the 100–200 µm fraction, in the middle is the 400–500 µm fraction, and on top is the 500–
600 µm fraction. The red rectangle shows the measurement area for this example.
Additionally, the sample holder can be filled with different materials, as shown in Figures 3 and
4. Therefore, identical measurement conditions are established, and quantitative differentiation is
enabled. For samples that change over time, the fastest scan line across the different materials is selected
to minimize the time difference. Every scan pattern for the image can be implemented by the user (see
Section 2.4).
Figure 3. HDPE sample holder for 10 mm sample thickness filled with four different soil samples. The
topsoil is pure Luvos
®
Healing Earth. The next sample is Luvos with 20% sulfur added. The third
Luvos
S
P2O5
K2CO3
Figure 3.
HDPE sample holder for 10 mm sample thickness filled with four different soil samples.
The topsoil is pure Luvos
®
Healing Earth. The next sample is Luvos with 20% sulfur added. The third
sample is Luvos with 20% P
2
O
5
, and the bottom sample is Luvos with 20% K
2
CO
3
. All layers are
separated with 50 µm thick aluminum foil.
Additionally, the dependency of the sample thickness can be analyzed simultaneously if a
wedge-shaped sample holder is used (Figure 2). The sample holder was filled with quartz sand of three
different particle sizes. The overlay in Figure 2with the blue lines indicates the boundary between
Sensors 2020,20, 5660 5 of 22
the three samples. These sample holders have a length-to-thickness ratio of 5:1. The smallest sample
holder started at zero thickness, the middle sample holder started at 5 mm, and the largest sample
holder started at 10 mm.
Sensors 2019, 19, x FOR PEER REVIEW 5 of 23
sample is Luvos with 20% P2O5, and the bottom sample is Luvos with 20% K2CO3. All layers are
separated with 50 µm thick aluminum foil.
Luvos
®
Healing Earth is a commercial product (Heilerde-Gesellschaft Luvos Just GmbH & Co. KG,
Otto-Hahn-Strasse 23, 61,381 Friedrichsdorf, Germany) available in most drugstores. A 100 g quantity
of Luvos was prepared twice in four different mixtures containing K
2
CO
3
, P
2
O
5
, S, and MgCO
3
. The
LUVOS healing clay with precisely weighed additives was homogenized with a MUK mixer from
Fluxana (FLUXANA GmbH & Co. KG, Borschelstr. 3, 47,551 Bedburg-Hau, Germany) for 10 min at
3000 rpm in a mixing cup. Figure 3 shows the maximum concentration of 20% of each additive to
generate a contrast in the THz image.
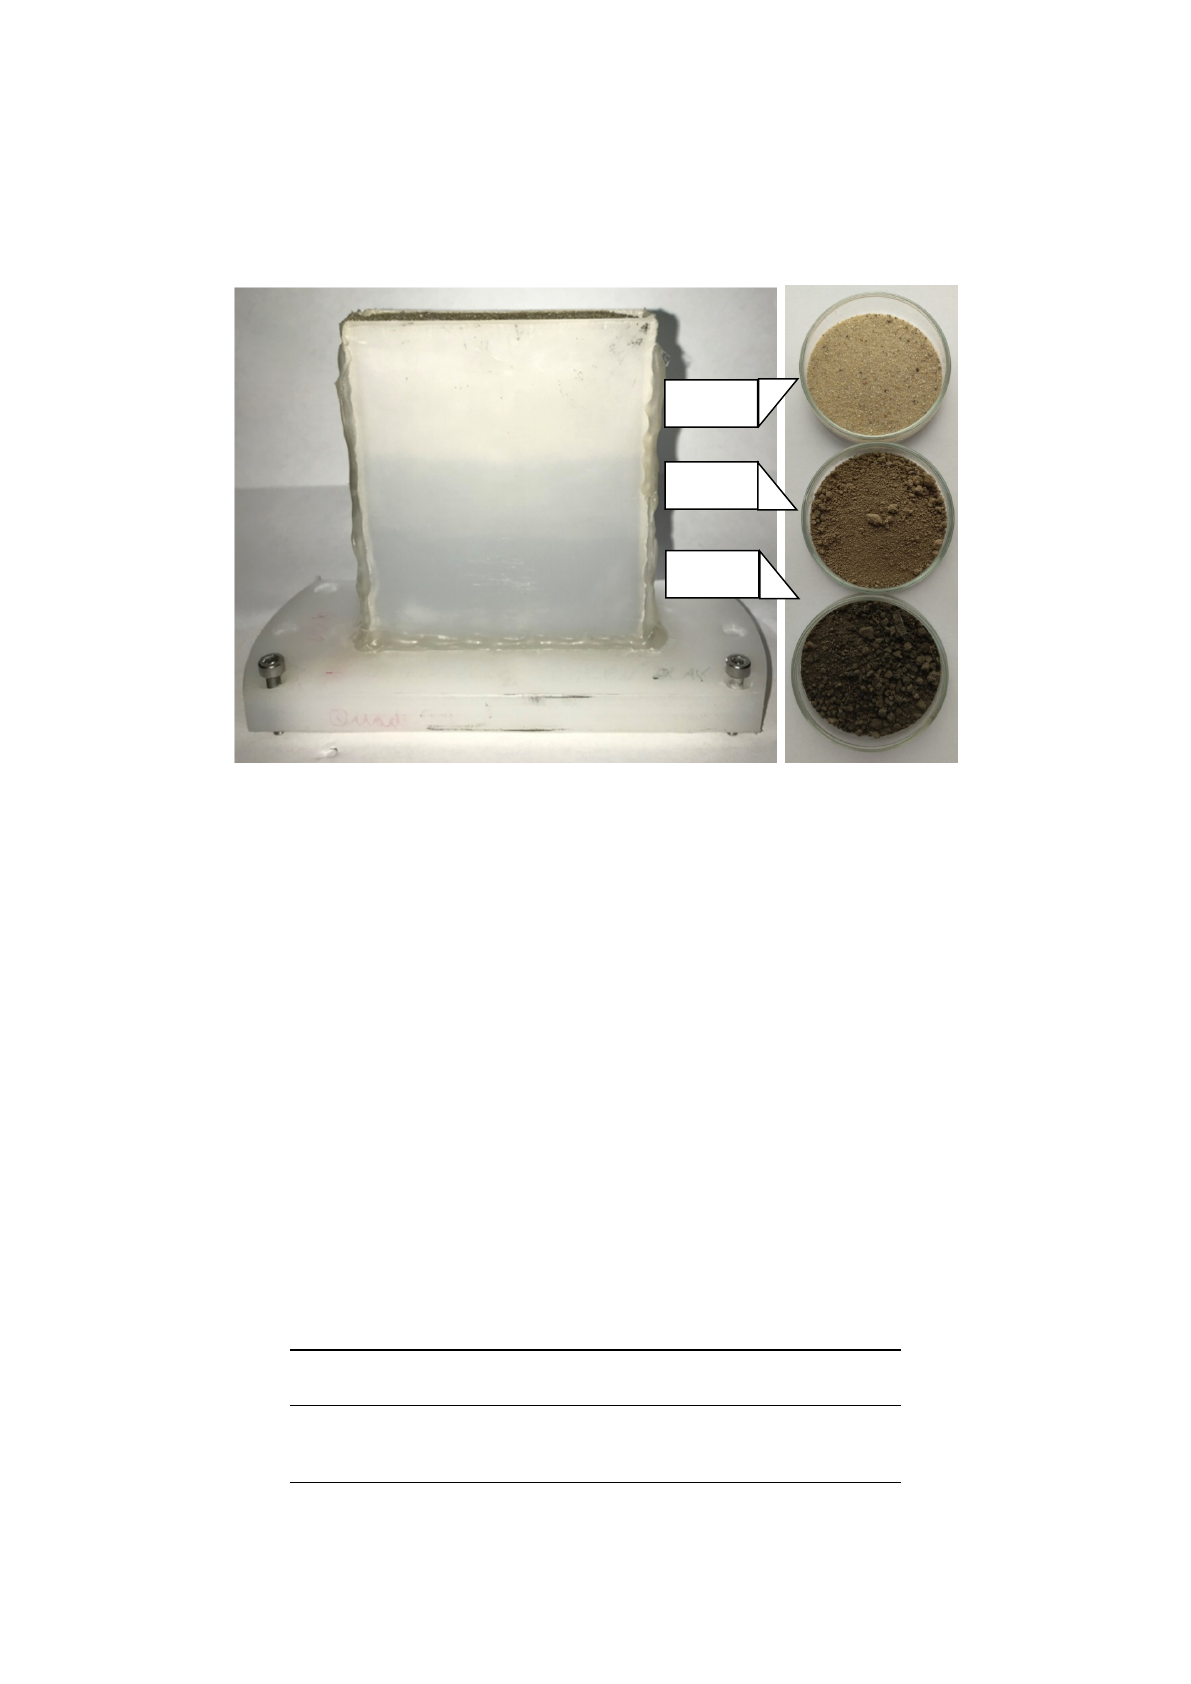
Figure 4. HDPE sample holder for 10 mm sample thickness with three different soil samples. The
samples are natural soil samples from the Potsdam region and have different compositions.
Figure 4 shows the rectangle sample holder filled with three sieved natural soil samples. All
aggregates were broken by hand pestling. The color of the soil sample indicates the amount of organic
content. Table 1 shows the associated results.
Table 1. Analysis of the air-dried soil samples. The difference to 100% is the remainder, which is so-
called “mineral ashes”.
Sample name DM105 OM C N S
% % % % %
T1 99.97 0.238 0.010 0.001 0.006
T2 99.75 1.554 0.451 0.017 0.030
T3 93.50 30.50 15.50 0.142 3.61
DM 105 is the dry matter of the sample after oven-drying for 24 h at 105 °C; OM is the amount of organic
matter; C, N, and S are the concentrations of carbon, nitrogen, and sulfur, respectively.
Buried objects are often used to demonstrate the penetration capability of THz radiation.
Organic material such as carrot pieces (Figure 5), for example, in silt or clay, is detectable, but
detection is not possible in sand because of the strong Mie scattering. With hyperspectral imaging,
all images at the different frequencies can be averaged, and the mean damping can be estimated.
Additionally, the focus is adjusted to the middle position of the sample holder and thereby to the
surface of the carrot. Therefore, the interface region between the carrot and the scattering sand is
T1
T2
T3
Figure 4.
HDPE sample holder for 10 mm sample thickness with three different soil samples.
The samples are natural soil samples from the Potsdam region and have different compositions.
Additionally, the sample holder can be filled with different materials, as shown in Figures 3
and 4. Therefore, identical measurement conditions are established, and quantitative differentiation
is enabled. For samples that change over time, the fastest scan line across the different materials is
selected to minimize the time difference. Every scan pattern for the image can be implemented by the
user (see Section 2.4).
Luvos
®
Healing Earth is a commercial product (Heilerde-Gesellschaft Luvos Just GmbH & Co.
KG, Otto-Hahn-Strasse 23, 61,381 Friedrichsdorf, Germany) available in most drugstores. A 100 g
quantity of Luvos was prepared twice in four different mixtures containing K
2
CO
3
, P
2
O
5
, S, and MgCO
3
.
The LUVOS healing clay with precisely weighed additives was homogenized with a MUK mixer from
Fluxana (FLUXANA GmbH & Co. KG, Borschelstr. 3, 47,551 Bedburg-Hau, Germany) for 10 min at
3000 rpm in a mixing cup. Figure 3shows the maximum concentration of 20% of each additive to
generate a contrast in the THz image.
Figure 4shows the rectangle sample holder filled with three sieved natural soil samples.
All aggregates were broken by hand pestling. The color of the soil sample indicates the amount of
organic content. Table 1shows the associated results.
Table 1.
Analysis of the air-dried soil samples. The difference to 100% is the remainder, which is
so-called “mineral ashes”.
Sample Name DM105 OM C N S
% % % % %
T1 99.97 0.238 0.010 0.001 0.006
T2 99.75 1.554 0.451 0.017 0.030
T3 93.50 30.50 15.50 0.142 3.61
DM 105 is the dry matter of the sample after oven-drying for 24 h at 105
◦
C; OM is the amount of organic matter;
C, N, and S are the concentrations of carbon, nitrogen, and sulfur, respectively.
Loading more pages...