
1
Vol.:(0123456789)
Scientific Reports | (2023) 13:12807 | https://doi.org/10.1038/s41598-023-39841-9
www.nature.com/scientificreports
A fluorometric assay to determine
labile copper(II) ions in serum
Maria Maares
1,2, Alessia Haupt
1, Christoph Schüßler
1,2, Marcel Kulike‑Koczula
3,
Julian Hackler
2,4, Claudia Keil
1, Isabelle Mohr
5, Lutz Schomburg
2,4, Roderich D. Süssmuth
3,
Hans Zischka
6,7, Uta Merle
5 & Hajo Haase
1,2*
Labile copper(II) ions (Cu2+) in serum are considered to be readily available for cellular uptake and to
constitute the biologically active Cu2+ species in the blood. It might also be suitable to reflect copper
dyshomeostasis during diseases such as Wilson’s disease (WD) or neurological disorders. So far, no
direct quantification method has been described to determine this small Cu2+ subset. This study
introduces a fluorometric high throughput assay using the novel Cu2+ binding fluoresceine‑peptide
sensor FP4 (Kd of the Cu2+‑FP4‑complex 0.38 pM) to determine labile Cu2+ in human and rat serum.
Using 96 human serum samples, labile Cu2+was measured to be 0.14 ± 0.05 pM, showing no correlation
with age or other serum trace elements. No sex‑specific differences in labile Cu2+ concentrations were
noted, in contrast to the total copper levels in serum. Analysis of the effect of drug therapy on labile
C u 2+ in the sera of 19 patients with WD showed a significant decrease in labile Cu2+ following copper
chelation therapy, suggesting that labile Cu2+ may be a specific marker of disease status and that the
assay could be suitable for monitoring treatment progress.
The essential trace element copper is indispensable for various physiological functions, such as support of oxida-
tive phosphorylation, antioxidant activity, formation of several hormones, and iron metabolism1,2. The metal is
distributed throughout the body via the bloodstream, and 0.75–1.4mg/L Cu2+ can be found in human serum3,4.
Approximately 70–90% thereof is contained in ceruloplasmin (CP), while the remaining Cu2+, which is typically
being referred to as loosely bound Cu2+, is associated with albumin (10–15%), α-macroglobulin (5–15%), clotting
factors, enzymes (superoxide dismutase (SOD), Oxidases), metallothionein, as well as small Cu2+ carriers3–5. The
loosely bound Cu2+ species comprises the whole amount of serum Cu2+ that is not bound to CP, whereas so-
called labile Cu2+ represents a smaller subset of the loosely bound pool and is defined only to be in equilibrium
with low molecular weight (LMW) ligands, e.g., amino acids. This labile Cu2+ pool is considered to be readily
available for cellular uptake and was even discussed to cross the blood–brain barrier as LMW-Cu2+-complexes6.
As copper is redox active, an increase of labile Cu2+ must be tightly controlled to prevent formation of reactive
oxygen species and tissue damage1,7.
Diseases associated with copper dishomeostasis and changes in serum Cu2+ are Menkes, Wilson’s (WD)8,9,
cancer10, and neurodegenerative diseases1,11–16, such as Parkinson’s and Alzheimer’s disease. Particularly in the
copper storage disorder WD8,9 and neurodegenerative diseases1,11–13,15 both loosely bound and labile levels of
serum Cu2+ were found to be elevated. Hence, these serum Cu2+ species are considered to serve as promising
diagnostic markers for disease-related alterations of copper homeostasis6,13.
In addition to indirect quantification of loosely bound or non-CP-bound Cu2+ in serum by determination of
CP content and total Cu2+ content15,17,18, several experimental approaches for direct measurement of this Cu2+
species have been developed to date. This Cu2+ pool, which is also often defined as extractable or exchangeable
Cu2+, has been either directly quantified by liquid chromatography (LC) coupled to inductively coupled plasma-
mass spectrometry (ICP-MS)19,20, or after extracting the loosely bound metal in serum with Cu2+ chelators such
as EDTA9,21 or Cu2+-affine resins22,23 followed by size ultrafiltration or size exclusion chromatography (SEC)
OPEN
1Department of Food Chemistry and Toxicology, Technische Universität Berlin, Straße des 17. Juni 135,
10623 Berlin, Germany. 2TraceAge-DFG Research Unit on Interactions of Essential Trace Elements in Healthy and
Diseased Elderly, Potsdam-Berlin-Jena, Germany. 3Department of Organic and Biological Chemistry, Technische
Universität Berlin, Straße des 17. Juni 135, 10623 Berlin, Germany. 4Institute for Experimental Endocrinology,
Berlin Institute of Health, Charité-Universitätsmedizin Berlin, Corporate Member of Freie Universität Berlin,
Humboldt-Universität zu Berlin, 10115 Berlin, Germany. 5Department of Internal Medicine IV, University Hospital
Heidelberg, 69120 Heidelberg, Germany. 6Institute of Molecular Toxicology and Pharmacology, Helmholtz Center
Munich, German Research Center for Environmental Health, Ingolstaedter Landstrasse 1, 85764 Neuherberg,
Germany. 7School of Medicine, Institute of Toxicology and Environmental Hygiene, Technical University Munich,
Biedersteiner Strasse 29, 80802 Munich, Germany. *email: [email protected]

2
Vol:.(1234567890)
Scientific Reports | (2023) 13:12807 | https://doi.org/10.1038/s41598-023-39841-9
www.nature.com/scientificreports/
and quantified either by ICP-MS21–23, atomic absorption spectrometry (AAS)9,23, or fluorescent Cu2+ sensors13.
The resulting concentration of loosely bound Cu2+ was in the range of 0.5–7µM9,13,19–23. Up to now, the smaller
serum Cu2+ fraction that is not bound to CP or albumin, but in equilibrium with the remainder of Cu2+ binding
compounds in serum, was quantified by means of ultrafiltration followed by direct measurement of copper by
AAS6,24,25 or ICP-MS8. This fraction is in the nanomolar concentration range6 and has often been equated with
labile Cu2+. However, there is at present no suitable method allowing direct quantification of labile Cu2+ in serum
without a prior extraction step. The use of metal-responsive fluorescent sensors to quantify free metal species in
biofluids represents a suitable approach to directly measure metal cations in serum while requiring small sample
volumes26. Therefore, the aim of this study was to establish a fluorescence-based method for determining the
concentration of labile Cu2+ in serum samples with a small sample volume and a high throughput.
Materials and methods
Materials. Chelex® 100 resin (Bio-Rad, Hercules, USA), CuSO4, Dimethylsulfoxide (DMSO), Ethylenediami-
netetraacetic acid (EDTA), Ethylene glycol bis(2-aminoethyl ether)tetraacetic acid (EGTA), 4-(2-hydroxyethyl)-
1-piperazineethanesulfonic acid (HEPES), histidine, were purchased from Sigma Aldrich (Munich, Germany).
All other materials were from standard sources and of analytical purity.
Fluorescent sensors. Fluorescein peptide 4 (FP4) was synthesized by Peptide Specialty Laboratories
GmbH (Heidelberg, Germany). Dansyl peptide 4 (DP4) was synthesized by manual solid phase peptide synthe-
sis (SPPS) using a standard Fmoc-strategy. Fmoc-K(DNS)-OH was used as starting material for the SPPS and
synthesized according to the method of Williamson etal.27 (for details refer to Supplementary Sect. 1). Stock
solutions of FP4 and DP4 (1 mM, in DMSO) were aliquoted and stored at −20°C. Each aliquot was thawed only
twice.
Determination of Cu2+ binding affinity. Determination of the dissociation constant of the
Cu2+-FP4-complex was done as described28,29 using histidine and EGTA as competitors for Cu2+ binding. Exper-
iments were performed in assay buffer, consisting of 50 mM HEPES, pH 7.4, depleted from bivalent metal ions
by treatment with Chelex® 100 resin26. To determine the aqueous Cu2+ concentration, CHEAQS Next 2014-2020
software and the NIST Database 46 Version 8.0 was applied, using log KA for Cu2+-histidine, Cu2+-histidine2, and
Cu2+-EGTA at pH 7.4 from Young etal.28 and log KA for Cu2+-HEPES from Sokołowska etal.30 (Supplementary
Table1).
Human serum samples. A commercially available standard serum derived from a mixture of human
serum samples was used as reference serum (in.vent Diagnostica GmbH, Hennigsdorf, Germany). A set of com-
mercially available individual human serum samples (N = 96, Table1) (in.vent Diagnostica GmbH, Hennigsdorf,
Germany) served as a reference cohort for healthy individuals within this study.
Serum samples of WD patients were obtained from 19 patients (Table1) at the time point of disease diagnosis
and from the same patients after initiation of medical treatment. Mean treatment duration till second time point
under therapy was 72.9 (range 6–144) months. Patients were recruited between 2010 and 2018 at the University
Hospital Heidelberg, Germany, as part of the clinical trial ‘Biochemical and genetic markers of liver diseases’.
Clinical parameters of the investigated human WD patients and the respective medical treatment are listed in
Supplementary Tables2 and 3. The study was approved by the ethics committee of the University of Heidelberg
and informed consent to participate in the study was obtained from each subject. The study was carried out in
accordance with the Declaration of Helsinki.
Rat serum samples. Control Atp7b+/− LPP rats (N = 5; crossbreed between Long Evans cinnamon rats and
Piebald Virol Glaxo rats) were fed adlibitum with standard rat chow (Altromin Spezialfutter GmbH, Seelen-
kamp, Germany) and tap water31. At the age of 81–93days, animals were sacrificed, and serum was collected.
Experiments were approved by the government authorities of the Regierung von Oberbayern, Munich, Ger-
many. Animals were maintained under the Guidelines for the Care and Use of Laboratory Animals of the Helm-
holtz Center Munich. All methods are reported in accordance with ARRIVE guidelines.
Labile serum Cu2+. Similar to the labile zinc (Zn2+) assay reported by Alker etal.26, 50mM HEPES buffer,
pH 7.4, bivalent metal ion-depleted with Chelex® 100 resin, was used in all steps. 20 µL human or rat serum,
Table 1. Overview of human serum samples in this study. IQR interquartile range.
Female Male
Human control cohort (N = 96)
Number of donors 60 (62.5%) 36 (37.5%)
Age (median, IQR) 35.0 (24.0; 43.8) 33.5 (26.3; 47.5)
Wilson disease patients (N = 19)
Number of donors 9 (47.4%) 10 (52.6%)
Age (median, IQR) 23 (19; 30) 28 (21.3; 33)

3
Vol.:(0123456789)
Scientific Reports | (2023) 13:12807 | https://doi.org/10.1038/s41598-023-39841-9
www.nature.com/scientificreports/
pre-diluted to 5% in ice-cold assay buffer, were added to 10 nM FP4 in 80 µL assay buffer in black 96-well plates
(Brand, Wertheim, Germany) and gently shaken in the dark. During the assay, only the inner 60 wells were used,
and each sample was analyzed in triplicates. The outer wells were filled with distilled water to ensure a uniform
temperature over the entire plate. After 60min, the fluorescence signal (F) of FP4 was measured using a SPARK
Tecan plate reader (Tecan, Switzerland) at λex = 495 nm and λEm = 523 nm. Subsequently, 5 µL of 42mM EDTA
(diluted in assay buffer) was added to the wells, resulting in a final concentration of 2mM EDTA, and incubated
for additional 60min. After measuring the maximum fluorescence signal of the sensor without any bound Cu2+
(Fapo), the minimum fluorescence signal (FCu) was generated by adding 5 µL of 48.4 mM CuSO4 (in distilled
water), corresponding to a final Cu2+ concentration of 2.2mM, and the fluorescence intensity was determined
after incubation for further 60min. All steps were performed in the dark and at room temperature (25°C). The
labile Cu2+ concentration was calculated according to Grynkiewicz etal.32 by multiplying [(Fapo − F)/(F − FCu)]
with the dissociation constant of the Cu2+-FP4-complex of 0.38 pM, determined in this study.
Total trace element levels in serum. Concentrations of total selenium, copper, and zinc in the serum
samples were quantified with total reflection X-ray fluorescence (TXRF) using a benchtop TXRF spectrometer
(S4 T-STAR, Bruker Nano GmbH, Berlin, Germany) as previously described33,34.
Labile serum Zn2+. The concentration of labile Zn2+ was determined by a fluorometric method using the
low molecular weight Zn2+ sensor Zinpyr-1 (Santa Cruz biotechnology, Dallas, USA) as described26.
Statistical analysis. Statistical analysis was performed using GraphPad Prism software version 9.3.1
(GraphPad Software Inc., San Diego, CA, USA). Data were tested for normal distribution using the Shapiro–
Wilk test. Correlations were analyzed using Spearman correlation analysis. Statistically significant differences
between two means were identified with t-test for parametric or Mann–Whitney test for non-parametric data,
or between three or more means by one-way analysis of variance (ANOVA) followed by Tukey’s multiple post
hoc comparison test or non-parametric Kruskal–Wallis with Dunn’s multiple comparison test. Differences were
considered significant if p values were *p < 0.05, **p < 0.01, or ***p < 0.001, as indicated in the figure legends.
Error bars represent standard deviation (SD) of at least three independent experiments.
Results and discussion
Choice of Cu2+‑responsive fluorescent sensor. A metal-responsive sensor for the detection and quan-
tification of labile Cu2+ in serum must exhibit Cu2+-dependent fluorescence changes, high Cu2+-selectivity and
-sensitivity, but also have suitable Cu2+ affinity and reversible binding of the metal35. In addition, good water
solubility and negligible interaction with the complex biomatrix are required for the application of such sensors
in biofluids, such as serum containing proteins, lipids, and carbohydrates. A suitable fluorescence yield (Ф) and
extinction coefficient (ε), which defines the brightness of the fluorophore = Ф* ε35,36 is another crucial require-
ment for the physicochemical properties of sensors. Initially, the peptide-based dansyl Cu2+ sensors developed
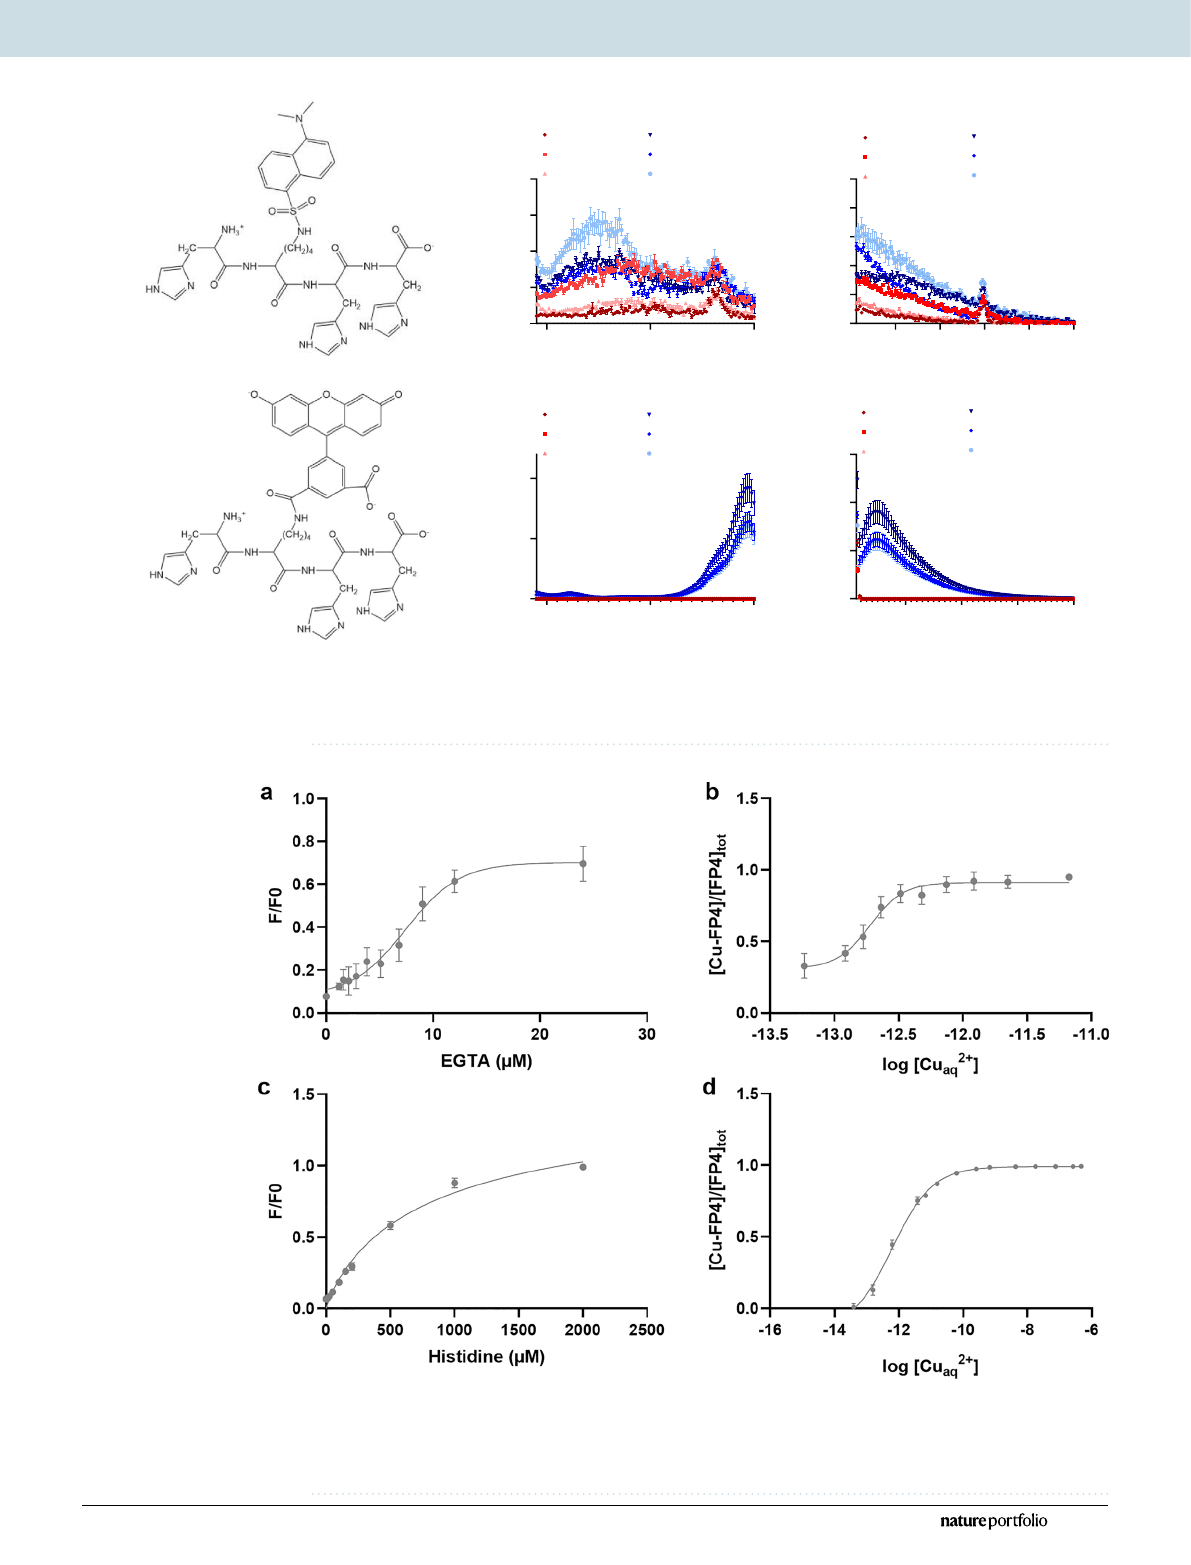
by Young etal. were chosen as they seemed to meet all prerequisites28. Unfortunately, DP4 (Fig.1a) turned out
to be poorly suited for detecting labile Cu2+ in serum samples, as the absorption of serum proteins interfered
with fluorescence of the dansyl sensor. According to the excitation and emission spectra of DP4 in the presence
of 1% HS or correspondingly diluted physiological serum albumin levels, added as 0.5g/L bovine serum albu-
min (BSA), this was mainly due to the albumin content of serum (Fig.1b, c). To circumvent this interference,
the dansyl fluorophore of the peptide sensor was replaced with carboxyfluorescein (FAM), which emits light of
lower energy and has a higher fluorescence yield and extinction coefficient than the dansyl molecule28,37, leading
to the sensor FP4 (Fig.1d). In contrast to DP4, FP4 was undisturbed by any autofluorescence or absorbance of
serum proteins. Comparison of FP4 in the presence and absence of HS shows that the emission and excitation
spectra were not affected by the presence of serum (Fig.1e, f). Furthermore, the metal selectivity of the probe
was assessed (Supplementary Fig.1). No physiologically relevant cation in serum had an effect on sensor fluo-
rescence or Cu2+ binding by FP4. However, FP4 fluorescence was quenched by adding a 20-fold excess of Ni2+
to FP4, yet the applied concentrations do not represent physiological nickel levels in serum38. Furthermore,
subsequent addition of Cu2+ resulted in a decrease in fluorescence comparable to that observed with FP4 and
Cu2+ alone.
Dissociation constant of the Cu2+‑FP4‑complex. To assess whether introduction of FAM did influ-
ence the Cu2+-affinity of the probe, the dissociation constant of FP4 was determined with EGTA and histidine by
a similar experimental approach as the one applied by Young etal.28, yielding a conditional log(Kd) = −12.416 for
the Cu2+-FP4-complex, corresponding to 0.38 pM (Fig.2, Supplementary Table1). Accordingly, the Cu2+-affinity
of FP4 is lower than that of DP4, but in the vicinity of the hitherto reported labile Cu2+ levels in serum6,22 and
thus suitable for determining this Cu2+ species.
Assay parameters. To minimize the perturbation of the equilibria between labile and bound Cu2+ in serum
by the addition of another Cu2+ binding species added in form of the sensor, the probe concentration needs to be
as low as possible26. To identify suitable concentrations of FP4, 0–100 nM FP4 were titrated to 1% human serum
and baseline fluorescence (F) was measured, followed by detection of sensor fluorescence upon sequential addi-
tion of 2 mM EDTA as Cu2+ chelator and 2.2mM Cu2+ to saturate the probe, generating Fapo and Fcu, respectively
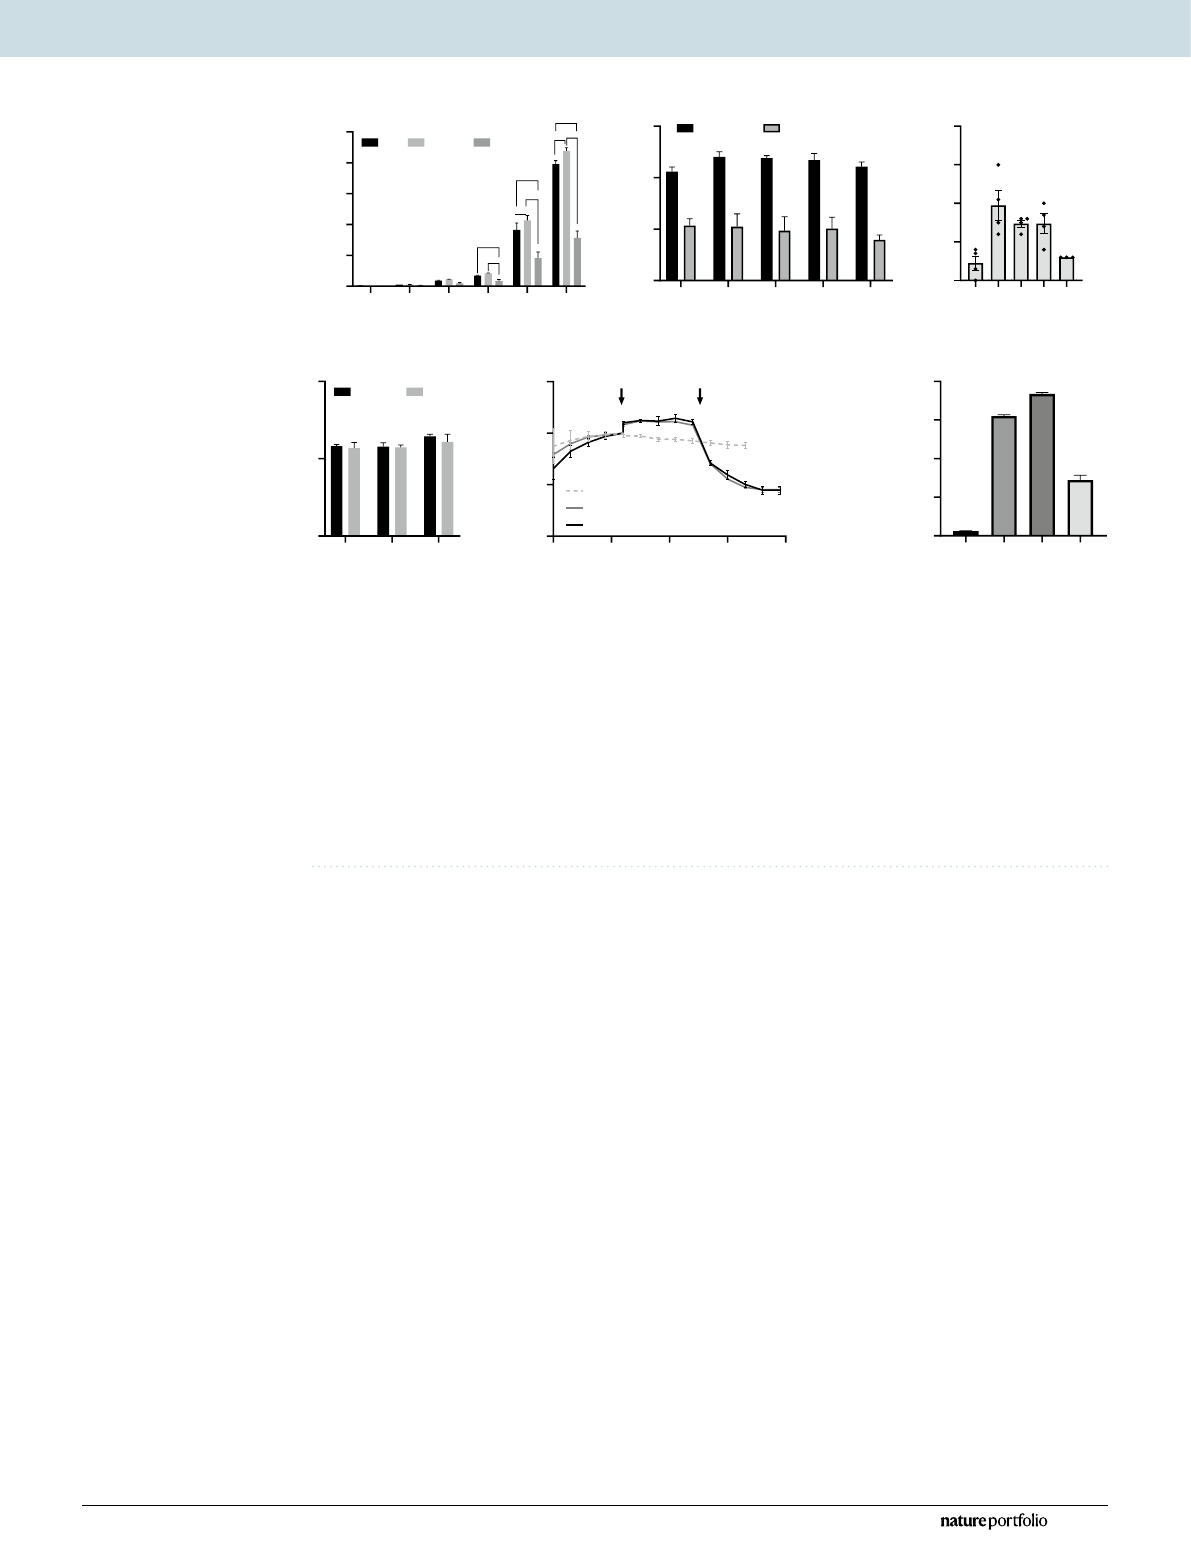
(Fig.3). 10 nM FP4 were sufficient to induce a stable fluorescence signal distinguishable from the autofluo-
rescence of serum and buffer (Fig.3a) while providing maximum Fapo to F ratio (Fig.3b). By determining the
4
Vol:.(1234567890)
Scientific Reports | (2023) 13:12807 | https://doi.org/10.1038/s41598-023-39841-9
www.nature.com/scientificreports/
300400 500
0
5000
10000
15000
20000
Wavelength (nm)
Fluorescenceintensity (a.u.)
at
λ
em
=550 nm
0µMDP4
0µMDP4 +BSA
0µMDP4 +HS
1µMDP4
1µMDP4 +BSA
1µMDP4 +HS
550600 650700 750
0
2000
4000
6000
8000
10000
Wavelength(nm)
Fluorescence intensity(a.u.)
at
λex
=336 nm
0µMDP4
0µMDP4 +BSA
0µMDP4 +HS
1µMDP4
1µMDP4 +BSA
1µMDP4 +HS
300400 500
0
50000
100000
Wavelength (nm)
Fluorescence intensity (a.u.)
at
λ
em
=523nm
0µMFP4
0µMFP4 +BSA
0µMFP4 +HS
1µMFP4
1µMFP4 +BSA
1µMFP4 +HS
550600 65
07
00
0
10000
20000
30000
Wavelength(nm)
Fluorescenceintensity(a.u.)
at λ
ex
=492 nm
0µMFP4
0µMFP4 +BSA
0µMFP4 +HS
1µMFP4
1µMFP4 +BSA
1µMFP4 +HS
b
e f
ca
d
Figure1. Spectra of DP4 and FP4. Chemical structure, excitation, and emission spectra of 1 µM DP4 (a–c) and
1 µM FP4 (d–f) in 50 mM HEPES with 1% human serum or 2.5 mg/mL BSA (final concentrations). Data are
shown as means ± SD of three independent experiments.
Figure2. Cu2+ binding affinity of FP4. Relative fluorescence of FP4 in the presence of different concentrations
of EGTA (a) and histidine (c). Sigmoidal dose response of [Cu-FP4]/[FP4]tot and the labile Cu2+ concentration
log [Cuaq2+] upon titration with chelators EGTA (b) or histidine (d). Shown are means ± standard deviation of
three independent experiments.
5
Vol.:(0123456789)
Scientific Reports | (2023) 13:12807 | https://doi.org/10.1038/s41598-023-39841-9
www.nature.com/scientificreports/
fractional saturation of the sensor in the presence of human serum and using the Kd for the Cu2+-FP4-complex
of 0.38 pM, the labile Cu2+ level in the reference serum was 0.14 ± 0.02 pM when applying 10 nM sensor (Fig.3c).
The addition of 5–50 nM sensor had no effect on the calculated labile Cu2+ concentration, while the addition of
excessive amounts of sensor (100 nM) considerably decreased the determined labile Cu2+ values (Fig.3c). This
confirms the importance of an optimized sensor concentration and is consistent with other studies on the influ-
ence of excessive sensor levels on the determined labile metal concentrations39,40.
After a suitable sensor concentration was found, the assay parameters F, Fapo, and Fcu had to be optimized with
regard to incubation time and concentrations of Cu2+ and Cu2+ chelator, respectively. Comparison of the Cu2+
chelators EGTA and EDTA to measure the maximum fluorescence signal of the Cu2+-free sensor (Fapo) shows that
2 mM EDTA induced significantly higher fluorescence than lower EDTA concentrations, while no significant
differences between the chelators and tested EGTA concentrations were observed. Accordingly, a final EDTA
concentration of 2 mM was chosen to generate the Fapo signal in the final assay (Fig.3d). After inducing Fapo, the
addition of CuSO4 in excess (concentration per well: 2.2mM) was required to fully saturate FP4 with Cu2+ and
quench its fluorescence to yield the minimum fluorescence of the sensor (Fcu) (Fig.3e). In order to optimize the
incubation time required to generate the assay parameters F, Fapo, and Fcu, time-resolved measurements were
carried out, showing that an incubation of 60min each were sufficient to allow establishing an equilibrium for
Cu2+ in the distribution between the ligands in serum and FP4, generating stable fluorescence signals for all three
parameters in human (Fig.3e) and rat serum (Supplementary Fig.2).
According to the final assay protocol, the assay time is about 3h for up to 19 samples per plate and with
parallel and slightly staggered preparation of 4 plates, a total of 76 samples can be analyzed within 4h. Each
serum is tested in triplicate, which, including calculated dead volume, means a total sample volume requirement
of only 5 µL serum. A human reference serum is carried on each plate as quality control. The intra- and inter-
day reproducibility of the assay was investigated by measuring the human reference serum, with a labile Cu2+
level of 0.05 pM, and evaluated with a relative standard deviation of 16.3% (intra-day) and 21.6% (inter-day)
of the determined labile Cu2+ levels, respectively (Fig.4a). To also characterize the requirements of the assay
with regard to sample quality, the influences of freeze-thawing cycles, storage temperature, and Cu2+ spiking of
the reference serum on the final labile Cu2+ concentration were determined (Fig.4b–d). Accordingly, storage
of samples at −80°C or −20°C is required (Fig.4b) while only a minimum number of freeze–thaw cycles are
acceptable (Fig.4c) to avoid affecting the labile Cu2+ content in serum. In addition, the test can also be used to
0151050100
0
2000
4000
6000
8000
10000
FP4(nM)
Fluorescenceintensity (a.u.)
at
λ
ex=495 nm
FFapo Fcu
*
**
***
***
***
***
***
***
1510 50 100
0.0
0.5
1.0
1.5
FP4(nM)
Relative fluorescence
Fapo/F Fcu/F
1510 50 100
0.0
0.1
0.2
0.3
0.4
FP4(nM)
Labilecopper(pM)
0.51 2
0.5
1.0
1.5
Cu chelator (mM)
Fapo/F
at 60min
EGTAEDTA
aa,b aa,bba,b
050100 150200
0.0
0.5
1.0
1.5
t(min)
F/F
at 60 min
2.1mMCuSO
4
2.2mMCuSO
4
EDTA CuSO
4
w/oEDTAand CuSO
4
0
2000
4000
6000
8000
Fluorescence intensity (a.u.)
at λex= 495 nm
10 nM FP4
1% HS
2mMEDTA
2.2mMCuSO
4
+++
+++
+
-
-
-+
--
-
-+
c
d
a
b
abc
de f
Figure3. Optimization of assay parameters. Assay parameters were tested in the presence of 1% human
reference serum. (a) Fluorescence intensity depending on sensor concentration (F), after the addition of 2 mM
EDTA (Fapo) and 2.2 mM CuSO4 (Fcu). (b) Fapo/F and Fcu/F ratios of 1–100nM FP4 in the presence of 1%HS.
(c) Labile Cu2+ (pM) in HS depending on sensor concentration. (d) Fluorescence of apo-FP4 in the presence
of 1% HS as ratios of the maximal fluorescence upon addition of 0.5–2 mM EDTA or EGTA relative to the FP4
fluorescence at 60 min. (e) Time course of the fluorescence signal of FP4 in 1% HS for parameters F, Fapo (after
addition of 2 mM EDTA), and Fcu (after addition of 2.1 mM or 2.2 mM CuSO4) relative to the fluorescence
at t = 60 min. (f) Fluorescence of final parameters. Significant differences are indicated by *p < 0.05; *p < 0.01;
***p < 0.001 (a) (two way ANOVA with Sidak’s multiple comparisons test) or by letters (d,f), whereas bars
sharing a letter are not significantly different (one way ANOVA with Tukey’s multiple comparisons test). Results
are shown as means ± SEM/SD of at least three independent experiments.
Loading more pages...