
Synthesis of ternary transition metal fluorides Li
3
MF
6
via a sol–gel route as
candidates for cathode materials in lithium-ion batteries†
Julia Kohl,
a
Dennis Wiedemann,
a
Suliman Nakhal,
a
Patrick Bottke,
b
Noel Ferro,
c
Thomas Bredow,
c
Erhard Kemnitz,
d
Martin Wilkening,
b
Paul Heitjans
e
and Martin Lerch*
a
Received 5th April 2012, Accepted 8th June 2012
DOI: 10.1039/c2jm32133e
A sol–gel route for ternary lithium fluorides of transition metals (M) is presented allowing the synthesis
of Li
3
MF
6
-type and Li
2
MF
5
-type compounds. It is based on a fluorolytic process using transition metal
acetylacetonates as precursors. The domain size of the obtained powders can be controlled by
modifying the conditions of synthesis.
6
Li and
7
Li magic angle spinning (MAS) nuclear magnetic
resonance (NMR) spectroscopy is used to study local environments of the Li ions in orthorhombic and
monoclinic Li
3
VF
6
as well as Li
2
MnF
5
. The number of magnetically inequivalent Li sites found by
MAS NMR is in agreement with the respective crystal structure of the compounds studied. Quantum
chemical calculations show that all materials have high de-lithiation energies making them suitable
candidates to be used as high-voltage battery cathode materials.
Introduction
The search for new cathode materials as part of lithium-ion
batteries is an important objective today.
1–5
Currently, oxides
such as LiCoO
2
, layered Li–Mn-spinels as well as olivine-type
structures such as LiFePO
4
are in the focus of interest.
6,7
Modern
cathode materials need to fulfil many different requirements.
Promising compounds are supposed to exhibit high concentra-
tions of lithium in order to achieve high energy densities and
capacities. In addition, besides a good electronic conductivity,
sufficiently high lithium-ion diffusivity is one of the prerequisites
for facile lithium insertion and removal. Finally, chemical and
thermal stability of the components directly affect the cyclability
of the lithium-ion battery and thus its lifetime.
Until recently, various oxide materials have been in the focus
of research.
6,7
Interestingly, theoretical calculations indicate a
large increase of the redox potential by substituting fluorine for
oxygen.
8
Consequently, ternary lithium fluorides are increasingly
considered for advanced electrochemical characterization. In
particular, the Li
3
MF
6
(M ¼transition metal) family exhibits
high lithium contents combined with variable oxidation
numbers. Recently, Gonzalo et al. reported Li
3
FeF
6
to be a
promising cathode material for lithium-ion batteries.
9
Further-
more, the electrochemical properties of Li
3
VF
6
prepared by
microwave synthesis have been studied quite recently.
10a
In
addition, Li
3
VF
6
is also in the focus of a low-temperature
precipitation route in aqueous solution using alcohols recently
reported by Basa et al.
10b
The relatively low capacity of the
compounds is assumed to increase with decreasing particle size.
Therefore, the preparation of Li
3
MF
6
phases with particle sizes
less than 50 nm, as successfully shown by Basa et al.,
10b
is of great
interest to improve the associated electrochemical performance.
The compounds Li
3
MF
6
(M ¼V, Cr, Fe) are known to exist
in two polymorphs. Whereas the monoclinic form (space group
C2/c) crystallizes isotypically with b-Li
3
AlF
6
, the orthorhombic
modification crystallizes with the space group Pna2
1
being
identical to that of the corresponding a-form of Li
3
AlF
6
. The
two polymorphs are structurally related to the cryolite type.
11,12
Usually, the monoclinic polymorph is obtained by slow
cooling down of a stoichiometric mixture of the binary fluorides
to room temperature, while the orthorhombic form can only be
prepared by quenching the samples from an elevated (T> 600 K)
to ambient temperature. Due to the poor electronic conductivity
of transition metal fluorides the design of particle morphology is
of great importance for potential electrochemical applications.
Since ternary transition metal fluorides are usually synthesized
by solid-state reactions at high temperatures and/or high pres-
sures, the obtained particles show diameters in the micrometer
a
Technische Universit€
at Berlin, Department of Chemistry, Straße des 17.
Juni 135, 10623 Berlin, Germany. E-mail: martin.lerch@tu-berlin.de;
Fax: +49 030 314 22740; Tel: +49 030 314 22603
b
Technische Universit€
at Graz, Institut f€
ur Chemische Technologie von
Materialien, Stremayrgasse 9, 8010 Graz, Austria. E-mail: wilkening@
tugraz.at; Fax: +43 316 873 32332; Tel: +43 316 873 32330
c
Universit€
at Bonn, Mulliken Center for Theoretical Chemistry, Department
of Physical and Theoretical Chemistry, Beringstr. 4, 53115 Bonn,
Tel: +49 0228 73 3839
d
Humboldt-Universit€
at zu Berlin, Department of Chemistry, Brook-
Taylor-Straße 2, 12489 Berlin, Germany. E-mail: erhard.kemnitz@
chemie.hu-berlin.de; Fax: +49 030 2093 7277; Tel: +49 030 2093 7555
e
Leibnitz Universit€
at Hannover, Insitute of Phyiscal Chemistry and
Electrochemistry, Callinstr. 3 – 3a, 30167 Hannover, Germany. E-mail:
† CCDC 868968. For crystallographic data in CIF or other electronic
format see DOI: 10.1039/c2jm32133e
This journal is ªThe Royal Society of Chemistry 2012 J. Mater. Chem., 2012, 22, 15819–15827 | 15819
Dynamic Article LinksC
<
Journal of
Materials Chemistry
Cite this: J. Mater. Chem., 2012, 22, 15819
www.rsc.org/materials PAPER
Published on 05 July 2012. Downloaded by TU Berlin - Universitaetsbibl on 30/03/2016 14:15:57.
View Article Online
/ Journal Homepage
/ Table of Contents for this issue

range. Generally, nm-sized particles can be easily prepared by
high-energy ball milling of the coarse grained materials.
13–15
Besides activation, mechanochemistry has also successfully been
used for the synthesis of a variety of materials from precursors at
room temperature including oxides and fluorides.
16–18
However,
in contrast to such a top-down approach, the preparation of
nanostructured particles by precipitation from aqueous solution
is much more beneficial when the shape and surface morphology
of the crystallites have also to be controlled. By following such a
route, the corresponding salts, for example nitrates or oxides, are
reacted with hydrofluoric acid and subsequent dehydration is
carried out by annealing at elevated temperatures. In general,
solution-based syntheses offer many advantages. For instance,
low temperatures and good mixing of the precursors allow the
preparation of highly homogeneous compounds with a large
surface area. In contrast to aqueous routes, syntheses carried out
in organic solvents provide a large range of different media with
versatile characteristics. When HF is dissolved directly in an
organic solvent, competing reactions between HF and H
2
O with
the transition metal can be eliminated. When, for example,
alcoholates or acetylacetonates are used as starting materials the
corresponding alcohols or acetylacetone is formed which can
easily be removed under vacuum. Moreover, due to very fast
crystallization materials consisting of very small particle
diameters (low nm-range) can be obtained.
To our knowledge only few reports can be found in the liter-
ature which report on the synthesis of ternary fluorides from
these starting materials. Kemnitz et al. presented the synthesis of
aluminum and magnesium fluorides with high surface areas by a
fluorolytic sol–gel process.
19,20
These studies illustrate the
synthetic potential of organic hydrogen fluoride solutions.
Aluminum compounds crystallizing in the cryolite or elpasolite
type were prepared from the corresponding alcoholates. For
example, Li
3
AlF
6
can be obtained via the reaction of LiOtBu and
Al(OiPr)
3
with HF in isopropanol.
21
This method allows one to
work under water-free conditions. Concerning transition metal
fluorides only acetylacetonates, acetates and, in the case of iron,
alcoholates are obtainable as starting materials. The aim of our
present work is to develop a nonaqueous sol–gel route for the
preparation of Li
3
MF
6
compounds (M ¼V, Cr, Fe, Mn, Co) and
to elucidate the possibilities of controlling the size of the particles
synthesized.
Experimental section
X-ray powder diffraction
X-ray powder diffraction experiments were performed using a
PANalytical X’Pert PRO MPD diffractometer (CuK
a
-radiation,
2qrange 5 to 120, Bragg–Brentano (q–q) geometry) with PIXcel
detector (Si–Li-semiconductor with 255 measuring channels). All
samples were prepared on small Si-cavity mounts.
X-ray fluorescence
For X-ray fluorescence analysis, a PANalytical Axios PW4400/
24 X-ray fluorescence spectrometer with an Rh-tube and wave-
length-dispersive detection was used. Depending on the analyzed
elements a LiF single crystal (crystallographic orientation (220)
and (200)), a Ge single crystal (orientation (111)), a PE single
crystal (orientation (002)) and a PX1 multi-layer mono-
chromator were used together with an Si(Li) scintillation
detector.
NMR
Liquid-phase
1
H,
13
C,
51
V, and
19
F NMR spectra were recorded
on a Bruker Avance 200 and a Bruker Avance 400 NMR spec-
trometer. TMS, CFCl
3
and VOCl
3
served as references. Solid-
state high-resolution, i.e., magic angle spinning (MAS),
6
Li and
7
Li NMR spectra were acquired using Avance III NMR (Bruker
BioSpin) spectrometers connected to cryomagnets with nominal
fields of 7 T and 14.1 T. This results in
6
Li resonance frequencies
of 44 and 88 MHz and
7
Li resonance frequencies of 117 and
233 MHz, respectively. We used a standard (double-resonance)
2.5 mm-probe (Bruker) which can be operated at spinning speeds
of up to 30 kHz. Additionally, some
6
Li MAS NMR spectra were
recorded with an Avance NMR spectrometer being connected to
a cryomagnet with a nominal magnetic field of 17.6 T. The
spectrometer can be used in combination with an MAS NMR
probe allowing a maximum spinning speed of 15 kHz. The Li
MAS NMR spectra shown were referenced to LiCl (aq). They
were recorded using a single excitation pulse and recycling delays
of up to several seconds.
6
Li and
7
Li NMR spin–lattice relaxation
times T
1
of the paramagnetic Li
3
MF
6
and Li
2
MnF
5
samples were
measured with a conventional saturation recovery experiment
using up to 12 different delay times. As expected, the T
1
values
associated with the paramagnetic shifts do not exceed 100 ms.
Preliminary 2D exchange MAS NMR spectra of Li
2
MnF
5
were
recorded using a conventional NOESY pulse sequence. Time
domains of 512 data points in both f1 and f2 directions were
used. Processing of the data was carried out using TopSpin 3.1
software (Bruker) and Mnova7 (Mestrelab research).
FTIR
FTIR spectra were measured on a Varian 640IR FTIR spec-
trometer equipped with a Pike GladiATR device for measure-
ments in attenuated total reflectance mode. FTIR spectra of KBr
pellets and CsI pellets were measured with a Nicolet Series II
Magna-IR System 750 FTIR spectrometer in transmission mode.
Elemental analysis
The carbon and hydrogen contents were determined by
combustion analysis (Thermo Finnigan FlashEA 1112 NC
analyzer), the oxygen contents using a LECO EF-TC 300 N
2
/O
2
analyzer (hot gas extraction).
Materials and methods
V(acac)
3
(ABCR), Fe(acac)
3
, Cr(acac)
3
, Mn(acac)
3
,
Mn(OAc)
3
$2H
2
O, Co(acac)
3
and LiOtBu (Sigma-Aldrich) were
used as received. Solutions of HF in ethanol, THF and Et
2
O were
prepared by feeding gaseous HF into the solvent under cooling.
The solvents were dried according to standard literature proce-
dures. All reactions were carried out using standard Schlenk
techniques. Reagents and samples were stored in an Ar-filled
glove box.
15820 | J. Mater. Chem., 2012, 22, 15819–15827 This journal is ªThe Royal Society of Chemistry 2012
Published on 05 July 2012. Downloaded by TU Berlin - Universitaetsbibl on 30/03/2016 14:15:57.
View Article Online
General synthesis
Precursor synthesis, Li
3
VF
6
as example: 1 g (2.87 10
3
mol) of
V(acac)
3
and 0.6895 g (8.61 10
3
mol) of LiOtBu (Li : V ¼
3 : 1) were weighed into a Schlenk tube and suspended in 20 ml of
absolute ethanol at room temperature for 30 min. To the resul-
tant suspension 8.40 ml of a 10.25 M HF–EtOH solution was
added leading to a green solution (V : HF ¼1 : 30). Alterna-
tively, a 6.89 M HF–Et
2
O or a 10.68 M HF–THF solution was
used. The solution was stirred for 2 h at room temperature.
Afterwards, the solvent was removed under vacuum and the
resultant fine green powder was dried at 80 C for 2 h.
Synthesis of the Li
3
MF
6
samples: all syntheses were carried out
in sealed copper or monel capsules under nitrogen atmosphere.
100 to 200 mg of the precursor were filled into a one-side sealed
capsule. If not stated otherwise, all samples were slowly cooled
down to room temperature. In Table 1, the synthesis conditions
of the fluorides prepared are listed.
V(acac)
2
(CH
3
CN)
2
BF
4
: a saturated solution of the Li
3
VF
6
precursor was prepared in 10 ml of absolute CH
3
CN and stirred
overnight at 50 C. The resulting green-brown solution was filled
in small glass tubes. These glass tubes were positioned in a
Schlenk tube filled with 20 ml of absolute Et
2
O. After approxi-
mately 20 days dark red crystals were formed.
Results and discussion
Monoclinic and orthorhombic Li
3
VF
6
As described in the Experimental section, Li
3
VF
6
can be
prepared by a two-step synthesis. During the first step the so-
called precursor is synthesized. LiOtBu and V(acac)
3
react with
hydrogen fluoride in a dry solvent (Li : V : HF ¼3 : 1 : 30).
After evaporating the solvent and drying, the obtained Li
3
VF
6
precursor is calcined at 300 to 800 C to form Li
3
VF
6
. The
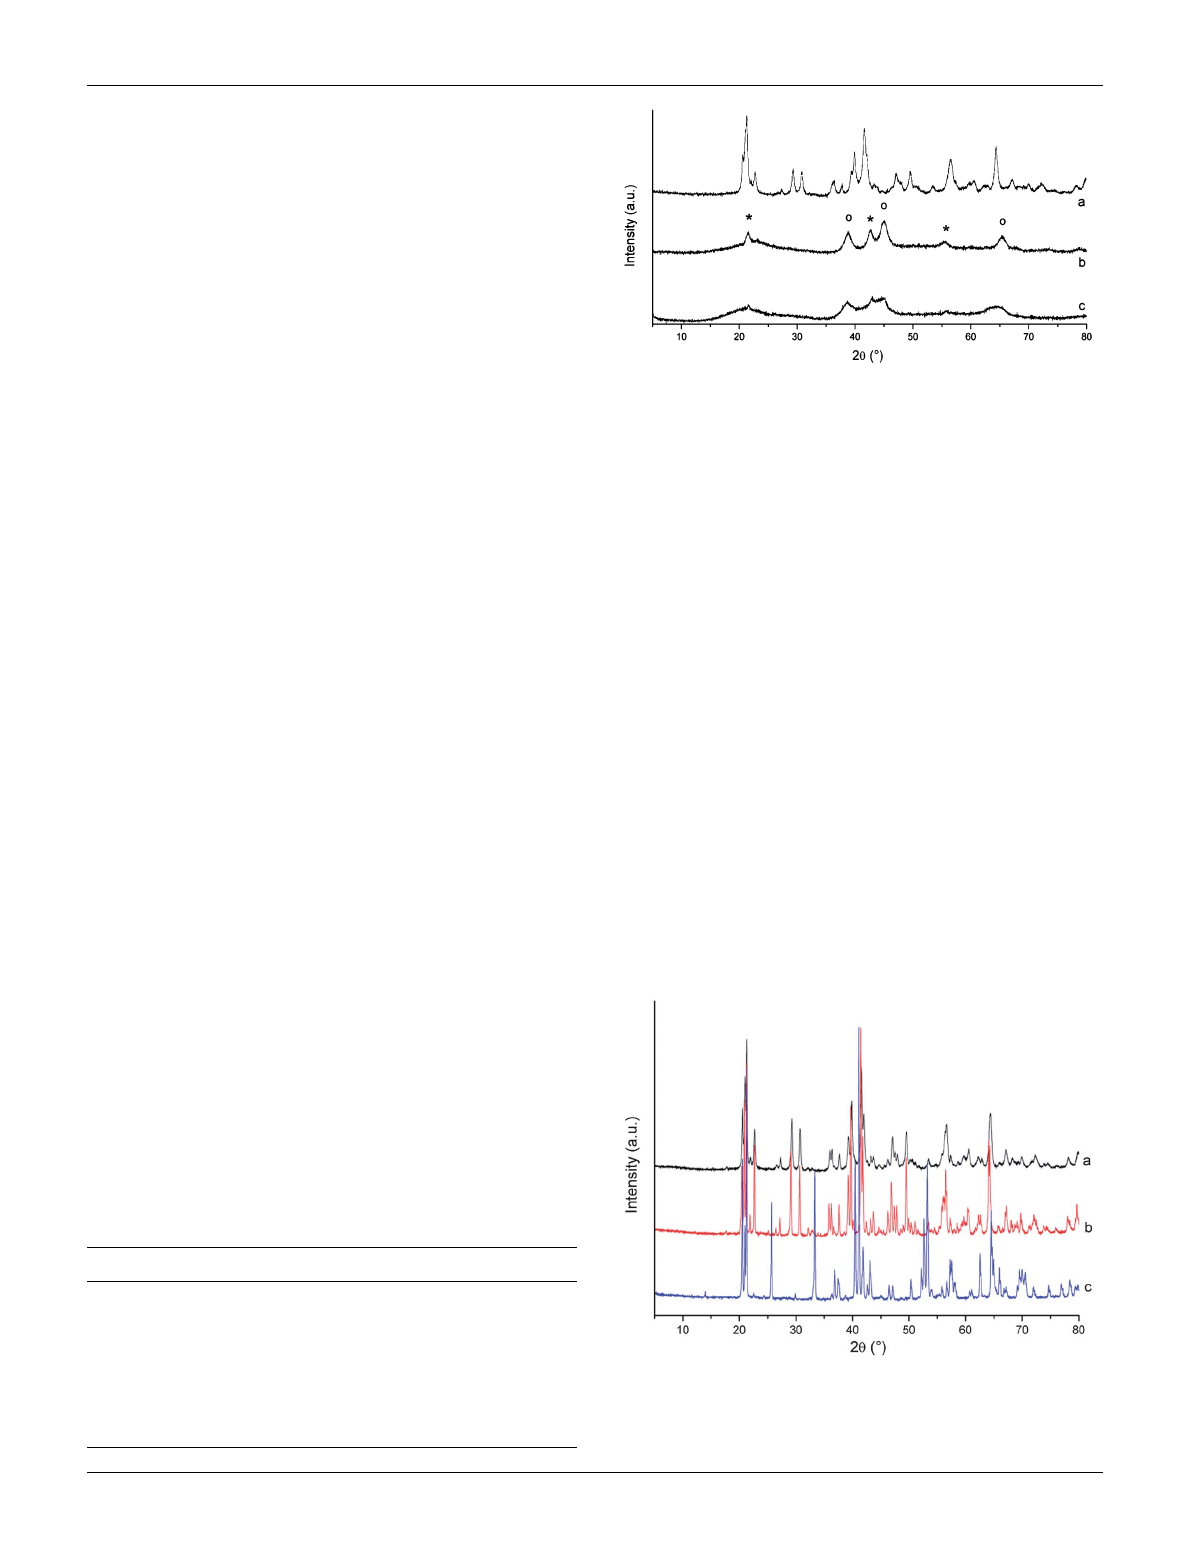
precursor can be described as a fine, green and mainly X-ray
amorphous powder. The corresponding X-ray powder pattern
shows that the precursor also contains poorly crystalline LiF and
Li
2
SiF
6
. The latter phase results from the reaction of HF with the
glassware used. However, Li
2
SiF
6
does not affect the subsequent
reactions because it decomposes into LiF and SiF
4
at tempera-
tures above 250 C.
22
As determined by X-ray fluorescence
analysis, all samples contain approximately 3 to 4.5% Si. Inter-
estingly, small amounts of Li
2
SiF
6
were also formed when the
synthesis was carried out in a glass Schlenk tube equipped with a
closed PTFE insert inside (Fig. 1b and c). This insert was opened
after synthesis for removing the solvent under vacuum.
Surprisingly, remaining HF seems to react immediately with the
glassware in which the PTFE tube is inserted. Note that from
X-ray diffraction no information on the nature of the vanadium
species can be obtained.
Li
3
VF
6
, which was prepared by decomposition of the
precursor, was also analyzed by X-ray powder diffraction.
Heating to 300 C leads to the formation of Li
3
VF
6
.Li
2
SiF
6
seems to be completely decomposed (see also Fig. 1a). From the
XRD patterns there are only vague indications of very small
amounts of remaining LiF not reacted with vanadium species of
the precursor. When the samples were cooled down to room
temperature slowly, monoclinic Li
3
VF
6
was observed. Heating
the precursor to 700 C and quenching the sample to room
temperature results in the formation of orthorhombic Li
3
VF
6
as
described in the literature (see Fig. 2). Both polymorphs were
obtained with more than 98% purity. Elemental analysis resulted
in a residual carbon content of approximately 2%.
Besides the successful preparation of highly pure a-Li
3
VF
6
and
b-Li
3
VF
6
, it is also possible to modify the domain size of the
samples prepared. For example, this can easily be achieved by
Table 1 Synthesis conditions for the Li
3
MF
6
compounds (orth. ¼
orthorhombic and mon. ¼monoclinic)
Compound Dwell time Temperature Further conditions
Li
3
VF
6
, orth. 2 h 700 C Quenching to room
temperature after 2 h
Li
3
VF
6
, mon. 4 h 150 to 600 C
Li
3
FeF
6
, orth. 2 h 800 C Quenching to room
temperature after 1 h
Li
3
FeF
6
, mon. 4 h 400 to 600 C
Li
3
CrF
6
, mon. 4 h 500 C
Li
2
MnF
5
4 h 400 C 30% Li
2
MnF
5
Fig. 1 X-ray powder diffraction patterns of different Li
3
VF
6
precursors:
(a) precursor decomposition at 300 C (Li
2
SiF
6
has been completely
decomposed), (b) synthesis in glassware, (c) synthesis with PTFE insert
(o ¼LiF, * ¼Li
2
SiF
6
).
Fig. 2 X-ray powder diffraction patterns of monoclinic b-Li
3
VF
6
synthesized at (a) 300 C and (b) 600 C. (c) Corresponding X-ray powder
pattern of orthorhombic a-Li
3
VF
6
which has been synthesized at 700 C
and by subsequent quenching to room temperature.
This journal is ªThe Royal Society of Chemistry 2012 J. Mater. Chem., 2012, 22, 15819–15827 | 15821
Published on 05 July 2012. Downloaded by TU Berlin - Universitaetsbibl on 30/03/2016 14:15:57.
View Article Online
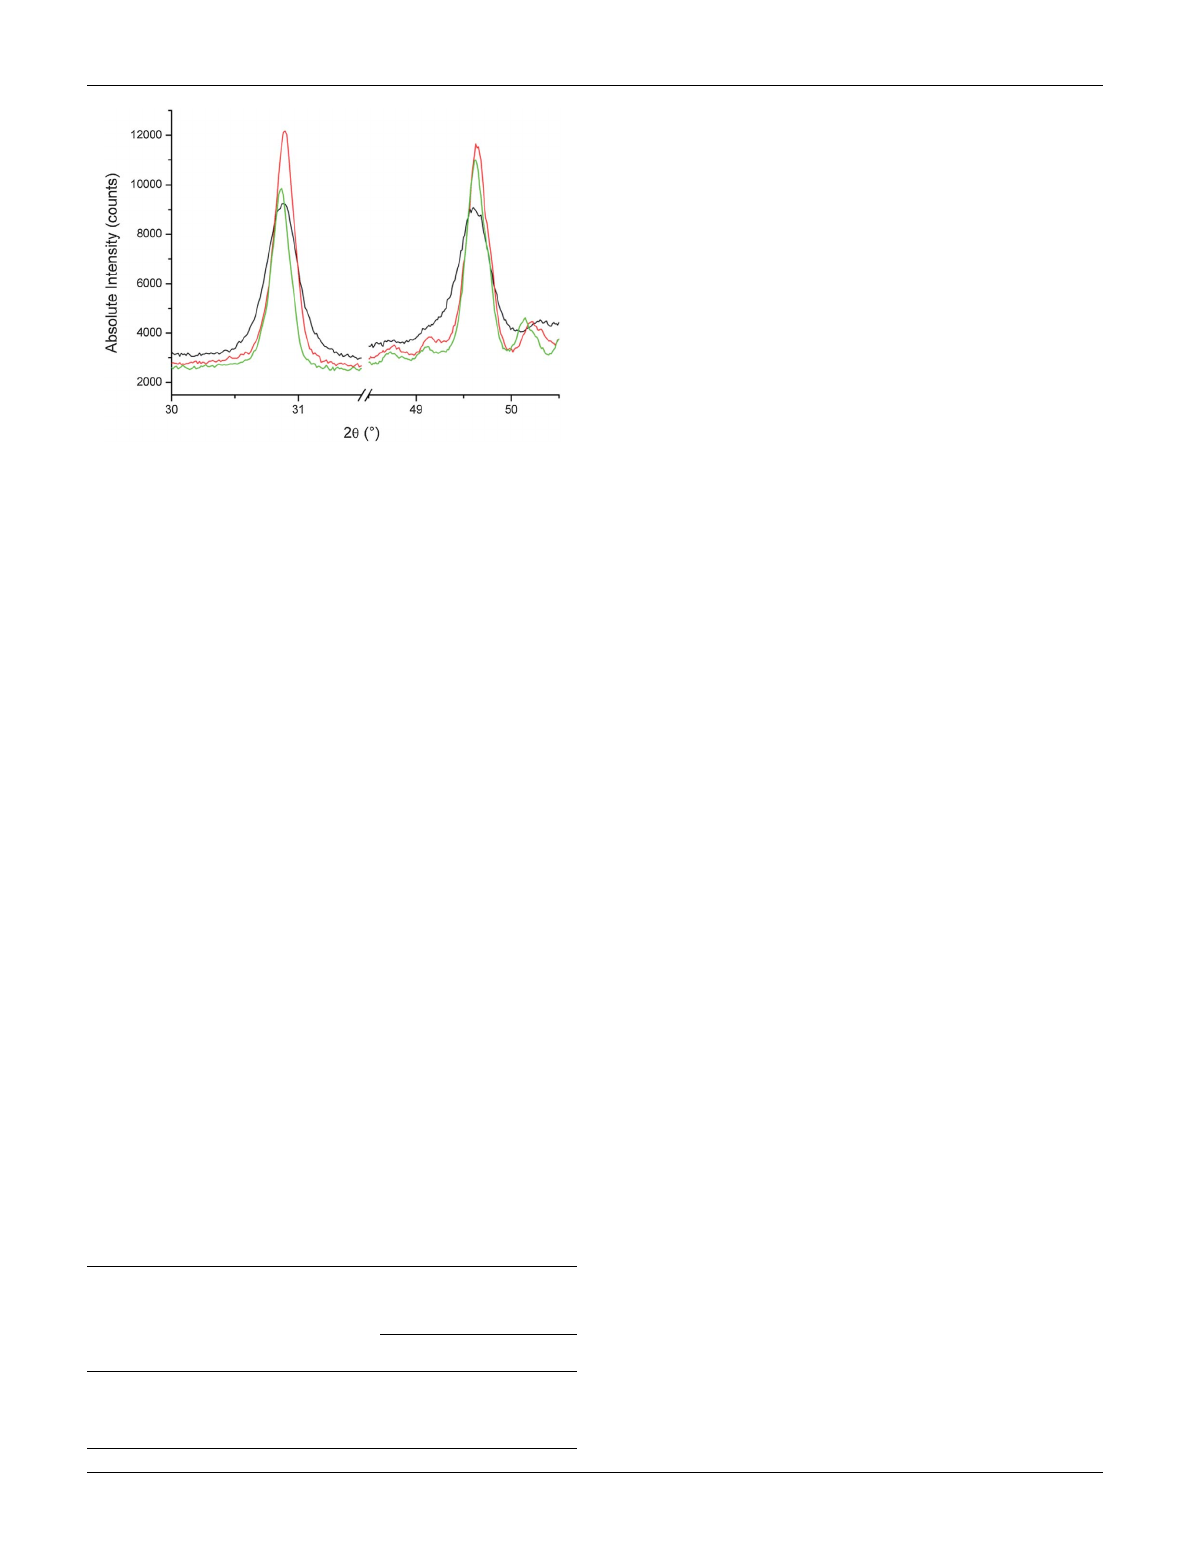
varying the synthesis temperature as presented in the following.
The precursors were heated for 4 h at 400, 500 and 600 C,
respectively. As shown in Fig. 3, the full width at half maximum
of the diffraction reflections decreases with increasing tempera-
ture. The domain sizes were calculated by methods based on the
Scherrer formula.
26
The results are depicted in Table 2. Here, the
domain size can be varied from approximately 30 to 200 nm
which is the range of interest for electrochemical applications. In
general, the domain size increases with increasing temperature.
For different solvents the absolute values as well as the temper-
ature dependence of the sizes differs significantly. The reason for
this is unclear. First investigations of the samples by means of
standard SEM resulted in an average particle size of 200 nm for
the samples synthesized at 400 C.
Typical
6
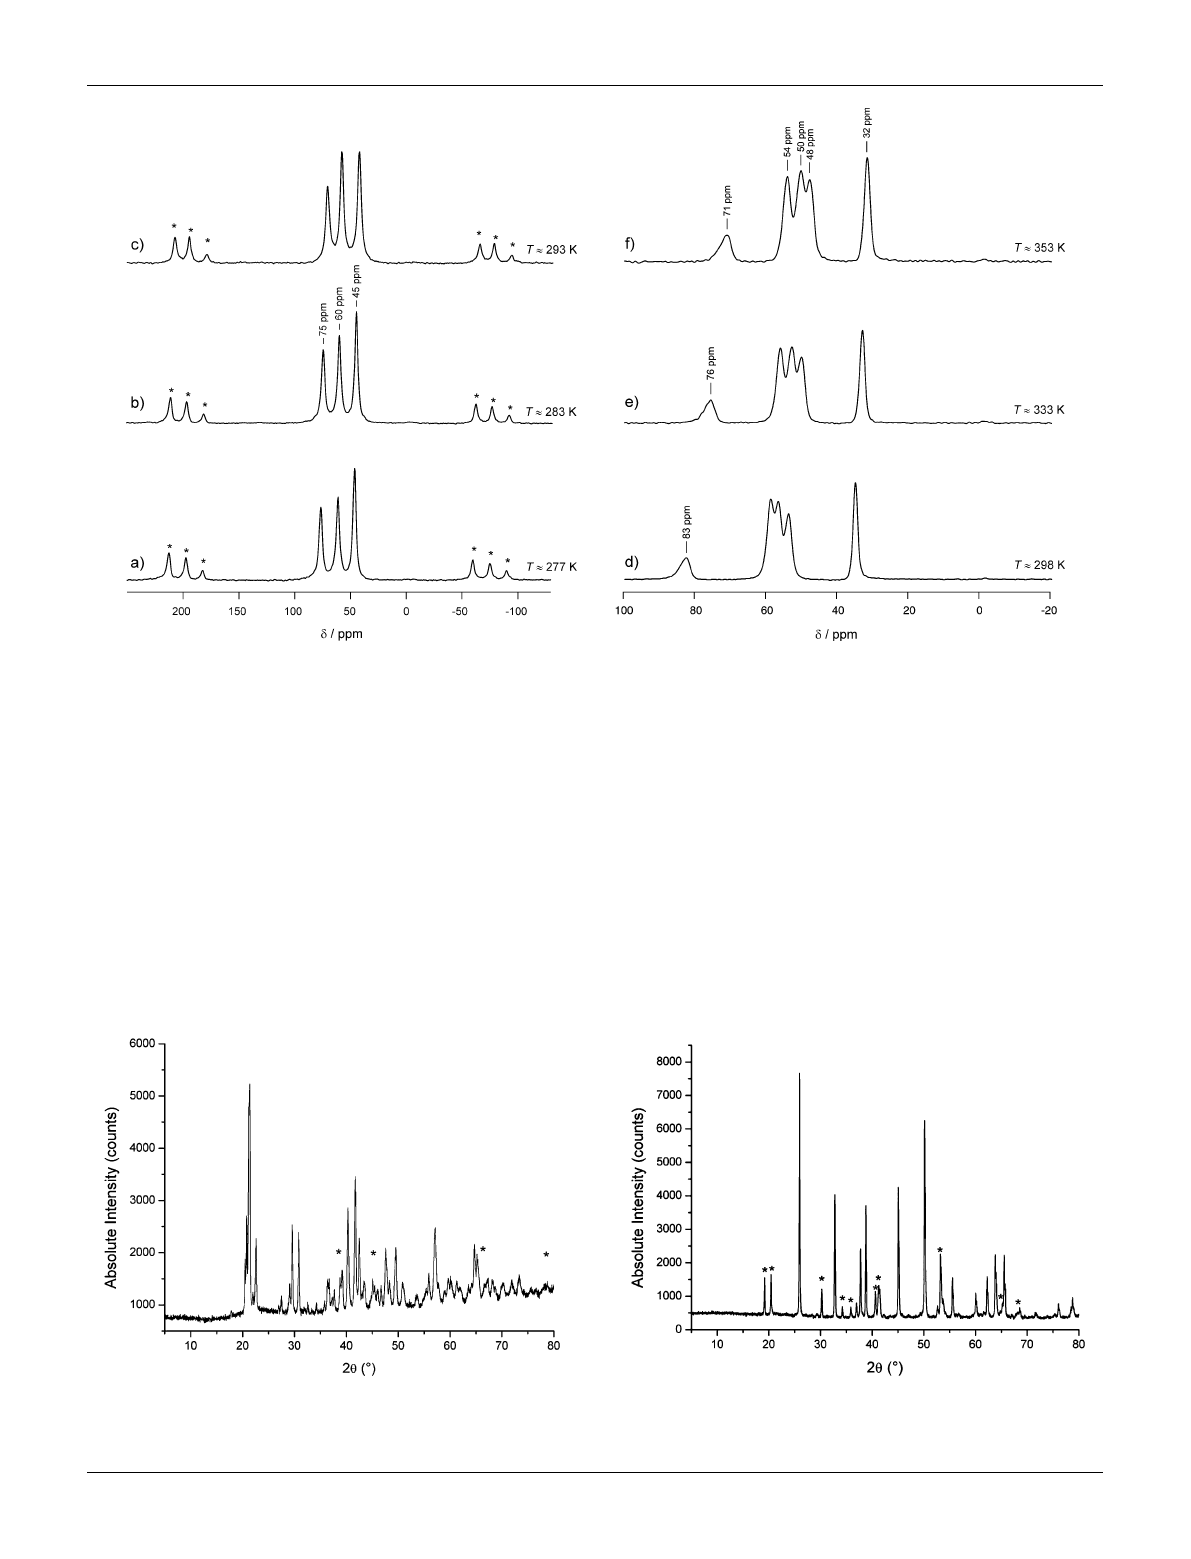
Li MAS NMR spectra of polycrystalline a-Li
3
VF
6
and b-Li
3
VF
6
are shown in Fig. 4. In agreement with the crystal
structure of the orthorhombic modification the NMR spectrum
of a-Li
3
VF
6
reveals three distinct lines which can be attributed to
the Li positions Li(1), Li(2), and Li(3) as shown recently by some
of us.
23
The NMR shifts result from the Fermi-contact interac-
tion which is related to the extent of electron spin density
transferred from the V
3+
t
2g
orbital to the 2s orbital Li ion. In ref.
23 the assignment of the NMR lines presented has been based on
(i) results from temperature-variable 1D and 2D exchange NMR
experiments, (ii) the considerations of different mechanisms to
transfer electron spin density, and (iii) the connectivities of the
VF
6
and LiF
6
polyhedra in a-Li
3
VF
6
. Note that with increasing
temperature the lines first broaden and finally coalesce because of
Li ion exchange taking place on the timescale determined by the
distance of the NMR lines (see Fig. 1 in ref. 23). The beginning of
this process can already be recognized when the spectrum shown
in Fig. 4c is considered. At lower temperatures, note that NMR
spectra down to 277 K were recorded, no additional lines show
up indicating that the three lines observed are not affected by any
coalescence phenomena occurring at lower temperatures. The
three lines detected show approximately the same intensity which
is expected from the crystal structure where the three crystallo-
graphically inequivalent Li sites, residing on the same Wyckoff
position 4a, are fully occupied.
Interestingly, the individual paramagnetic NMR shifts d
depend on temperature. A linear relationship between dand 1/T
is expected for the Curie–Weiss behavior quantifying the
dependence of the magnetic susceptibility on temperature. The
larger the paramagnetic shift the steeper the slope of the corre-
sponding d(1/T) line: see, e.g., the recent study by Spencer et al.
24
This effect can be clearly seen in Fig. 4d–f showing the
6
Li MAS
NMR spectra of the monoclinic counterpart of Li
3
VF
6
.Upto
353 K no coalescence of the NMR lines is observed.
In b-Li
3
VF
6
the Li ions occupy five crystallographically
inequivalent sites whereby Li(2), Li(3), Li(4) and Li(5) reside on
the Wyckoff position 8f and Li(1) on 4e. Since all the sites are
fully occupied one might ascribe the NMR signal with the lowest
intensity and the largest paramagnetic shift (76 ppm at 333 K) to
the Li(1) ions. The asymmetric shape of this NMR peak might
indicate that the signal is composed of more than one line, i.e.,
the ions residing on the position 4e are crystallographically
equivalent but not magnetically so. The assignment of the other
NMR peaks, which do not differ in intensity as expected from the
crystal structure, requires mixing time dependent 2D exchange
NMR experiments and a careful analysis of the relevant transfer
mechanisms of electron spin density. Such a study is beyond the
scope of the present contribution and will be published elsewhere
together with an investigation of the Li hopping processes taking
place in b-Li
3
VF
6
. First results were shown in ref. 25. Comparing
the 1D
6
Li MAS NMR spectra shown in ref. 23 with those
obtained from a-Li
3
VF
6
and presented in Fig. 4, it is already
evident that Li jump diffusion in the monoclinic modification is
slower than that in the orthorhombic form. Interestingly, our
quantum-chemical calculations show (vide infra) that the
monoclinic modification is found to be more stable than
the orthorhombic one which reveals rapid Li exchange among
the three regularly occupied crystallographic positions (in
particular, see Fig. 2 in ref. 23).
Li
3
MF
6
(M ¼Cr, Fe, Co) and Li
2
MnF
5
The preparation of the corresponding compounds containing
chromium, iron, and manganese was performed in analogy to
that of Li
3
VF
6
. Unfortunately, and in contrast to Li
3
VF
6
, which
can be synthesized with high yields, the designated products
could not be prepared as single-phase powders. During the
synthesis of the precursor, the formation of larger quantities of
the corresponding difluorides occurs. For the preparation of a
Li
3
FeF
6
-precursor, Fe(acac)
3
and Fe(OEt)
3
were tested in
Fig. 3 Temperature-dependent broadening of the reflections at 2q¼
30.72and 2q¼49.45of monoclinic Li
3
VF
6
(400 C (black), 500 C
(red), 600 C (green)). All samples were slowly cooled down to room
temperature.
Table 2 Calculated domain sizes for monoclinic Li
3
VF
6
prepared at
different temperatures. The values listed were calculated with LaB
6
as
standard. The respective precursors were synthesized in different solvents
Decomposition temperatures
and corresponding
domain sizes
400 C 500 C 600 C
Li
3
VF
6
, precursor synthesized in THF 37 nm 107 nm 127 nm
Li
3
VF
6
, precursor synthesized in Et
2
O 33 nm 84 nm 160 nm
Li
3
VF
6
, precursor synthesized in EtOH 44 nm 80 nm 155 nm
15822 | J. Mater. Chem., 2012, 22, 15819–15827 This journal is ªThe Royal Society of Chemistry 2012
Published on 05 July 2012. Downloaded by TU Berlin - Universitaetsbibl on 30/03/2016 14:15:57.
View Article Online
different solvents. Tempering of the obtained orange powder at
400 C always resulted in a mixture of monoclinic Li
3
FeF
6
as well
as LiF and FeF
2
. The orthorhombic modification of Li
3
FeF
6
was
also obtained with only a 50% yield. In the case of M ¼Cr,
monoclinic Li
3
CrF
6
could be obtained with approximately 85%
purity. The precursor was prepared from LiOtBu, Cr(acac)
3
and
a HF–EtOH solution (see Fig. 5). Unfortunately, by using
LiOtBu/Co(acac)
3
/HF, Co
3+
was completely reduced to Co
2+
and only LiF and CoF
2
were formed. Surprisingly, in the system
Li–Mn–F the formation of Li
2
MnF
5
was observed. Mn(acac)
3
and Mn(OAc)
3
$2H
2
O were used as starting materials. MnF
2
was
already formed during the synthesis of the precursor. The vari-
ation of the reaction time to prepare the precursor turned out to
have no effect on the amount of MnF
2
formed. Interestingly,
Li
2
MnF
5
with a maximum yield of 30% was only formed by
decomposing the precursor synthesized from Mn(OAc)
3
$2H
2
O
(Fig. 6). Precursors synthesized from Mn(acac)
3
yielded only
MnF
2
and LiF after decomposition. Compared to conventional
solid-state routes reported in the literature, which require
temperatures ranging from 700 to 800 C,
27
the two-step
synthesis route followed here allows the preparation of Li
2
MnF
5
at temperatures as low as 400 C.
Fig. 4
6
Li MAS NMR spectra of a-Li
3
VF
6
(a–c), 12 kHz spinning speed and b-Li
3
VF
6
(d–f), 30 kHz spinning speed recorded at the temperatures
indicated. Spectra have been referenced to aqueous LiCl. Note that in each case the number of NMR signals detected is in agreement with the
crystallographic data of the two polymorphs. The temperature dependence of the NMR shifts points to Curie–Weiss behaviour as expected.
Fig. 5 X-ray powder diffraction pattern of monoclinic Li
3
CrF
6
prepared at 500 C. The sample was slowly cooled down to room
temperature (* ¼LiF).
Fig. 6 X-ray powder pattern of Li
2
MnF
5
(*). The sample was prepared
at 400 C from Mn(OAc)
3
$2H
2
O. Other products found are LiF and
MnF
2
.
This journal is ªThe Royal Society of Chemistry 2012 J. Mater. Chem., 2012, 22, 15819–15827 | 15823
Published on 05 July 2012. Downloaded by TU Berlin - Universitaetsbibl on 30/03/2016 14:15:57.
View Article Online
Loading more pages...