materials
Article
Optimization of Manufacturing Parameters and Tensile
Specimen Geometry for Fused Deposition Modeling (FDM)
3D-Printed PETG
Arda Özen 1,* , Dietmar Auhl 1, Christina Völlmecke 2, Josef Kiendl 3and Bilen Emek Abali 4
Citation: Özen, A.; Auhl, D.;
Völlmecke, C.; Kiendl, J.; Abali, B.E.
Optimization of Manufacturing
Parameters and Tensile Specimen
Geometry for Fused Deposition
Modeling (FDM) 3D-Printed PETG.
Materials 2021,14, 2556. https://
doi.org/10.3390/ma14102556
Academic Editor: Antonino Recca
Received: 17 April 2021
Accepted: 5 May 2021
Published: 14 May 2021
Publisher’s Note: MDPI stays neutral
with regard to jurisdictional claims in
published maps and institutional affil-
iations.
Copyright: © 2021 by the authors.
Licensee MDPI, Basel, Switzerland.
This article is an open access article
distributed under the terms and
conditions of the Creative Commons
Attribution (CC BY) license (https://
creativecommons.org/licenses/by/
4.0/).
1Chair of Polymer Materials Science and Technologies, Institute of Material Science and Technology,
2Stability and Failure of Functionally Optimized Structures Group, Institute of Mechanics,
3Department of Civil Engineering and Environmental Sciences, Institute of Engineering Mechanics and
Structural Analysis, Universität der Bundeswehr München, Werner-Heisenberg-Weg 39,
85577 Neubiberg, Germany; josef.kiendl@unibw.de
4Division of Applied Mechanics, Department of Materials Science and Engineering, Uppsala University,
*Correspondence: ar[email protected]
Abstract:
Additive manufacturing provides high design flexibility, but its use is restricted by limited
mechanical properties compared to conventional production methods. As technology is still emerg-
ing, several approaches exist in the literature for quantifying and improving mechanical properties.
In this study, we investigate characterizing materials’ response of additive manufactured structures,
specifically by fused deposition modeling (FDM). A comparative analysis is achieved for four differ-
ent tensile test specimens for polymers based on ASTM D3039 and ISO 527-2 standards. Comparison
of specimen geometries is studied with the aid of computations based on the Finite Element Method
(FEM). Uniaxial tensile tests are carried out, after a careful examination of different slicing approaches
for 3D printing. We emphasize the effects of the chosen slicer parameters on the position of failures
in the specimens and propose a simple formalism for measuring effective mechanical properties of
3D-printed structures.
Keywords:
additive manufacturing; 3D printing; mechanics; slicing approach; polymers; finite
element method
1. Introduction
Additive manufacturing is a production process relying on building structures layer-
by-layer by utilizing the following strategy. First, the computer-aided design (CAD) of
a structure is created by a design software. Second, this CAD model is converted by
software, called a slicer, to a 3D printing code, where process information is supplied for
manufacturing [
1
,
2
]. This strategy is taken for granted and used in different branches of the
industry, such as automotive, aeronautics, and biomechanical [
3
,
4
], as well as in research,
especially for studying metamaterials [
5
–
7
]. Additive manufacturing processes, according
to ISO/ASTM52900-15, are categorized in one of the following seven groups: material
extrusion, material jetting, binder jetting, sheet lamination, vat photopolymerization,
powder bed fusion, and directed energy deposition [8–10].
Fused deposition modeling (FDM) is an additive manufacturing method based on
materials extrusion [
1
]. For thermoplastic polymers in the form of spools of filaments,
one filament is pushed through a nozzle at slightly over the melting temperature. In this
way, the layer is deposited as a viscous fluid, solidifying by decreasing its temperature
under convective heat transfer on the surface. This procedure is repeated layer-by-layer,
allowing almost any shape. Properties and the final quality depends on material chem-
istry [
11
], as well as chosen process parameters in manufacturing [
12
,
13
]. Affected by
Materials 2021,14, 2556. https://doi.org/10.3390/ma14102556 https://www.mdpi.com/journal/materials

Materials 2021,14, 2556 2 of 19
the layer-by-layer production, an inner structure occurs in the final product, leading to
structure-related anisotropic properties [
14
,
15
], as well as higher-order (so-called size)
effects [
16
–
18
]. Estimating mechanical behavior of materials is of interest especially re-
garding production parameters [
19
,
20
] and used algorithms for depositing layers. For the
mechanical characterization of parts manufactured by the FDM, no standard methods are
established [21,22].
Ample studies have been done for modeling polymers manufactured by the FDM.
Among others, structurally dependent elasto-plastic behavior has been modeled [
23
]. The-
oretical models are proposed for determining tensile strength and Young’s modulus with
different raster angles and layer thicknesses [
24
]. Different length scales and their inter-
actions have been investigated—mainly based on the classical laminate theory (CLT) [
25
].
However, the classical laminate theory uses assumptions with limited validity for FDM,
such as perfect bonding [
26
]. Some FDM materials are compared by performing tensile
experiments [
27
]. Even differences between characterization methods for polymers (ten-
sile testing) are investigated [
28
]. Effects of different tensile test specimen geometries
taken from ASTM D638 (Standard Test Method for Tensile Properties of Plastics) on the
anisotropy have been studied regarding processing parameters, such as the raster pattern,
print orientation, and tensile specimen dimensions [
29
]. Layer thickness and build ori-
entation are analyzed by tensile, flexural, and impact tests [
30
]. Polymer composites for
FDM are proposed and characterized with polypropylene (PP) and natural fibers, such as
hemp (Cannabis sativa) or harakeke (Phormium tenax) [
31
]. Different layer orientations of
acrylonitrile butadiene styrene (ABS) polymer [
32
] demonstrate increased tensile strength
along fibers in the FDM [
33
]. It is not only layer thickness, but also orientation angle and air
gap that affects the mechanical properties of polymers greatly [
34
]; this phenomenon has
been identified [
35
], and for details we refer to [
19
]. A correlation between 3D-printing time
and dimensional accuracy is established by parameter optimization [
36
]. For achieving
high visual quality and fast 3D printing, the slicing algorithm is optimized [
37
]. The effect
of printing time on mechanical properties of FDM 3D-printed Poly(Lactic Acid) (PLA)[
38
]
and PLA/Graphene composites are investigated [39].
Determination of material properties by using a uniaxial tensile test is challenging
in 3D-printed materials. ASTM D638 is designed for plastics, but the suggested design
(topology) causes a premature fail [
14
]. Moreover, a standard feature called infill pat-
terns manipulates the materials’ response, owing to an inner substructure [
40
–
42
]. This
substructure-related response deviation is examined in Polylactic Acid (PLA) parts with
five different infill patterns [
43
]. Additionally, other process parameters, such as raster
layup, including raster angle and width, as well as contour width are investigated [
44
–
46
]
for their effects on the toughness and strength leading to interlocking mechanisms [
47
].
Build orientation, layer thickness, and feed rate are discussed on 3D-printed PLA samples
in [
48
], and layer thickness and raster angle parameters for PLA and ABS in [
49
]. In order
to model the mechanical response of additive manufactured polymers [
50
–
52
], well-known
homogenization techniques are used in composite materials [
53
], for example by using a
variation of carbon-fiber content in thermoplastic matrix-based composites built by the
FDM [
54
] and also for identifying substructure-related anisotropic properties [
55
] to be
used in computations [56,57].
As we aim for developing a consistent approach for characterizing ultimate tensile
strength under uniaxial loading, we emphasize the importance of the selected specimen
topology, as well as the process parameters in slicer settings. We study and demonstrate
how to obtain adequate repeatability, and thus consistent material parameters. In order to
determine the materials’ response, ASTM D638 and ISO 527-2 (determination of tensile
properties for molding and extrusion plastics) have been utilized, where some problems
were reported [
14
,
31
,
45
] as mainly being effected by prescribed curvatures in the specimen
structures and being very challenging to manufacture in 3D printers. As a remedy, ASTM
D3039 (Standard Test Method for Tensile Properties of Polymer Matrix Composite Mate-
rials) was suggested [
14
,
25
,
58
]. We stress that these issues are partly because of process
Materials 2021,14, 2556 3 of 19
parameters, and examine different tensile test specimen geometries experimentally, as well
as numerically, by Finite Element Method (FEM)-based simulations. Four different speci-
men configurations have been prepared, namely, two from ASTM D3039 and two based
on ISO 527-2. Reliable results with a low standard deviation are obtained by “fine-tuning”
the process parameters and modifying the specimen structure, nevertheless still using the
suggested ISO standard.
2. Materials and Methods
Four different tensile specimen geometries were investigated: ASTM D3039, ASTM
D3039 angle, ISO 527-2, and ISO-modified (based on ISO 527-2). The specimen specifica-
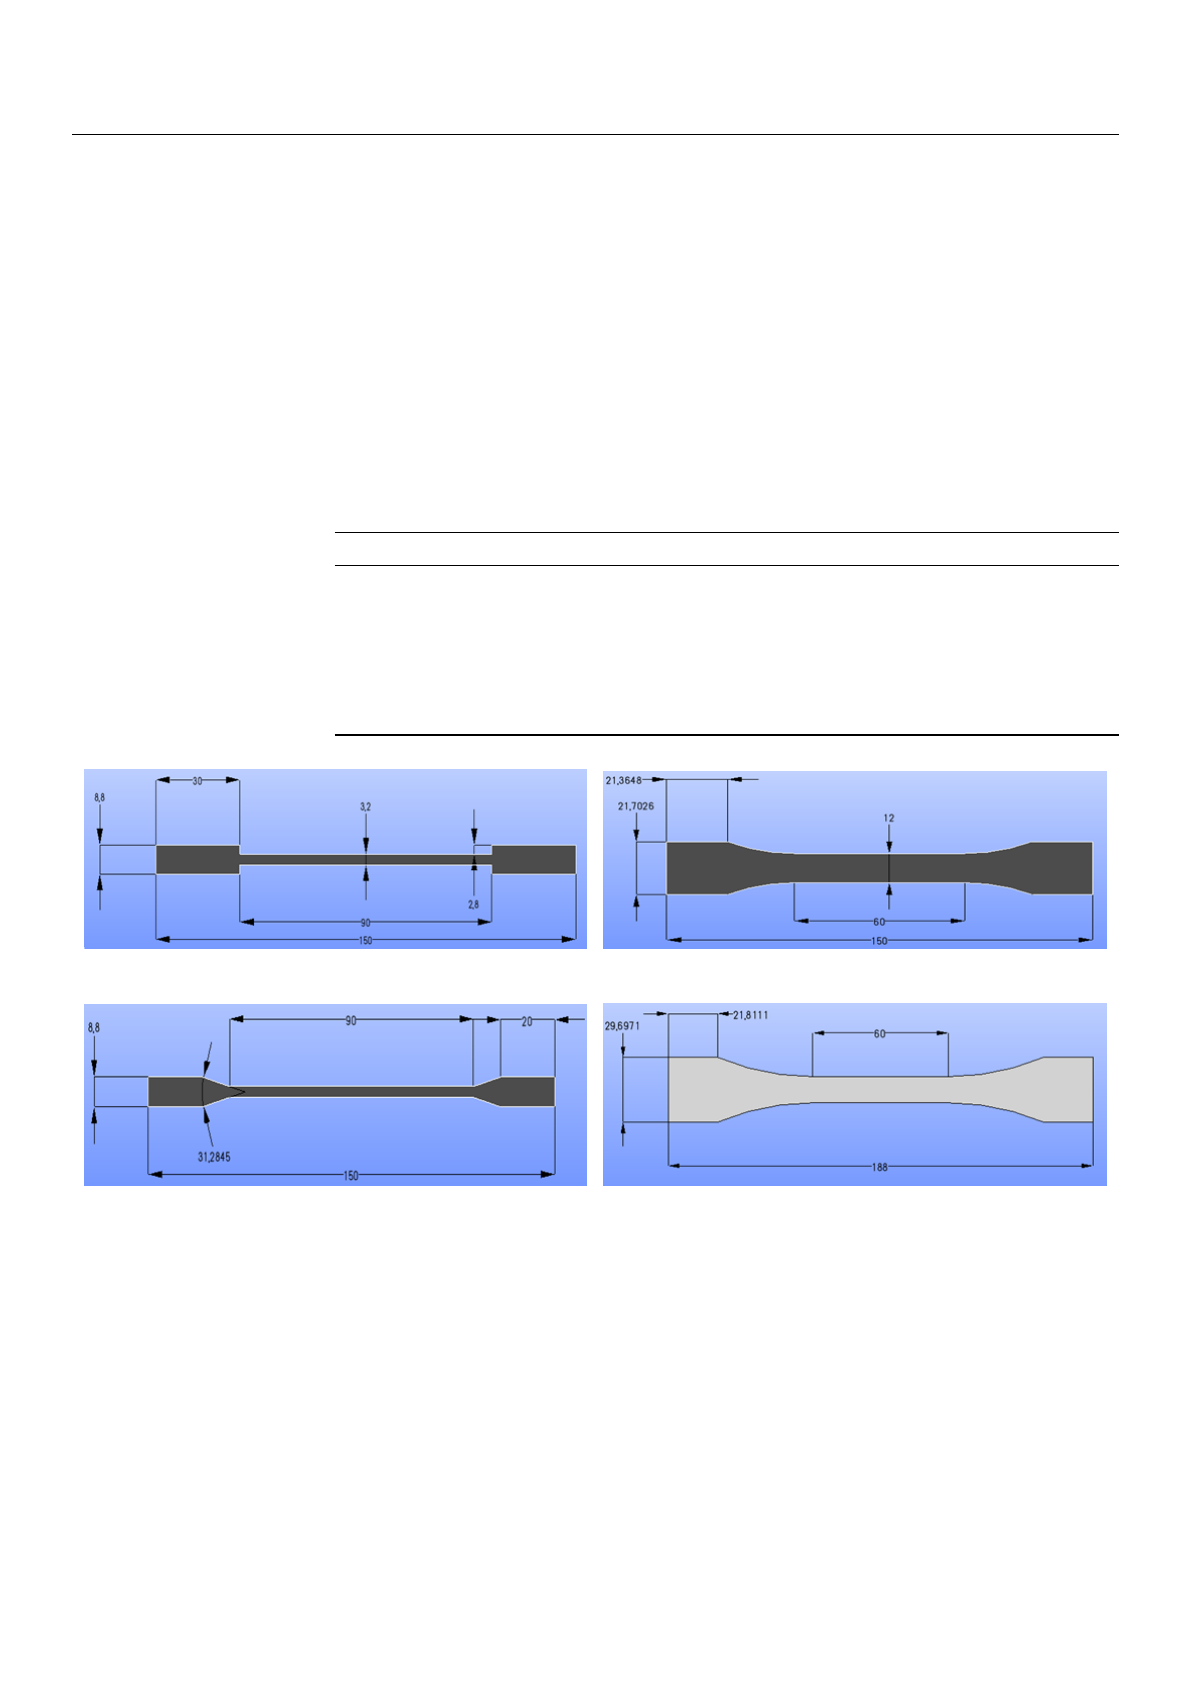
tions are compiled in Table 1and their drawings are depicted in Figure 1.
Table 1. Specimen specifications.
Description ASTM D3039 ASTM D3039 Angle ISO527-2 ISO-Modified
Tab length in mm 30 20 21.4 21.8
Tab thickness in mm 2.8 2.8 - -
Thickness in mm 3.2 3.2 6 6
Length in mm 150 150 150 188
Width in mm 15 15 21.7 29.7
Gauge length in mm 90 90 60 60
Angle - 31.28° R60 R105
(a) (b)
(c) (d)
Figure 1.
Tensile test specimen geometries and their specifications in mm: (
a
) ASTM D3039; (
b
) ISO527-2; (
c
) ASTM D3039
angle and (d) ISO-modified.
2.1. Fused Deposition Modeling
The samples were produced by an FDM-type 3D printer, namely Ultimaker 3 Extended
(Ultimaker B.V., Geldermalsen, The Netherlands). White-PETG filaments were purchased
from Materials4Print GmbH & Co. KG (Bad Oeynhausen, Germany). The tensile specimens’
CAD models were achieved in open-source platform Salome 9.3 and exported as stl files
leading to G-codes prepared by Ultimaker Cura 4.3.0 (Ultimaker B.V., Geldermalsen, The
Netherlands) with the aid of selecting process parameters, such as slicing speed, layer
thickness, temperature, and so forth. These parameters are of utmost importance, and we
provide them in Table 2.

Materials 2021,14, 2556 4 of 19
Table 2. Process parameters of 3D printing.
Parameter Value Unit
Layer thickness 0.3 mm
Layer width 0.4 mm
Print speed 55 mm/s
Initial layer speed 40 mm/s
Print acceleration 4000 mm/s2
Printing temperature 250 °C
Printing temperature initial layer 255 °C
Final printing temperature 240 °C
Bed temperature 70 °C
All specimens were printed layer-by-layer by choosing the maximum possible filling.
All contours are avoided in 3D printing in order to eliminate any destruction of the
unidirectional structure. All layers were unidirectional with 0
°
orientation. For printing the
structures, we used line patterns. We emphasize that the fiber is used in the jargon of FDM
denoting the 3D-printed line pattern. The line pattern steers the layers and thus generates
fibers. These fibers were not connected to the endpoints—the connecting infill lines setting
was off, because it could destruct the unidirectionality. The material properties of PETG
used for printing are given in Table 3. We assume that these parameters (supplied by the
manufacturer) are determined by using an injection mold specimen such that the porosity
is expected to be nearly zero (ideal case). In FDM, between filaments, depending on the
parameters, voids occur, leading to a porous structure. Hence, the values supplied by the
manufacturer are understood as an upper threshold of “effective” parameters obtained
from the specimens printed by FDM-based manufacturing.
Table 3. Material properties of PETG.
Value Unit Method
Mass density 1.27 g/cm3ASTM D792
Elongation at break 70 % ASTM D638
Tensile strength at break 26 MPa ASTM D638
Flexural modulus 2150 MPa ASTM D790
Melting point 200 −230 °C ASTM D3418
Heat distortion temperature 74 °C ASTM D648
2.1.1. Slicing Approach
By selecting default settings in the slicer, we observed problems in producing a
unidirectional (UD) structure. Hence, we propose two particular changes: development of
new travel paths and optimization of slicing sequences.
Optimization of Excess Travel Paths
Travel settings are one of the key process parameters in slicer settings. We demonstrate
how to adjust these settings for the uniaxial tensile specimen of a UD structure in order
to prevent any excess travel lines in specimens. Excess travel lines may cause premature
failures, leading to stress concentrations as observed in experiments. In order to make
the role of this parameter obvious, we start off with the default travel configuration in
Cura (slicer). In default, the slicer tries to minimize the print time such that the continuous
production may end up with additional (excess) layers deposited while the nozzle travels.
These travel lines are pathways for the nozzle so as to reach a specific position. The default
configuration in Cura is generating travel lines inadequate for the UD structure aimed
for uniaxial testing, and the suggested layer deposition by the default configuration is
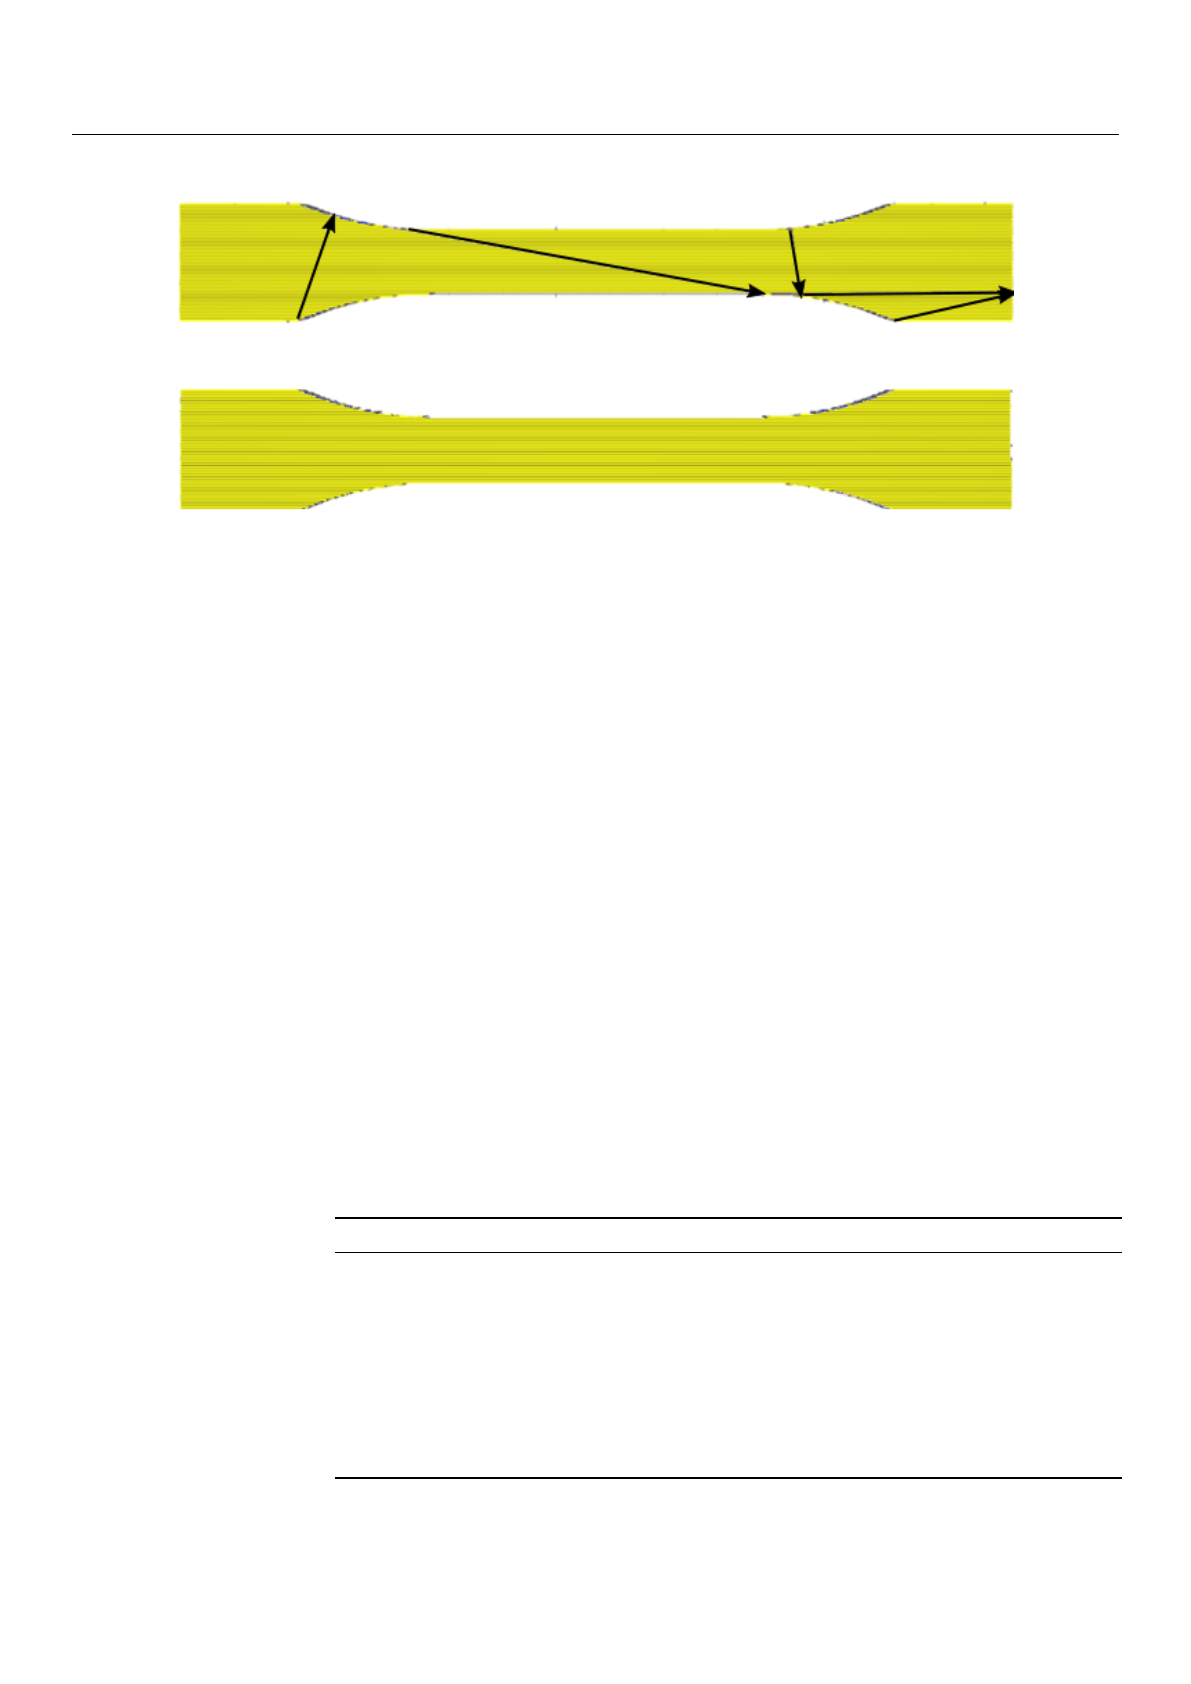
illustrated in Figure 2a, making it obvious that the UD structure is difficult to maintain.
Materials 2021,14, 2556 5 of 19
(a)
(b)
Figure 2.
Simulation of production with two travel configuration setups by using arrows visualizing the travel of the nozzle.
(
a
) Default setup with parameters from Table 4, black lines are travel lines, also depositing material, indicating weak points
in the specimen. (b) Optimized setup, the travel lines are along the outer surface of the specimen.
Mostly, a standard configuration is obtained by an algorithm optimizing speed or
weight. Resulting inner travel lines disturb the aimed for UD structure. Several specimens
are manufactured simultaneously in one production run; therefore, inner travel lines
are different in each specimen, making a comparative analysis unreliable. Moreover, as
seen in Figure 2a, the black lines indicate that the nozzle introduces weak spots within
the specimen, and along these inner travel lines, we expect a stress localization and a
premature failure of the structure. Obviously, such a failure is not representative of the
material itself. An optimized set of settings, specifically for the UD structure, is compiled
in Table 4for establishing a new travel path approach.
Optimization of Slicing Sequence
By considering the production time as well, we have succeeded in defining a new
configuration setup with parameters given in Table 4that substantially increases the inner
structure by placing travel lines to the outer contour, as demonstrated in Figure 2b. Note
that all layers should be produced by the top layer configuration except the bottom layer.
In this context, the slicing sequence means the order of the printing areas. The specimens
were printed with two different slicing approaches, called Slicing A and Slicing B. In
one process, many specimens were manufactured. Their positioning, called layout, is of
importance for the Ultimaker Cura slicing algorithm. Figure 3shows the Slicing A and
Slicing B results figuratively.
Table 4. Standard and modified travel configurations in Cura.
Parameter Standard Modified
Combining mode All Not in Skin
Max comb. distance with no retract 0 mm 100 mm
Avoid printed parts when traveling X X
Travel avoid distance 3 mm 10 mm
Layer Start X 213.0 mm 200.0 mm
Layer Start Y 198.0 mm 200.0 mm
Z hop when retracted X X
Z hop only over printed parts X X
Z hop height 2 mm 5 mm
Loading more pages...