Nanoscopic Interfacial Hydrogel Viscoelasticity Revealed from
Comparison of Macroscopic and Microscopic Rheology
Robert F. Schmidt,
⊥
Henrik Kiefer,
⊥
Robert Dalgliesh, Michael Gradzielski, and Roland R. Netz*
Cite This: Nano Lett. 2024, 24, 4758−4765
Read Online
ACCESS Metrics & More Article Recommendations *
sı Supporting Information
ABSTRACT: Deviations between macrorheological and particle-
based microrheological measurements are often considered to be a
nuisance and neglected. We study aqueous poly(ethylene oxide)
(PEO) hydrogels for varying PEO concentrations and chain lengths
that contain microscopic tracer particles and show that these
deviations reveal the nanoscopic viscoelastic properties of the
particle−hydrogel interface. Based on the transient Stokes equation,
we first demonstrate that the deviations are not due to finite particle
radius, compressibility, or surface-slip effects. Small-angle neutron
scattering rules out hydrogel heterogeneities. Instead, we show that a
generalized Stokes−Einstein relation, accounting for an interfacial
shell around tracers with viscoelastic properties that deviate from
bulk, consistently explains our macrorheological and microrheological measurements. The extracted shell diameter is comparable to
the PEO end-to-end distance, indicating the importance of dangling chain ends. Our methodology reveals the nanoscopic interfacial
rheology of hydrogels and is applicable to different kinds of viscoelastic fluids and particles.
KEYWORDS: Hydrogels, nanoparticles, diffusion, power-law rheology, viscoelasticity, interfacial rheology
Soft matter materials are generally viscoelastic, meaning that
they exhibit a viscous, elastic, or intermediate response to
external perturbations, depending on the response time. In
macrorheology, a macroscopic amount of material is deformed
by applying strain or stress, and the resulting force or
displacement response is measured, respectively.
1
A common
macrorheological technique is oscillatory shear rheology, where
the sample is subject to an oscillating shear strain and the
resulting oscillating shear stress is measured, yielding the
complex modulus G*as a function of frequency. In contrast, in
microrheology, the viscoelastic behavior of the sample is
extracted from the active or passive motion of dispersed
microscopic tracer particles.
2−4
Microrheology offers several
advantages over macrorheology, such as a smaller sample
volume, the ability to probe locally in spatially heterogeneous
samples, and access to much higher frequencies.
Ideally, one would like to combine macro- and micro-
rheological techniques and obtain the viscoelastic sample
response over a comprehensive frequency range, for which one
needs to accurately extract the viscoelastic modulus from the
tracer-particle dynamics. This is accomplished by the
generalized Stokes−Einstein relation (GSER), which connects
the macroscopic sample viscoelasticity to the frequency-
dependent friction experienced by a tracer particle.
5,6
Because
of its importance for the understanding of soft-matter
dynamics, the GSER has been the subject of numerous
experimental and theoretical investigations.
7−15
Several studies
have compared macro- and microrheological measurements on
the same sample.
5,16−19
Using the GSER for the conversion of
the microrheology data, the reported agreement of the
complex modulus G*in the overlap frequency range is
typically rather good; however, upon closer inspection, it is
evident that macro- and microrheological data exhibit
systematic deviations, in the sense that microrheology
experiments show enhanced or reduced viscoelastic response
compared to macrorheology, depending on specificities of the
sample and the tracer particles.
16,17,20
This is where our paper comes in: We show that the
experimentally determined deviations between macro- and
microrheological spectra for a synthetic polymeric hydrogel
reveal the effect of polymer−particle interactions on the
effective hydrogel viscoelasticity around the probe particles.
We employ semidilute aqueous solutions of linear poly-
(ethylene oxide) (PEO) polymers, which are hydrogels with
physical cross-links due to polymer chain entanglements
21−24
and constitute ideal model systems because of their simple
structure and reproducible properties.
16,18,25−28
We tune the
Received: December 12, 2023
Revised: April 2, 2024
Accepted: April 3, 2024
Published: April 9, 2024
Letterpubs.acs.org/NanoLett
© 2024 The Authors. Published by
American Chemical Society 4758
https://doi.org/10.1021/acs.nanolett.3c04884
Nano Lett. 2024, 24, 4758−4765
This article is licensed under CC-BY 4.0
Downloaded via TU BERLIN on May 7, 2024 at 13:49:30 (UTC).
See https://pubs.acs.org/sharingguidelines for options on how to legitimately share published articles.
PEO hydrogel viscoelasticity by changing both the PEO
concentration and chain length.
The GSER has been argued to hold for homogeneous and
incompressible samples
5,6
and in the absence of slip on the
tracer-particle surface.
29
In fact, finite compressibility of the
viscoelastic sample, slip effects and finite tracer particle size can
be exactly accounted for by the solution of the transient Stokes
equation for a viscoelastic fluid in spherical geomery,
30
but
does not explain the deviations between our macro- and
microrheology hydrogel data, as shown below. The effect of
sample inhomogeneity is more subtle: A hydrogel, i.e., a dilute
entangled polymer solution, is structurally characterized by its
mesh size.
31
For tracer particles significantly larger than the
mesh size, the hydrogel can be considered homogeneous on
the characteristic particle length scale, and the particles probe
the macroscopic hydrogel viscosity. Particles much smaller
than the mesh size can diffuse through the hydrogel meshes
and are subject to the solvent viscosity, unless they are strongly
attracted to the polymers making up the hydrogel.
32,33
The
intermediate situation, if the particle size is of the order of the
hydrogel inhomogeneity, characterized by the mesh size,
constitutes an immensely complex problem.
34,35
In our
experiments, the tracer particles are significantly larger than
the hydrogel mesh size, as determined from small-angle
neutron scattering (SANS) measurements, so we can
confidently assume that the particles probe the macroscopic
hydrogel viscoelasticity. Yet, there is another effect that
intrinsically differentiates macro- from microrheological data
and has hitherto not been studied in detail: Any tracer-particle
material will interact attractively or repulsively with the
hydrogel polymer and thereby induce polymer adsorption or
depletion.
36−38
As a consequence, the effective hydrogel
viscoelasticity in the vicinity of the particle surface will differ
from its bulk value. By using a simple shell model for the
hydrogel viscoelastic properties,
39,40
we demonstrate in this
paper that we can not only explain the commonly observed
deviation between macro- and microrheological data but also
derive the effective viscosity in the hydrogel interfacial layer
from these deviations.
■MACRORHEOLOGICAL VISCOELASTIC SPECTRA
OF PEO SOLUTIONS
Frequency sweeps on poly(ethylene oxide) (PEO) solutions,
which are viscoelastic in the semidilute regime (see Supporting
Information (SI) Section S1, for details), were performed for
varying polymer concentration cand chain length (i.e.,
molecular weight Mw) with a strain amplitude of γ0= 5%
and angular frequencies between 0.1 and 100 rad/s (see SI
Sections S2 for sample preparation and S3 for experimental
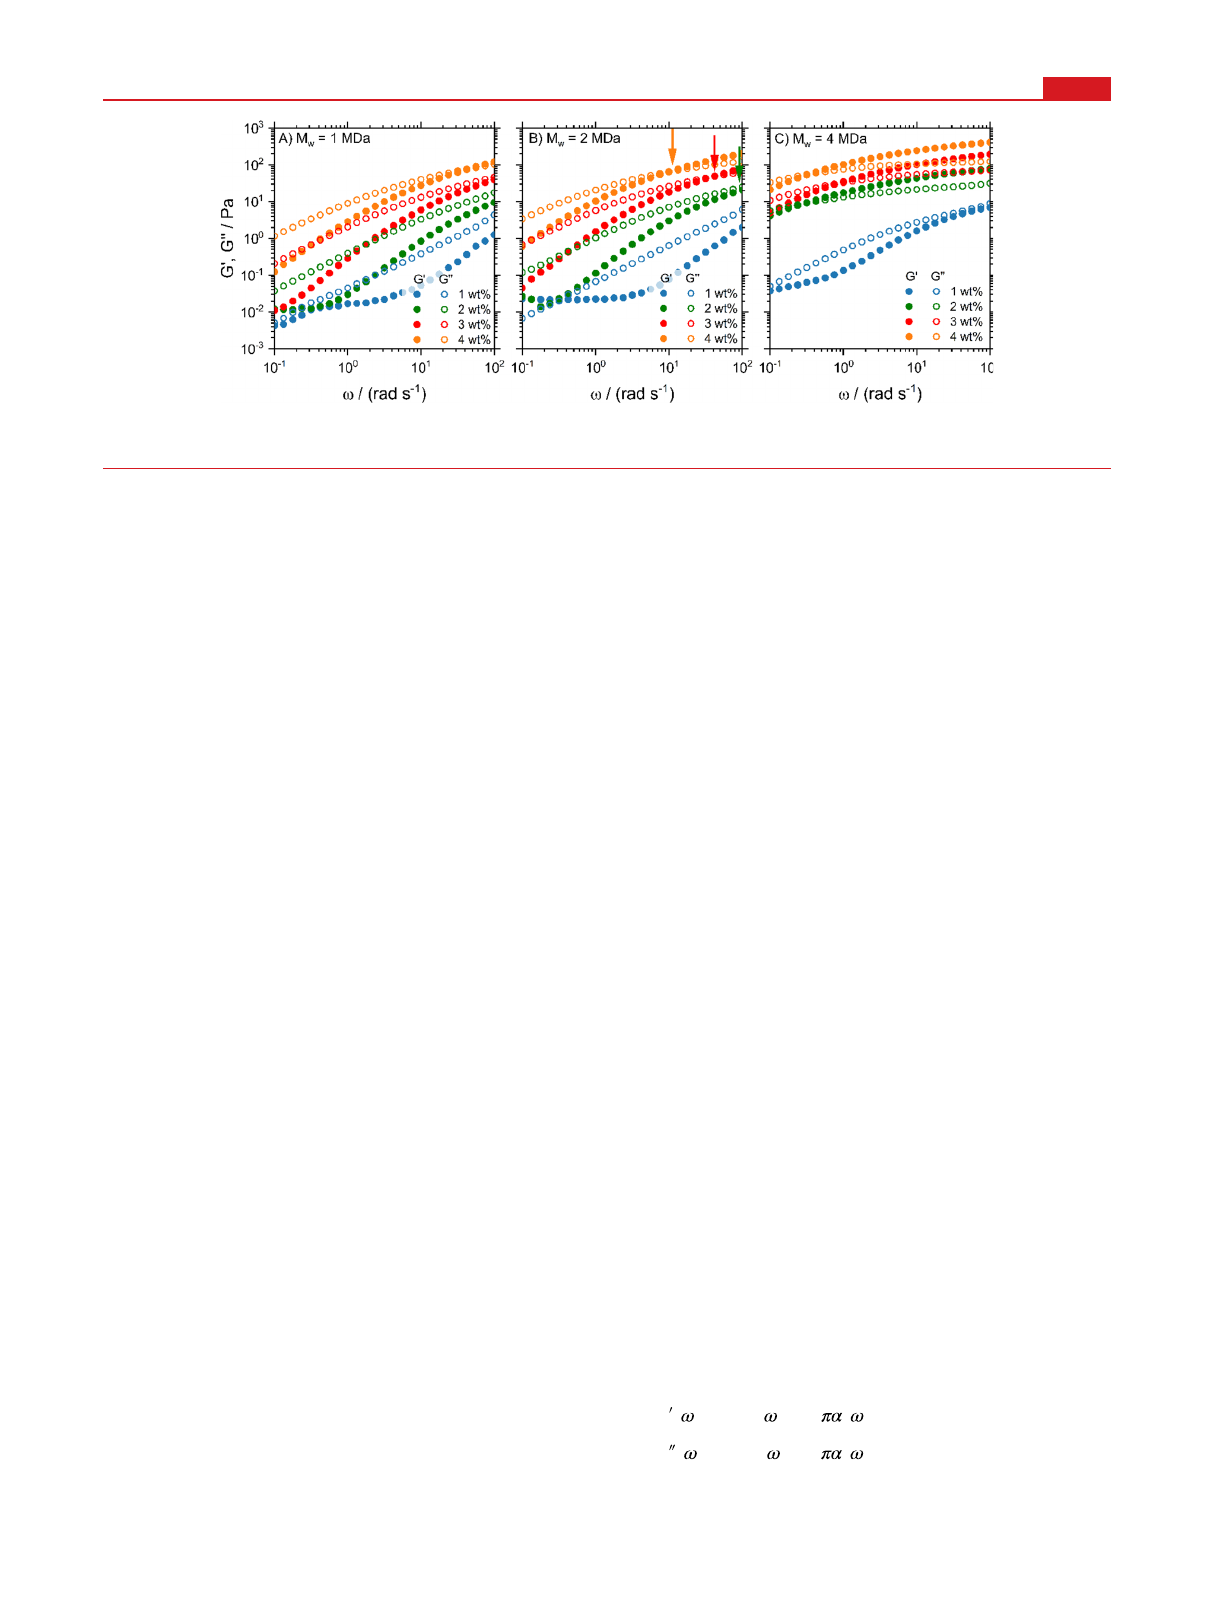
details). The results in Figure 1 demonstrate that the elastic G′
and viscous G″moduli increase with concentration and chain
length. The low-frequency plateau of G′for the low-viscosity
samples is a measurement artifact due to phase-angle
uncertainties and expected for samples with low-torque
signals.
20
For 1 MDa PEO (Figure 1A), all samples are
predominantly viscous since G″>G′for all concentrations and
frequencies except for the highest concentrated 4% sample,
where we see a crossover at very high frequencies. The inverse
crossover frequency ω0indicates a balance between entangle-
ment and disentanglement dynamics and defines the effective
relaxation time τ0= 2π/ω0.
41
With increasing concentration,
ω0, indicated by arrows in Figure 1B, shifts to lower
frequencies. For the 4 MDa PEO (Figure 1C), on the other
hand, G′dominates for most concentrations and frequencies,
indicating that these samples behave predominantly elastically.
Our samples thus cover the full range of viscoelastic behavior.
In SI Section S4 it is shown that the frequency dependence of
G′and G″is well described by the fractional Maxwell model,
which features power-law spectral behavior.
42
■MICRORHEOLOGICAL VISCOELASTIC SPECTRA
Microrheological experiments using dynamic light scattering
(DLS) were performed on the same PEO samples that contain
polystyrene (PS) tracer particles with hydrodynamic diameters
of 68.8 (termed PS-69), 109.3 (PS-109), and 192.0 nm (PS-
192). The DLS measurements yield the intensity autocorre-
lation function g(2)(τ), which is converted into the mean-
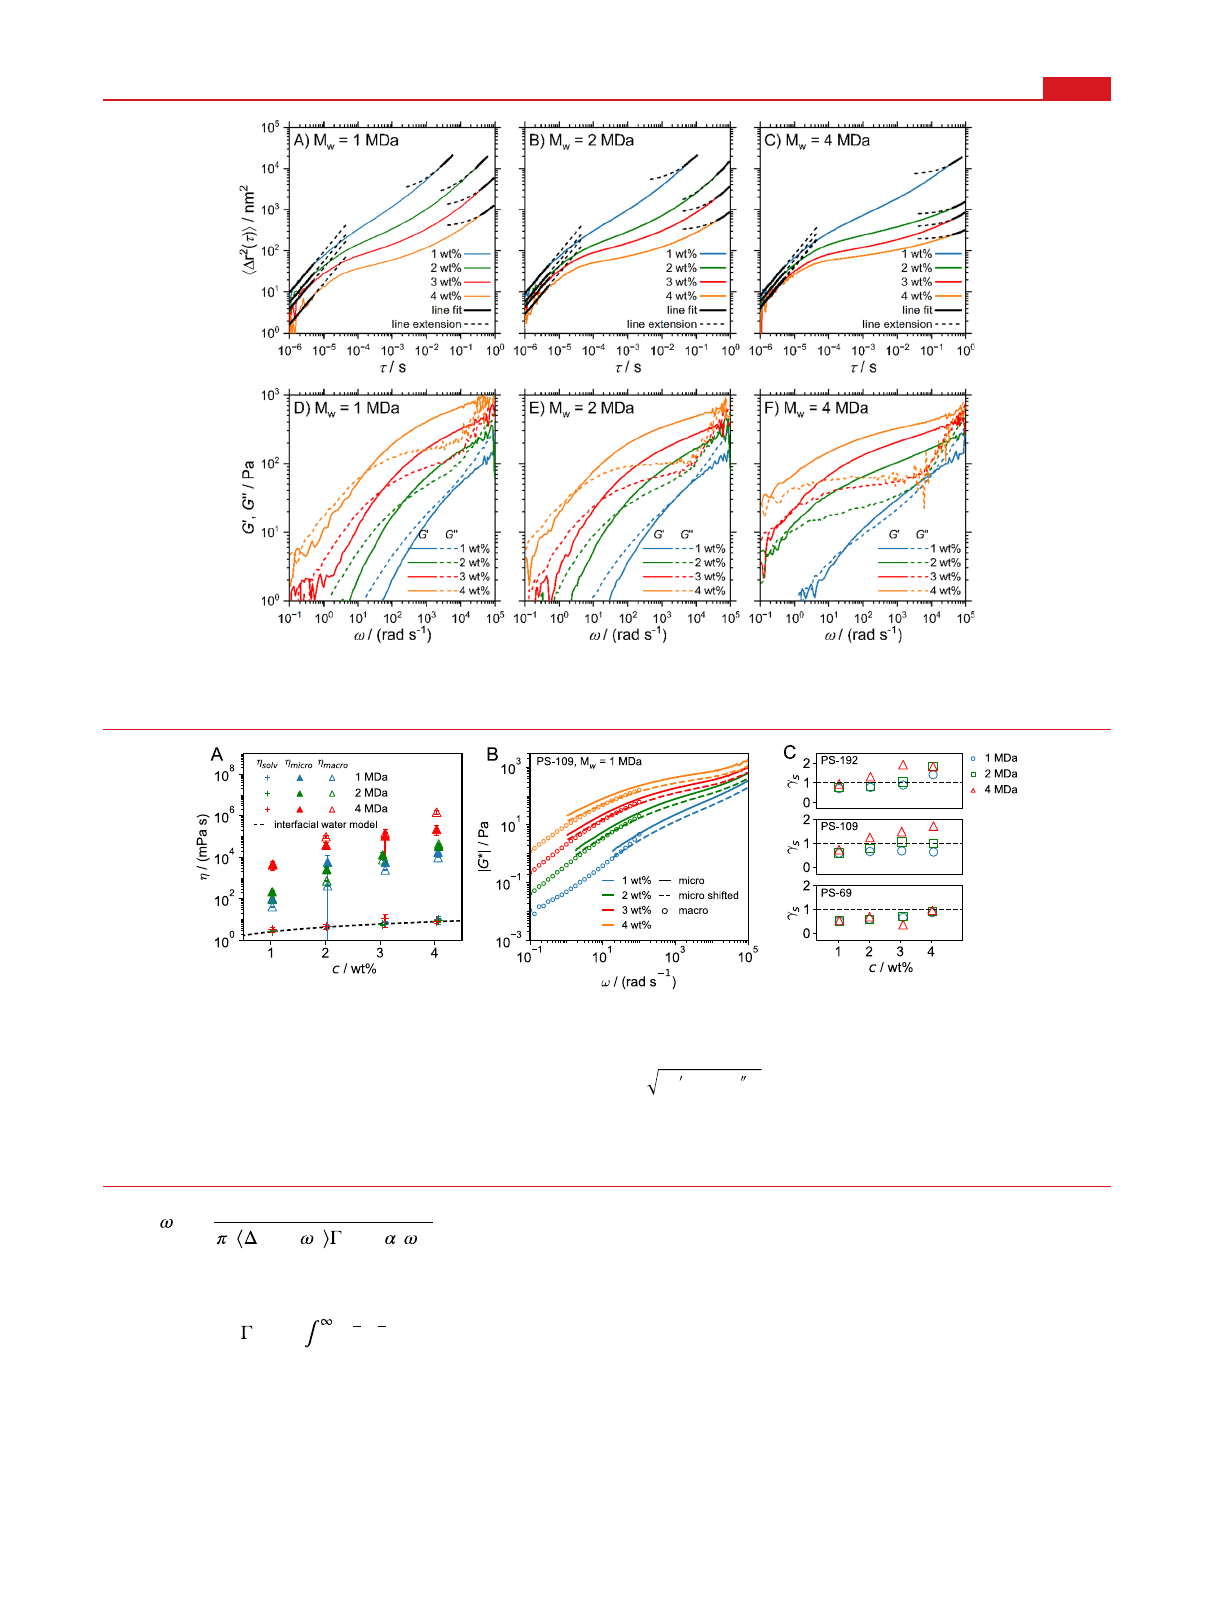
squared displacement (MSD) ⟨Δr2(τ)⟩shown in Figure 2A−
C. Only the highly viscous 4 MDa samples for 3 and 4 wt %
exhibit slight deviations among different spatial measurement
positions caused by the long relaxation times in these systems
(for details and additional data, see SI Section S5).
The MSD is related to the frequency-dependent storage and
loss moduli by the generalized Stokes−Einstein relation
(GSER)
5,6,25,43
= | *| [ ]
= | *| [ ]
G G
G G
( ) ( ) cos ( )/2
( ) ( ) sin ( )/2
(1)
with
Figure 1. Storage (G′) and loss (G″) moduli from macrorheological oscillatory frequency sweeps for PEO solutions with different concentrations
and molecular weights of (A) 1, (B) 2, and (C) 4 MDa. The vertical arrows in panel (B) indicate crossover frequency ω0.
Nano Letters pubs.acs.org/NanoLett Letter
https://doi.org/10.1021/acs.nanolett.3c04884
Nano Lett. 2024, 24, 4758−4765
4759
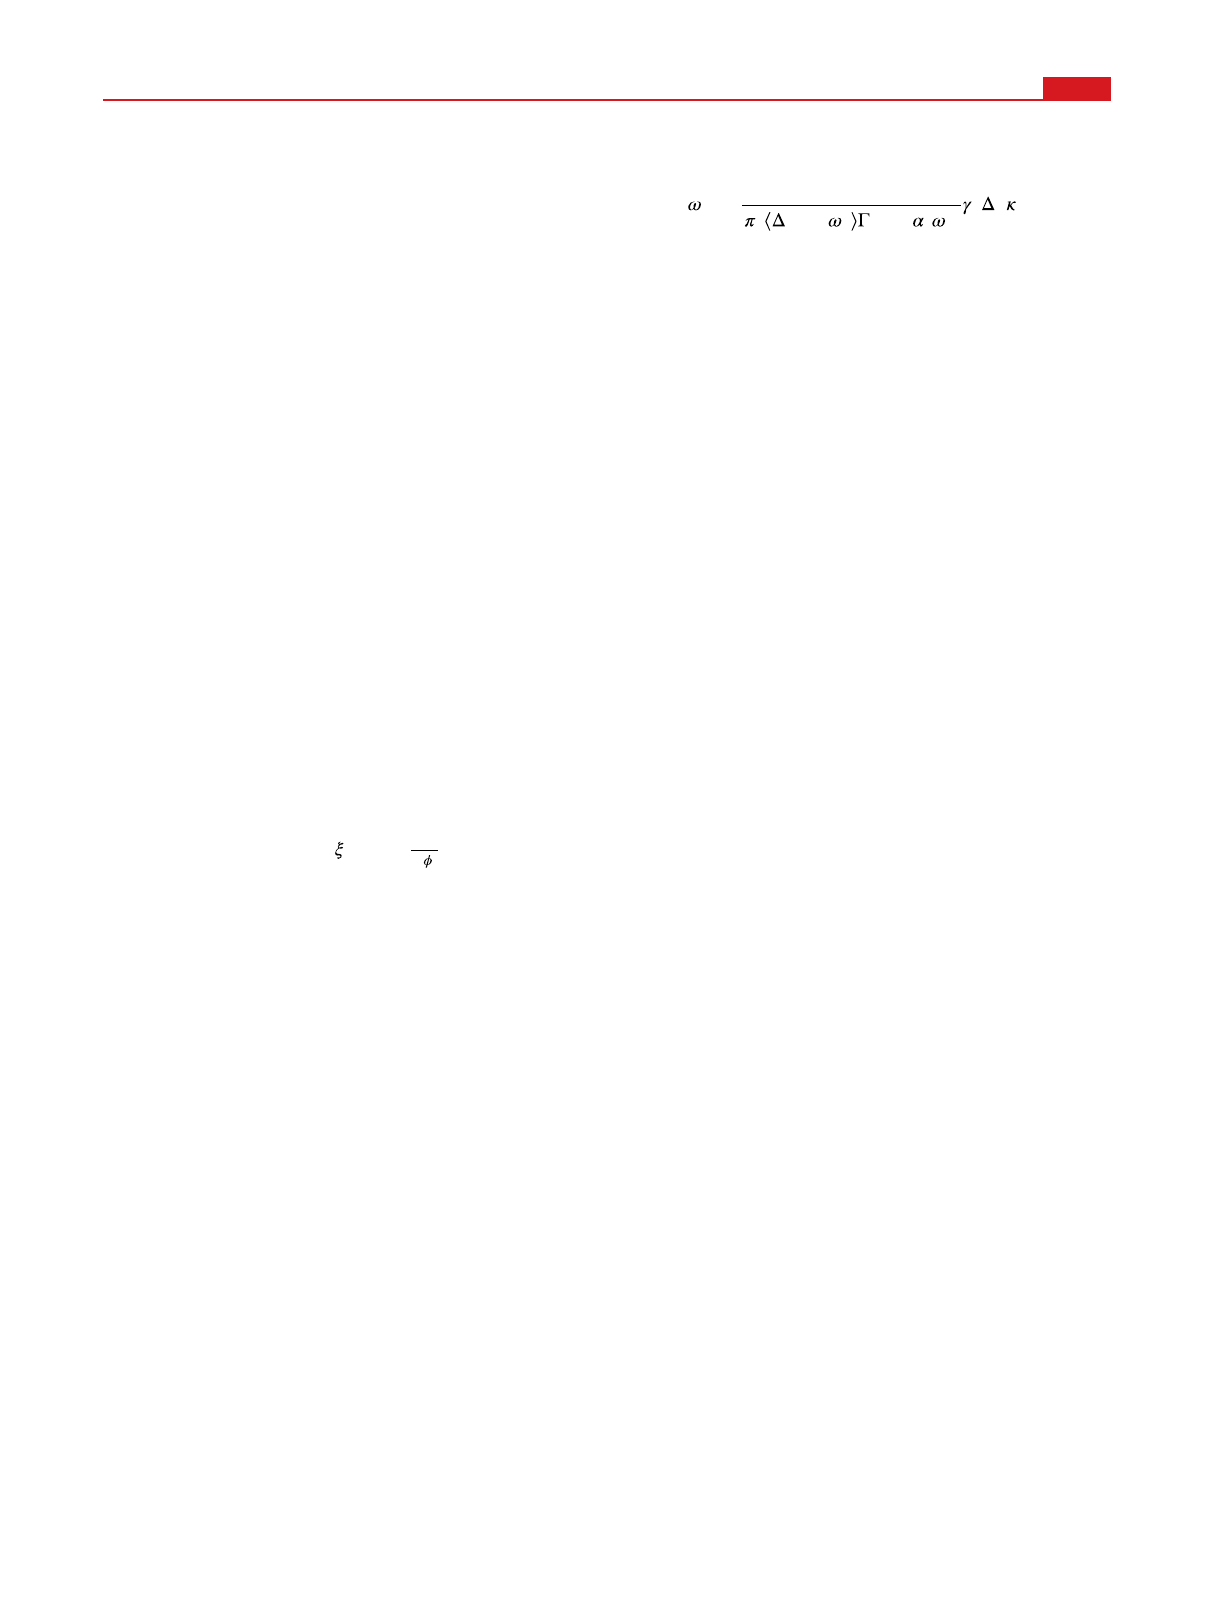
|*| = [ + ]
Gk T
a r
( ) (1/ ) 1 ( )
B
2
(2)
where kBis the Boltzmann constant, Tthe temperature, athe
hydrodynamic tracer-particle radius, and ωthe angular
frequency. Here,
=z x x( ) e d
x
0
z 1
denotes the Gamma
function. The MSDs are expressed as power laws with
frequency-dependent exponent α(ω) and converted into
viscoelastic moduli (see SI Sections S5 and S6).
25,43
The
results for the PS-109 samples are shown in Figure 2D−F.
Neglecting finite particle mass in a purely viscous liquid, the
particle MSD is linear in time. Particles trapped in a purely
elastic solid never leave their initial position; therefore, the
MSD is constant. For viscoelastic hydrogels, three consecutive
scaling regimes occur. At very short times, polymers do not
influence the particle dynamics, which is determined only by
the solvent viscosity,
44
⟨Δr2(τ)⟩= 6Dsolvτ, where Dsolv is the
particle diffusion coefficient in pure solvent. We determine
Dsolv from a fit according to ⟨Δr2(τ)⟩= 6Dsolvτof the short-
time MSD (see SI Section S7), for 10−6<τ< 5 ×10⁻⁶s. The
solvent viscosity ηsolv follows from the Stokes−Einstein
equation Dsolv =kBT/(6πηsolva). At intermediate times, the
particles exhibit subdiffusion, ⟨Δr2(τ)⟩ ∼ ταwith 0 < α< 1,
reflecting hydrogel viscoelasticity. At very long times, the MSD
becomes diffusive again, ⟨Δr2(τ)⟩= 6Dmicroτ+b, where Dmicro
=kBT/(6πηmicroa) characterizes the linear hydrogel viscosity
ηmicro and bis a constant shift.
18,45
Three measurements were
Figure 2. (A−C) Mean-squared displacements ⟨Δr2(τ)⟩and (D−F) storage (G′) and loss moduli (G″) determined using DLS microrheology on
PEO solutions containing PS-109 tracer particles. The full black lines in panels (A−C) indicate asymptotic linear fits, which have been extended by
one decade (broken black lines). The value of the constant in the long-time linear fits is substantial, explaining the curvature in the log−log plots.
Figure 3. (A) Viscosities of the solvent and the hydrogel, ηsolv and ηmicro, determined from linear fits of the short- and long-time behavior of the
MSDs extracted from microrheology in Figure 2, compared to ηmacro, determined from macrorheological steady-shear experiments. The broken line
indicates the effective solvent viscosity of a polymer solution according to eq 4, which accounts for the increased viscosity of interfacial water
surrounding the polymers. (B) Comparison of the viscoelastic moduli
|*| = +G G G( ) ( )
2 2
from macro- and microrheological measurements
for PS-109 tracer particles in 1 MDa PEO solutions (for the other data sets, see SI Section S8). Circles denote macrorheology, and solid lines
denote microrheology results. Broken lines denote the microrheological data that is shifted by a factor γsto match the macrorheology data (see SI
Section S8). (C) Shift factor γsfor different tracer-particle sizes and PEO molecular weights (○, 1 MDa; □, 2 MDa; Δ, 4 MDa) as a function of
PEO concentration. The black horizontal line denotes γs= 1, i.e., perfect agreement between macro- and microrheology.
Nano Letters pubs.acs.org/NanoLett Letter
https://doi.org/10.1021/acs.nanolett.3c04884
Nano Lett. 2024, 24, 4758−4765
4760
performed per chain length and concentration, one for each
tracer-particle radius a. Since no significant differences were
found for varying a, the three values of ηsolv and ηmicro were
averaged, and the results are shown in Figure 3A.
The extracted solvent viscosity ηsolv in Figure 3A increases
with polymer concentration cbut, expectedly, is independent
of the chain length. The values for ηsolv range from 2 to 15 mPa
s and are thus significantly larger than the viscosity of pure
water at 25 °C, which is ηw= 0.89 mPa s. In molecular
dynamics simulations it was shown that the interfacial water
layer at a polar surface exhibits a significantly increased water
viscosity.
46
The thickness of that interfacial layer was obtained
as d= 0.4 nm. To explain the increase in ηsolv with c, we regard
each PEO polymer as being surrounded by an interfacial water
layer with increased viscosity ηi. We model the hydrated
polymers as cylinders with radius Rcyl = (RPEO +d), where RPEO
= 0.229 nm is the radius of a stretched PEO chain, estimated
from the density of a PEO melt (see SI Section S9). The
volume fraction of hydrated polymers is then given by
=
+R d ca N
M c
( )
(100 )
i
PEO
2
0solv A
mono
(3)
where cis the polymer mass percentage, a0= 0.356 nm is the
PEO monomer length,
47
ρsolv is the water mass density, NAis
Avogadro’s constant, and Mmono = 44.05 g/mol is the molar
mass of a PEO monomer. From ϕi, the overall solvent viscosity
follows from a simple geometric model (see SI Section S10) as
= + (1 )
solv i i i w
(4)
where ηiand ηware the viscosities of interfacial and bulk water,
respectively. Using ηw= 0.89 mPa s and d= 0.4 nm, the fit of
eq 4 to our experimental data (broken line in Figure 3A) yields
ηi= (27.17 ±0.74) mPa s, in good agreement with the
simulation results.
46
We thus conclude that the increase of the
solvent viscosity from microrheology can be well explained by
the increased viscosity of the interfacial water layers around the
PEO.
Additionally, the hydrogel viscosity was extracted from
nonoscillatory macrorheological measurements at steady shear
rate γby fits to the nonlinear Cross model (see SI Section
S11). Since ηmacro is the limiting value for zero shear rate, it is
the linear-response viscosity that can be compared to ηmicro
from microrheology. As evidenced in Figure 3A, ηmacro and
ηmicro are comparable, but systematic shifts are observed, as will
be discussed and explained in detail below.
■COMPARISON BETWEEN MACRO- AND
MICRORHEOLOGY
In Figure 3B we compare the absolute values of the viscoelastic
modulus
|*| = +G G G( ) ( )
2 2
from microrheology and
macrorheology for tracer particle PS-109 and polymer weight
Mw= 1 MDa. Deviations are quantified by a frequency-
independent shift factor γsaccording to |Gmicro,shifted
*|=γs|Gmicro
*|
(see SI Section S8), where a value γs= 1 indicates the validity
of the GSER. The shifted |Gmicro,shifted
*|, shown in Figure 3B as
broken lines, perfectly agree with the macrorheological data.
Some discrepancies are observed for the samples with longer
polymers, presumably due to inaccuracies of macrorheological
measurements at high frequencies due to inertial effects (SI
Section S3) as well as long polymeric relaxation times. In
Figure 3B, γsis demonstrated to systematically increase with
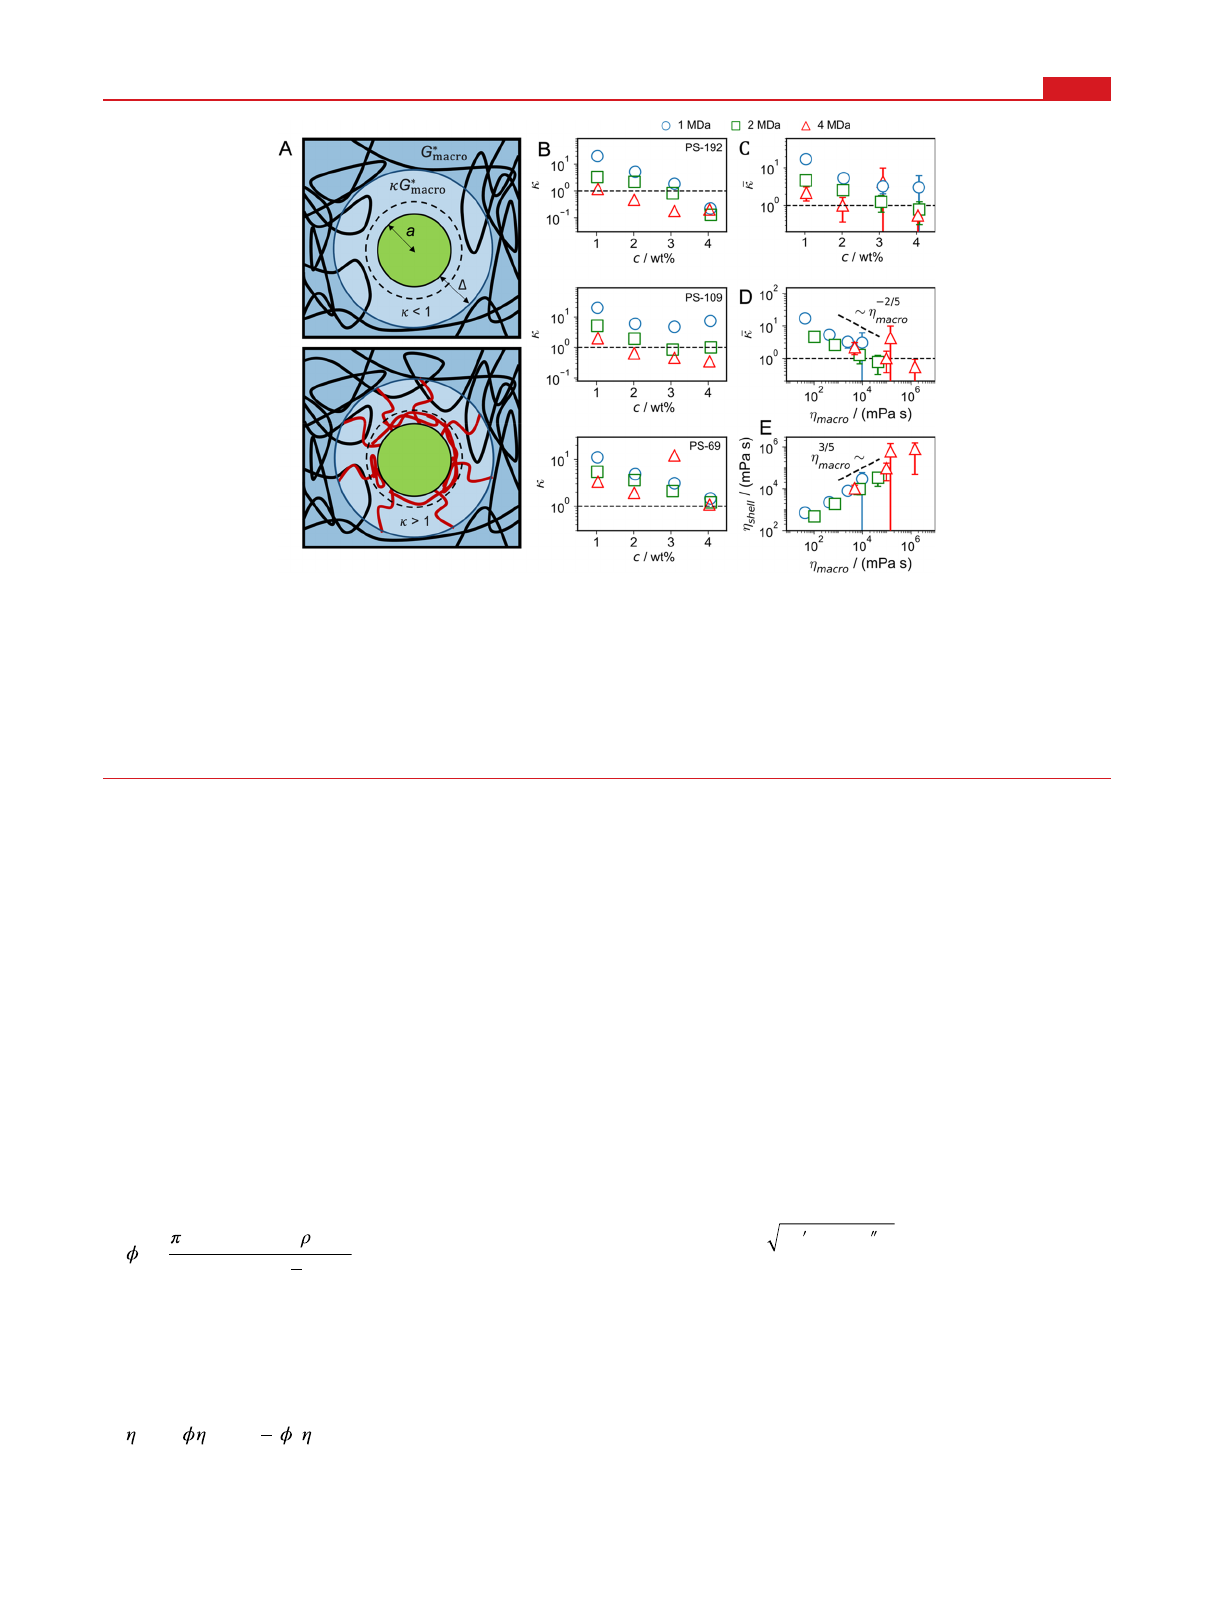
Figure 4. (A) Sketch of a tracer particle in a PEO hydrogel. Particle−PEO interactions produce a depletion (top) or adsorption layer (bottom),
indicated by broken circles, within which the PEO density differs from the bulk. Consequently, the viscoelastic polymer response Gshell
*(ω) deviates
from the bulk spectrum Gmacro
*(ω) within a shell of thickness Δ(indicated by solid circles). The viscoelastic shell thickness Δin the adsorption case
(bottom) is dominated by dangling adsorbed chains (shown in red) and therefore is larger than the adsorption layer thickness. (B) Ratio of shell
and bulk viscoelasticity κ=Gshell
*(ω)/Gmacro
*(ω), which follows from the shift factor γsin Figure 3C, as a function of polymer concentration for
different tracer-particle radii and PEO molecular weights. Fit errors are much smaller than the symbol size. (C, D) Interfacial viscoelastic
enhancement factor averaged over the results for different tracer radii in panel B, κ, plotted as a function of (C) the polymer concentration and (D)
the bulk viscosity ηmacro. Vertical bars indicate the standard deviation of the average over the tracer particle radii and are only shown if larger than
the symbol size. (E) Interfacial shell viscosity ηshell =κηmacro in dependence of bulk viscosity ηmacro. Power laws are added as guides for the eye.
Nano Letters pubs.acs.org/NanoLett Letter
https://doi.org/10.1021/acs.nanolett.3c04884
Nano Lett. 2024, 24, 4758−4765
4761
polymer concentration, while there is a much weaker and less
clear dependence on tracer-particle size and chain length.
To investigate the mechanism behind the discrepancies
between macro- and microrheology and the salient depend-
ence of the shift factor γson polymer concentration, we derive
a generalized GSER from the transient Stokes equation around
a sphere of radius athat includes slip on the sphere surface and
compressibility in the embedding fluid. The transient Stokes
equation includes a general frequency-dependent viscosity and
thus correctly accounts for fluid viscoelasticity. As detailed in
SI Section S12, we find no significant effects due to the finite-
sphere radius for abelow 10 μm in the experimental frequency
range of 10−1<ω< 105rad/s. Also, finite slip always decreases
the particle friction, in contrast to the deviation between
macro- and microrheology in Figure 3B, which for some
experiments suggests a strong enhancement of particle friction.
Thus, the GSER in eq 2, which neglects finite sphere radius,
compressibility, and slip effects, is for the employed particle
radii and particle types an accurate approximation of the exact
solution of the transient Stokes equation derived in SI Section
S12.
The GSER eq 2 furthermore assumes a homogeneous
viscoelastic medium and thus neglects the hydrogel structuring
on the scale of the mesh size ξ.
39,48,49
For particle radii a≫ξ
this assumption is warranted,
16,18,50
for smaller particles
deviations are expected.
51
Since the mesh size is experimentally
only indirectly accessible,
52
it is often estimated by the polymer
correlation length, ξSANS, as obtained from scattering experi-
ments.
53−56
Depending on the PEO concentration, values of
ξSANS ≈2−8 nm were found in our SANS measurements (see
SI Section S13). These lengths favorably compare to the
simple cubic-lattice estimate
=
( )
a
cubic
31/2
0m
, where ϕmis
the monomeric number density (see SI Section S14). We
obtain ξcubic = 3.9 nm for 4 wt % PEO and ξcubic = 7.9 nm for 1
wt % PEO, in good agreement with our SANS measurements.
Since the estimated mesh sizes are much smaller than the
tracer-particle radii used, which range from diameters of 69 to
192 nm, we conclude that the hydrogels are homogeneous on
the tracer-particle size and deviations between macro- and
microrheology cannot plausibly be explained by inhomoge-
neity effects in the bulk hydrogel.
We therefore consider an alternative mechanism for the
GSER violation. The GSER assumes the hydrogel around the
tracer particles to be entirely described by the bulk modulus
Gmacro
*(ω), but due to perturbations of the hydrogel around the
particles, a shell with a thickness Δand a different modulus
Gshell
*(ω) will in general be present around tracer particles. As
illustrated in Figure 4A, the shell within which the modulus
differs from the bulk will, in general, have a different thickness
Δthan the layer within which the polymer density differs from
the bulk value, indicated by a broken circle.
The particle−polymer interactions can be repulsive or
attractive and induce depletion
56−62
(upper scheme) or
adsorption layers
37,63−65
(lower scheme), respectively. For
depletion, one expects a shell with a reduced modulus, which
would lead to a finite slip; for adsorption, one expects an
increased shell viscoelastic modulus. To reduce the number of
free variables in our shell model, we assume that the shell
modulus is related to Gmacro
*(ω) by a frequency-independent
factor according to Gshell
*(ω) = κGmacro
*(ω). The modified
GSER for such a shell model has been derived from the Stokes
equation and reads
39
|*| = [ + ]
Gk T
a r
( ) (1/ ) 1 ( ) ( , )
s
B
2
(5)
the explicit form of the correction factor γs(Δ,κ) is given in SI
Section S15. If Δ= 0 or κ= 1 one has γs(Δ,κ) = 1 and eq 5
converges to eq 2. Alternatively, our data could be rationalized
by a modified effective tracer radius,
65−68
but we argue that a
decreased shell viscoelastic response is a more physical model
than a decreased effective tracer radius (see SI Section S16).
An additional horizontal shift of the microrheology data further
improves the agreement with the macrorheology data, as
shown in SI Section S17. Such a frequency shift suggests a
modified viscoelastic relaxation time in the shell around the
tracer particles, which is neglected by the modified GSER in eq
5. The parameters Δand κcannot be simultaneously
determined from the experimentally measured γsvalues in
Figure 3C, as explained in SI Section S18. By analysis of the
deviation between macro- and microrheological data, we find
that the shell thickness Δis linearly related to the polymer end-
to-end distance Reideal, which suggests that the viscoelastic
perturbation in the interfacial shell is transmitted by polymers
that adsorb to the particle surface and dangle into solution, in
line with literature results for the hydrodynamic radius of
adsorbed polymer layers.
37,69−78
We therefore take Δpropor-
tional to Reideal and determine κby the inversion of γs(Δ,κ) for
each experiment. The proportionality constant between Δand
Reideal is assumed identical for all systems and chosen as the
minimal value that describes all experimental γsvalues, see SI
Section S18 for details. We obtain Δ= 3/5 Reideal, where the
values of Reideal are given in SI Section S1.
In Figure 4B, the results for κare shown to range between
0.1 and 20 and to generally decrease with increasing polymer
concentration with a smaller dependence on particle size (see
SI Section S19). We therefore average over different particle
radii; the resulting average κin Figure 4C is shown to decrease
with concentration and reaches κ≈1 for high concentration.
This means that the effect of the adsorbed polymer chains on
the rescaled viscoelastic modulus in the interfacial shell
diminishes with increasing bulk polymer concentration, in
line with the fact that the relative increase of polymer
concentration in the adsorbed surface layer also decreases with
increasing bulk polymer concentration.
56,79−82
Also, κin
Figure 4C decreases with increasing polymer chain length,
which is plausible since the slowing down of the shell dynamics
due to adsorbed polymer chains becomes less important
compared to the slowing down due the hindered reptation as
the polymer chains become longer.
37,83,84
To investigate the
relation between the interfacial-shell and the bulk viscosity, we
plot in Figure 4D the shell/bulk modulus ratio κversus the
bulk viscosity ηmacro. In this scaling plot an approximate data
collapse between different polymer chain lengths occurs, and
we see that the relative increase of the viscosity in the
interfacial shell decreases significantly and almost universally
with bulk viscosity ηmacro. Clearly, we expect the relation
between κand ηmacro to depend on the surface material, which
we did not vary in the current study. The added straight line is
merely meant as guide to the eye and not as proof of a power
law. In Figure 4E we show the interfacial shell viscosity ηshell =
κηmacro as a function of the hydrogel bulk viscosity ηmacro, which
demonstrates that the shell viscosity increases dramatically
Nano Letters pubs.acs.org/NanoLett Letter
https://doi.org/10.1021/acs.nanolett.3c04884
Nano Lett. 2024, 24, 4758−4765
4762
Loading more pages...