
1. Introduction
1.1. Lunar Polar Environment
The lunar poles offer a unique environment where extreme illumination and thermal conditions exist in
immediate vicinity to each other. Owing to the small lunar axial tilt of 1.5° with respect to the ecliptic, per-
manently shadowed regions (PSRs) exist in many polar craters (Bussey etal.,2010; Mazarico etal.,2011;
Noda etal.,2008). Consequently the coldest temperatures at the Moon are found within these craters (Paige
Abstract The lunar polar regions offer permanently shadowed regions (PSRs) representing the only
regions which are cold enough for water ice to accumulate on the surface. The Lunar Exploration Neutron
Detector (LEND) aboard the Lunar Reconnaissance Orbiter (LRO) has mapped the polar regions for their
hydrogen abundance which possibly resides there in the form of water ice. Neutron suppression regions
(NSRs) are regions of excessive hydrogen concentrations and were previously identified using LEND data.
At each pole, we applied thermal modeling to three NSRs and one unclassified region to evaluate the
correlation between hydrogen concentrations and temperatures. Our thermal model delivers temperature
estimates for the surface and for 29 layers in the sub-surface down to 2m depth. We compared our
temperature maps at each layer to LEND neutron suppression maps to reveal the range of depths at which
both maps correlate best. As anticipated, we find the three south polar NSRs which are coincident with
PSRs in agreement with respective (near)-surface temperatures that support the accumulation of water
ice. Water ice is suspected to be present in the upper ≈19cm layer of regolith. The three north polar NSRs
however lie in non-PSR areas and are counter-intuitive as such that most surfaces reach temperatures
that are too high for water ice to exist. However, we find that temperatures are cold enough in the shallow
sub-surface and suggest water ice to be present at depths down to ≈35–65cm. Additionally we find
ideal conditions for ice pumping into the sub-surface at the north polar NSRs. The reported depths are
observable by LEND and can, at least in part, explain the existence and shape of the observed hydrogen
signal. Although we can substantiate the anticipated correlation between hydrogen abundance and
temperature the converse argument cannot be made.
Plain Language Summary The lunar poles have quite unique illumination conditions. For
instance, the Sun never shines on some crater floors. As a consequence, the floors of those craters are
very cold and dark. Here, water ice can accumulate on the surface and can be preserved for long periods
of time. One of the instruments mounted on the Moon-orbiting satellite Lunar Reconnaissance Orbiter is
capable of detecting areas where hydrogen is located, which is assumed to be present in the form of water
ice. For instance, the instrument detected several areas at the lunar poles where a lot more water ice is
found than at other locations. For these special locations, we calculated the temperatures at the surface
and near sub-surface to see whether they are indeed cold enough for water to freeze. At some of these
locations, surface temperatures turn out to be too warm. However, we found that at these warm surfaces
where no water ice can exist it can be transported into the sub-surface and survive there. This mechanism
is referred to as ice pumping. In summary, we could show that temperatures at all these special locations
are usually cold enough for water ice, either right at the surface or within the first meter of soil.
GLÄSER ET AL.
© 2021. The Authors.
This is an open access article under
the terms of the Creative Commons
Attribution License, which permits use,
distribution and reproduction in any
medium, provided the original work is
properly cited.
Temperatures Near the Lunar Poles and Their
Correlation With Hydrogen Predicted by LEND
Philipp Gläser1,2 , Anton Sanin3, Jean-Pierre Williams4 , Igor Mitrofanov3, and
Jürgen Oberst1,5
1Department of Planetary Geodesy, Technische Universität Berlin, Berlin, Germany, 2Ronin Institute for Independent
Scholarship, Montclair, NJ, USA, 3Institute for Space Research of Russian Academy of Sciences, Moscow, Russian
Federation, 4Department of Earth, Planetary and Space Sciences, University of California Los Angeles, Los Angeles,
CA, USA, 5German Aerospace Center, Institute of Planetary Research, Berlin, Germany
Key Points:
• Some neutron suppression regions
(NSRs) form from surface ice
deposits while others may form
through ice pumping in the
sub-surface
• NSRs identified by Lunar
Exploration Neutron Detector
correlate well with low surface
temperatures in permanently
shadowed regions (PSRs) and are
in agreement with sub-surface
temperatures in non-PSR
Correspondence to:
P. Gläser,
Citation:
Gläser, P., Sanin, A., Williams, J.-P.,
Mitrofanov, I., & Oberst, J. (2021).
Temperatures near the lunar poles
and their correlation with hydrogen
predicted by LEND. Journal of
Geophysical Research: Planets,
126, e2020JE006598. https://doi.
org/10.1029/2020JE006598
Received 3 JUL 2020
Accepted 28 JUL 2021
10.1029/2020JE006598
RESEARCH ARTICLE
1 of 27

Journal of Geophysical Research: Planets
etal.,2010) where the lowest temperatures reach 20K (Siegler etal.,2015; Williams etal.,2019). On crater
rims of such PSRs, however, persistently illuminated areas can exist offering sunshine at surface level for
80%–90% of the year and even >90% at 2m above ground (Gläser etal.,2014,2018). Here, temperatures
of ≈30K (Gläser & Gläser,2019) are possible and hence these areas differ significantly in illumination and
thermal conditions to the nearby PSRs. The orientation of the lunar orbital and spin axis has undergone
significant changes over its history which directly defines the thermal environment of the Moon, especially
at the poles (Siegler etal.,2011).
1.2. Volatile Sources, Migration, and Cold Trapping
Over half a century ago Watson etal.(1961) postulated the theory that water ice can be cold-trapped in
lunar polar craters. Arnold(1979) proposed four potential sources for said lunar H2O which are still valid
today: solar wind reduction of iron (FeO), H2O delivery by asteroids and/or comets, and degassing of en-
dogenic water from the lunar interior. Independent of the source, in each of the four scenarios water mol-
ecules need to migrate to the cold polar areas in order to become trapped within PSRs. Butler etal.(1993)
and Butler(1997) showed that 20%–50% of water molecules survive the migration to the poles via ballistic
hops and accumulate in cold traps. Needham and Kring(2017) estimated that volcanically derived volatiles
alone, degassed during mare basalt forming eruptions, could account for all currently observed hydrogen
deposits in lunar PSRs. However a more recent study by Head etal.(2020) suggests volatile-rich impactors
to be the main source of polar volatiles rather than volcanically derived volatiles. Crider and Vondrak(2002)
showed that water deposits implanted by the solar wind proton flux within 100Ma could also account for
all hydrogen detected by the Lunar Prospector Neutron Spectrometer (LPNS; Feldman etal.,1998). Ong
etal.(2010) calculated the delivery of water via asteroidal and cometary impacts and found that either de-
livery mechanism could account for the observed hydrogen content by LPNS.
Those 20%–50%water molecules which survive the migration toward the poles (Butler, 1997; Butler
etal.,1993) and accumulate in cold traps (Watson etal.,1961), are still prone to be redistributed or be lost to
space via disruption by sputtering, impact gardening, sublimation, and bombardment by UV radiation (Ong
etal.,2010). At temperatures of 106.6K, for instance, it would take one billion years for a ≈1mm thick ice
layer to evaporate (Zhang & Paige,2009,2010). Killen etal.(1997) however showed that for temperatures
<112K the delivery of water from meteoroids and asteroids equals or even exceeds the loss rate. Such low
temperatures are commonly found within PRSs (Paige etal.,2010) suggesting that water ice cannot only be
trapped there but also survive geologic time-scales. Zhang and Paige(2009) point out that the temperature
range over which simple organics can be cold-trapped is much wider than that of water ice and also covers
the volatility temperature of water ice. They conclude that simple organics could therefore be present in
areas which are currently too warm for water ice.
1.3. Observations
It took more than 30yr after water ice was first thought to exist on the Moon until a series of remote sensing
techniques was applied to detect and quantify potential deposits (e.g., Benna etal.,2019; Clark,2009; Far-
rell etal.,2019; Feldman etal.,1998; Fisher etal.,2017; Hayne etal.,2015; Mitrofanov etal.,2010; Nozette
etal.,1996; Paige etal.,2010; Pieters etal.,2009; Thomson etal.,2011; Zuber etal.,2012). Although findings
of the aforementioned authors and missions are plentiful, they cannot unambiguously be assigned to the
presence of water ice but different explanations can be given, for example, roughness, fresh surface materi-
al, hydroxyl (OH) bearing minerals, etc. So far, direct evidence for surface exposed water ice comes from two
remote sensing instruments, the Moon Mineralogy Mapper (M3) flown on the Chandrayaan-1 spacecraft (Li
etal.,2018) and the NASA/DLR Stratospheric Observatory for Infrared Astronomy (Honniball etal.,2020).
Additionally and most crucially, there is unambiguous evidence for significant amounts of lunar near-sur-
face water ice in Cabeus crater measured in-situ by the Lunar Crater Observation and Sensing Satellite
(LCROSS; Colaprete etal.,2010). Cabeus' crater floor is a PSR and was selected as the LCROSS impact site
due to elevated levels of hydrogen reported by both, the LPNS (Eke etal.,2009; Feldman etal.,1998) and
the Lunar Exploration Neutron Detector (LEND; Mitrofanov etal.,2010).
GLÄSER ET AL.
10.1029/2020JE006598
2 of 27

Journal of Geophysical Research: Planets
PSRs are all found near the poles in which temperatures generally are such that water ice can exist at
surface level. However, Mitrofanov etal.(2012) showed that hydrogen-rich regions, the so-called neutron
suppressed regions (NSRs), as identified by LEND do not necessarily coincide with PSRs. Surprisingly they
can also be found in non-PSR areas where temperatures are too high for water ice to exist. Although these
occasionally sunlit NSRs are found near both lunar poles, the most prominent ones are located at the north
pole, where additionally most PSRs do not show enhanced neutron suppression. However, there are several
studies (Eke etal.,2012; Lawrence etal.,2011; Teodoro etal.,2014) skeptical of the correct reduction and
interpretation of LEND observations as proposed by Mitrofanov etal.(2010), specifically of the observations
made by the collimating detectors which are primarily used to create polar maps at high spatial resolution.
In a direct response to the raised concerns by Lawrence etal.(2011) and Mitrofanov etal.(2011) present-
ed additional evidence supporting their earlier results. Later studies (Litvak etal.,2012,2016; Livengood
etal.,2018) could show further that LEND indeed measures a significant amount of collimated epithermal
neutrons and represents an appropriate data set to be used for mapping hydrogen at higher spatial resolu-
tion than was possible with LPNS (Litvak etal.,2012). Therefore, we decided to use the previously published
LEND data (Sanin etal.,2017) to carry out the presented analysis.
Supporting evidence for the lack of hydrogen deposits in north polar PSRs is given in a study by Rubanenko
etal.(2019). They evaluated depth-to-diameter ratios of simple craters at Mercury and the Moon and found
that they become distinctively shallower from 75°N/S on polewards. The shallowing is due to infill within
the craters which is most convincingly explained by water-ice deposits. Only for the lunar north pole such
shallowing could not be confirmed suggesting (almost) ice-free craters. A study by Schorghofer and Ahar-
onson(2014) shows a mechanism how water-ice can be diffused into the sub-surface in sunlit areas if the
maximum and average temperatures stay above 120K and below 105K, respectively. Regions offering such
conditions can only be found near the lunar poles and cover an area larger than the one occupied by PSRs.
We investigate LEND data in combination with temperature maps. Here, we compile surface and sub-sur-
face temperature maps since the depth to which neutron remote sensing can detect hydrogen is down to
≈1m of planetary regolith (Litvak etal.,2016). We aim to answer the open question whether or not the
identified hydrogen-rich areas in sunlit areas are due to neutron signals stemming from deeper layers where
temperatures might be cold enough for water ice to exist.
2. Data and Method
For our study, we created high-resolution lunar polar LOLA DTMs (Gläser etal.,2013) centered on the
poles. Both DTMs span 650×650km and have an original resolution of 20m/pixel. The resolution was
downsampled to 200m/pixel to accommodate limitations in computational capabilities. We defined a total
of eight regions of interest (RoIs) for which we report illumination and temperature. The RoIs comprise
the central 50×50km subsets of each DTM (see Figures1e and2e) as well as regions inside of Cabeus,
Haworth, and Shoemaker craters at the south pole and nearby Peary, Fibiger, and Whipple craters at the
north pole. The central regions were chosen due to the extreme illumination conditions found right near
the poles which also translate into extreme temperatures, hot and cold. The remaining RoIs were chosen
based on studies using data from LEND which identified them as NSRs (Mitrofanov etal.,2012; Sanin
etal.,2017). In fact, Sanin etal.(2017) reported a total of seven NSRs for the north pole and eight for the
south pole which we all analyzed but only report on a few of them. A map of the NSRs which are not further
discussed in this study is shown in FigureA1. For the south pole we chose to report on the three NSRs with
deepest suppression which, in descending order, are Cabeus, Shoemaker, and Haworth. For the north pole,
we chose to report on the two most suppressed regions which are located near Peary (referred to as Erlanger
by Sanin etal.,2017) and Fibiger crater. The third NSR we chose is located near Whipple crater and is the
fourth most suppressed region in the north, together with an unnamed region. We did not chose the third
most suppressed region, referred to as Plaskett, since it is located right on the boundary of the LEND and
temperature data available for this study.
The chosen south polar NSRs correlate (lie within and spread outside) with large, permanently shad-
owed craters. In our study, we refer to such sites as “classical” NSRs since they reside in PSRs of large and
cold crater floors which are generally assumed to be the most promising places to contain water ice (e.g.,
GLÄSER ET AL.
10.1029/2020JE006598
3 of 27
Journal of Geophysical Research: Planets
Arnold,1979; Watson etal.,1961). However, we find four of the eight south polar NSRs to be atypical and
one NSR resides outside our DTM and was excluded (see FigureA1). We define NSRs to be atypical if they
reside in areas which occasionally receive direct sunlight and experience surface temperatures that are too
warm for water ice to exist. Our chosen north polar NSRs do in fact reside in warmer non-PSR areas (Boyn-
ton etal.,2012; Sanin etal.,2012). In total there are four atypical and two classical NSRs at the north pole
and 1 NSR resides outside our DTM and was excluded from the study (see FigureA1).
The RoIs are synthetically illuminated (Gläser etal.,2014,2018) at 12-h increments over a 19yr time frame
to cover all seasonal and orbital illumination conditions (note: the lunar precessional cycle lasts 18.6yr).
Illumination is derived for each RoI considering obstructions of the Sun by topography from the respective
entire polar 650×650km DTM. Note that we treat the Sun as an extended source taking into account the
solar-limb darkening effect. At each pixel and time step the instantaneous illumination is used as an input
to subsequently solve a one-dimensional representation of the heat equation to model temperatures. In our
model (see Gläser & Gläser,2019 for more details) we consider heat conduction in the upper 2m of rego-
lith and derive temperatures for a total of 30 layers, 29 layers in the sub-surface and 1 layer at the surface
(compare the first 27 layers given in the first column of TableB2 plus the additional layers at 1.25, 1.55, and
1.85m, respectively). Thermophysical parameters were adopted from studies of Vasavada etal.(2012) and
Hemingway etal.(1973). Multiple scattering of reflected sunlight by terrain as well as thermal re-radiation
is considered within a window size of 50×50km. Scattering of sunlight from Earth and thermal re-radi-
ation of an average warm Earth are also considered (Gläser & Gläser,2019; Trenberth & Stepaniak,2003).
Finally, heat stemming from nuclear decay in the lunar interior is modeled via a constant radiogenic heat
source of 0.016W/m2 sitting just below our deepest layer (Langseth etal.,1976; Vasavada etal.,2012). The
GLÄSER ET AL.
10.1029/2020JE006598
4 of 27
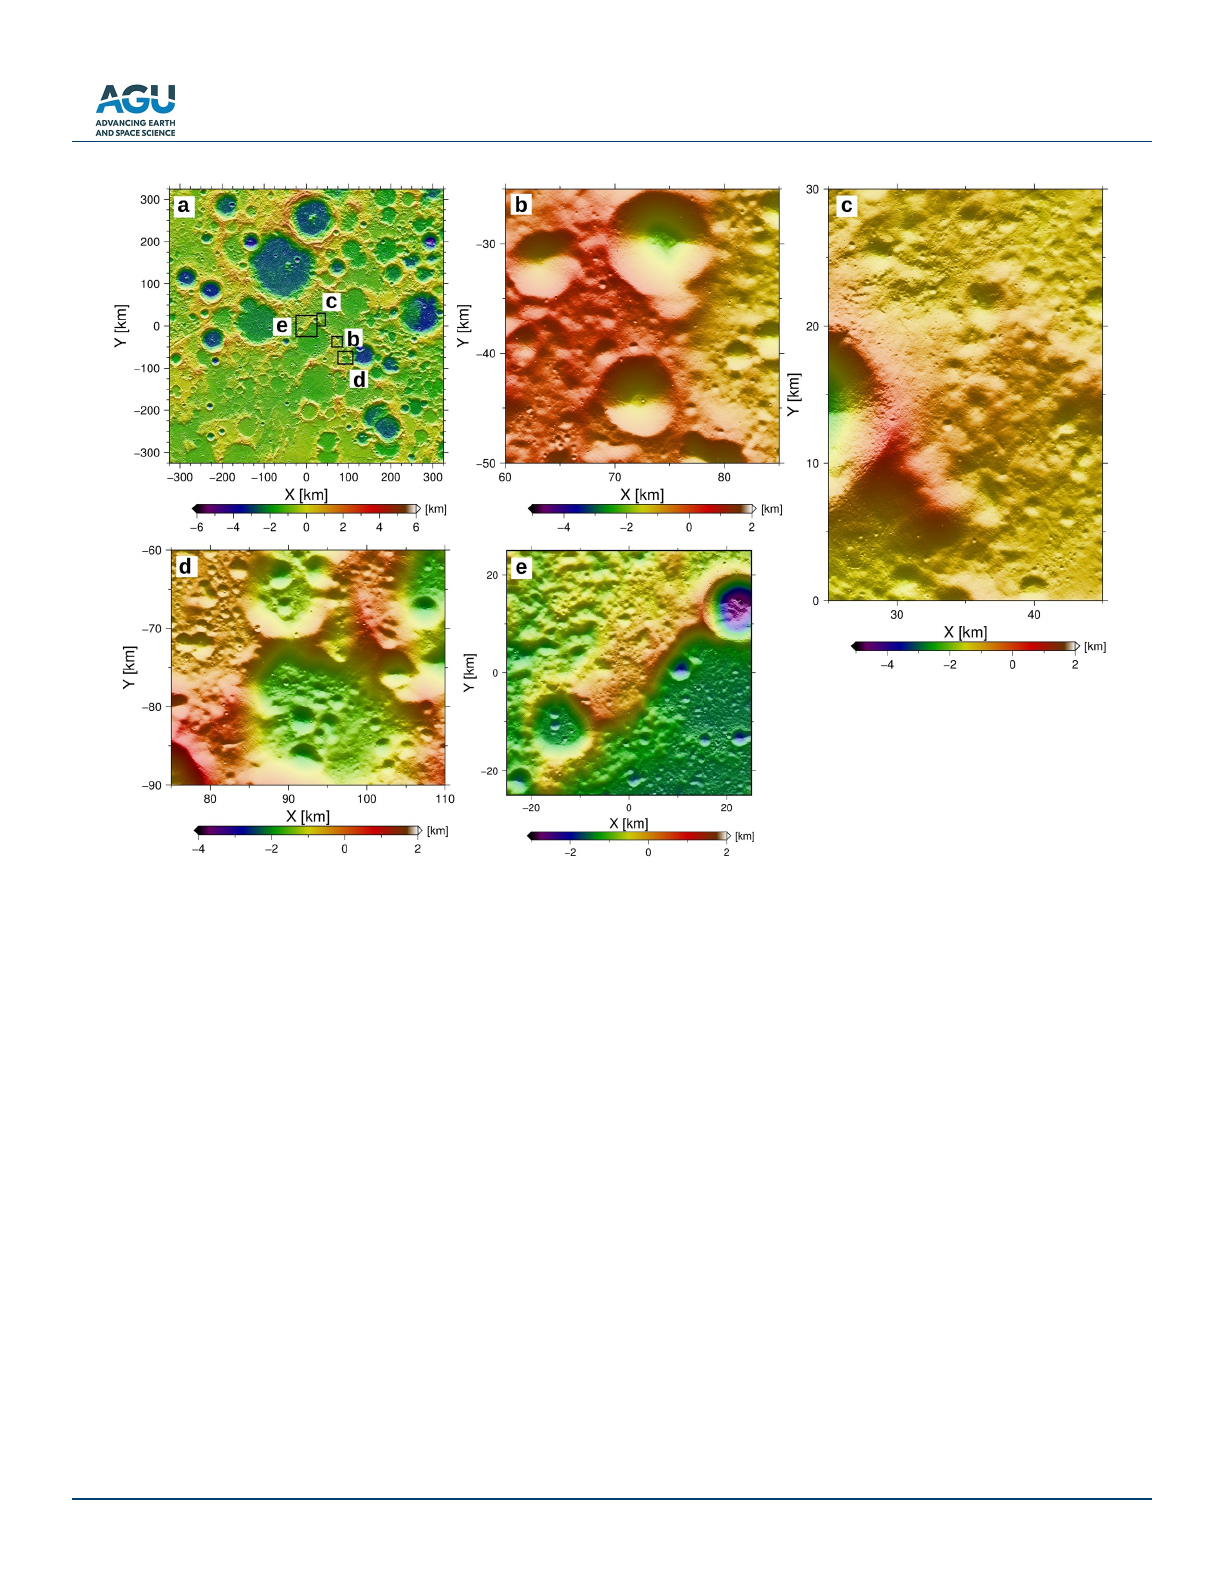
Figure 1. The north polar LOLA DTMs have a resolution of 20m/pixel. (a) 650×650km north polar DTM with outlines of RoIs. The RoIs are (b) Peary, (c)
Whipple, (d) Fibiger craters, and (e) the central polar 50×50km region. All maps are displayed in gnomonic map projection and are color-coded by heights.
For presentation purposes the map sizes are arbitrary and are not related to each other.
Journal of Geophysical Research: Planets
model and the chosen parameters are capable of reproducing the Diviner temperature measurements (see
Gläser & Gläser,2019).
3. Results
We started our investigation from a uniform temperature distribution at
each of the 30 layers. The surface layer was set to 80K with temperature
declining by 1K per layer. Hence the deepest layer (30cm wide and cen-
tered at 1.85m in the sub-surface) started from a uniform temperature
distribution of 51K. The DTMs were then illuminated in 12-h time-steps
for 19yr in order to cover all effects stemming from the 18.6yr lunar pre-
cessional cycle. The chosen time period was January 01, 1991 at midnight
to January 1, 2010 at midnight for which roughly the same orbital, sea-
sonal, and hence the same illumination conditions occur at the start and
end date. Consequently, we can start to iterate with the last result as our
new initial temperature distribution. We found that after five iterations
(i.e., 95a) the largest temperature difference from the fourth to the fifth
iteration was 0.5K at the deepest layer and 0.02K at the surface with av-
erage values being one to two orders of magnitude smaller, see Figure3.
Hence, the solution after the fifth iteration is considered our equilibrated
GLÄSER ET AL.
10.1029/2020JE006598
5 of 27
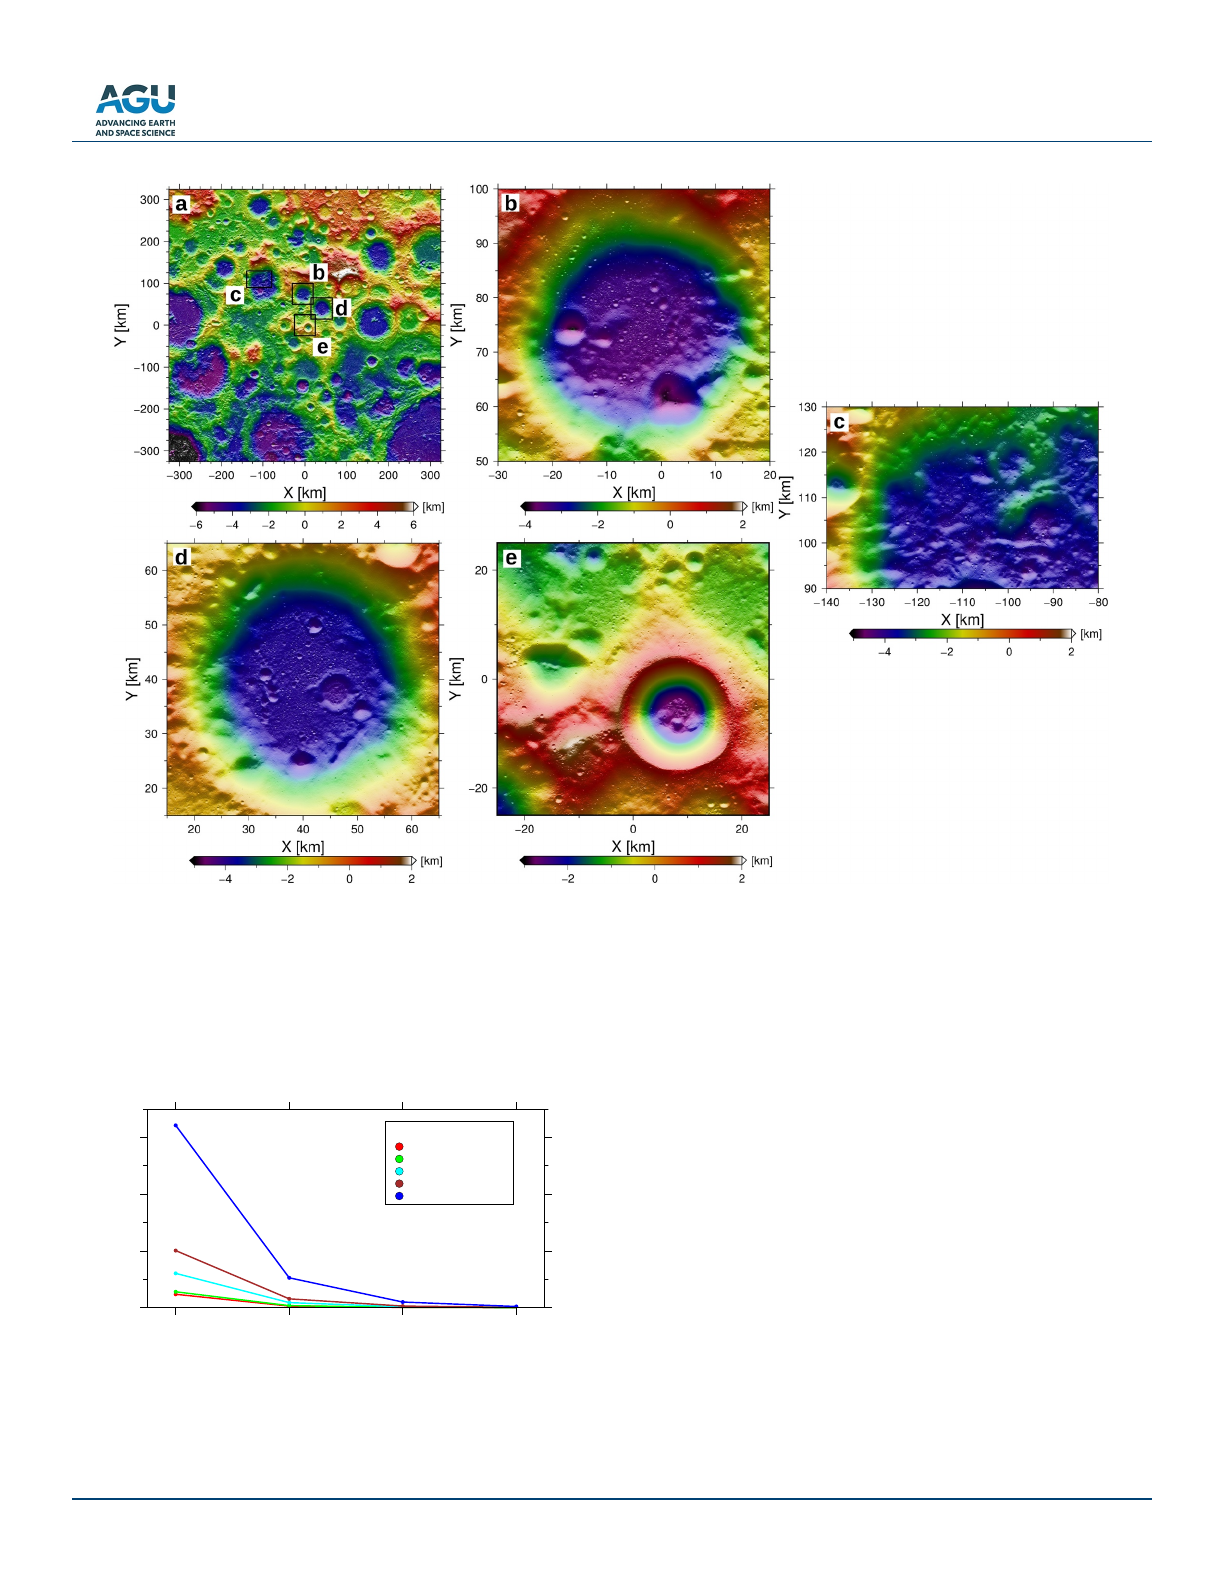
Figure 2. The south polar LOLA DTMs have a resolution of 20m/pixel. (a) 650×650km south polar DTM with outlines of RoIs. The RoIs are (b) Haworth, (c)
Cabeus, (d) Shoemaker craters, and (e) the central polar 50×50km region. All maps are displayed in gnomonic map projection and are color-coded by heights.
For presentation purposes the map sizes are arbitrary and are not related to each other.
Figure 3. The average temperature difference at five different depth layers
(0, 0.25, 4.75, 19, and 185cm, respectively) is shown over five iterations.
All profiles converge toward zero with the deepest layer starting from the
largest difference. Profiles correspond to the central regions of interest
(RoI) at the north pole but are representative for all RoIs presented here.
0
1
2
3
∆T [K]
2
345
Iteration [#]
0
1
2
3
∆T [K]
2
345
Iteration [#]
0
1
2
3
∆T [K]
2
345
Iteration [#]
0
1
2
3
∆T [K]
2
345
Iteration [#]
0
1
2
3
∆T [K]
2
345
Iteration [#]
0
1
2
3
∆T [K]
2
345
Iteration [#]
0
1
2
3
∆T [K]
2
345
Iteration [#]
0
1
2
3
∆T [K]
2
345
Iteration [#]
0
1
2
3
∆T [K]
2
345
Iteration [#]
0
1
2
3
∆T [K]
2
345
Iteration [#]
Average ∆T
at surface
at 0.25 cm depth
at 4.75 cm depth
at 19 cm depth
at 185 cm depth
Loading more pages...