
Citation: Pedan, V.; Koehling, R.;
Drexel, L.; Breitruck, K.; Rueck, A.;
Rohn, S.; Rienitz, O.; Pramann, A.;
Seidel, T.; Allenspach, E.; et al.
Combination of Standard Addition
and Isotope Dilution Mass
Spectrometry for the Accurate
Determination of Melamine and
Cyanuric Acid in Infant Formula.
Foods 2024,13, 2377. https://
doi.org/10.3390/foods13152377
Academic Editor: Roberto
Romero-González
Received: 18 June 2024
Revised: 19 July 2024
Accepted: 23 July 2024
Published: 27 July 2024
Copyright: © 2024 by the authors.
Licensee MDPI, Basel, Switzerland.
This article is an open access article
distributed under the terms and
conditions of the Creative Commons
Attribution (CC BY) license (https://
creativecommons.org/licenses/by/
4.0/).
foods
Article
Combination of Standard Addition and Isotope Dilution Mass
Spectrometry for the Accurate Determination of Melamine and
Cyanuric Acid in Infant Formula
Vasilisa Pedan 1, Rudolf Koehling 1,*, Lukas Drexel 1, Kathrin Breitruck 1, Alexander Rueck 1, Sascha Rohn 2,
Olaf Rienitz 3, Axel Pramann 3, Tim Seidel 1, Eric Allenspach 1and Markus Obkircher 1
1Sigma-Aldrich Production GmbH (Subsidiary of Merck KGaA), Industriestrasse 25,
kathrin.breitruck@merckgroup.com (K.B.); alexander.rueck@merckgroup.com (A.R.);
tim.seidel@merckgroup.com (T.S.); eric.allenspach@merckgroup.com (E.A.);
markus.obkircher@merckgroup.com (M.O.)
2Institute of Food Technology and Food Chemistry, Department of Food Chemistry and Analysis,
3Physikalisch-Technische Bundesanstalt, Bundesallee 100, 38116 Braunschweig, Germany;
*Correspondence: rudolf.koehling@merckgroup.com; Tel.: +41-81-755-23-01
Abstract:
In the melamine scandals of the early 2000s, different companies of the dairy industry
cheated their products by applying chemical substances to feign a higher content of nitrogen. How-
ever, this had a severe toxic impact on the kidney health of consumers. As a result, tremendous
effort was put into the prevention of further harm to the public. In the present study, a fast–screening
method for the determination of melamine and cyanuric acid in infant formula was developed.
While a 1D–LC approach is faster and easier to set up, a 2D–LC approach allows for a more accurate
result with better selectivity and sensitivity. For both instrumental approaches, the signal ratio
of the isotopologues was crucial and had a dominant effect on the results and the measurement
uncertainty. For this reason, the different contributions to the measurement uncertainty were deter-
mined experimentally using Matched Standard Addition–IDMS and compared to the Exact Matching
Double IDMS.
Keywords:
isotope dilution mass spectrometry; proficiency testing; infant formula; two–dimensional
liquid chromatography; residues
1. Introduction
Chemical contaminants in food and feed are of great public concern due to their
potential health threats. The animal feed scandal in 2007 and the milk scandal in the
following year were significantly severe food safety incidents. Especially in the latter
scandal, the intentional adulteration with melamine (MEL) and cyanuric acid (CYA) did
not only lead to a non–negligible number of deaths of animals and humans, but also to food
recalls and widespread public outrage. As long–term consequence, intensified analytics
regarding food contaminants in dairy products were intended. Before those scandals,
only chemists dealing with plastics analysis knew about these industrial chemicals and
their use, but today, all kinds of food scientists must deal with adulteration of sources
of non–protein nitrogen. Both compounds are still in use in significant amounts as bulk
chemicals, whereby MEL formaldehyde is used as raisin for the fabrication of laminates,
plastics, glues, tableware, etc. [
1
]. CYA is a byproduct of the industrial use of melamine. It
is used as bleaches, disinfectant, and is most known as a stabilizer for chlorine in outdoor
pools [
2
]. Both compounds are chemicals with a high nitrogen content, which can induce
Foods 2024,13, 2377. https://doi.org/10.3390/foods13152377 https://www.mdpi.com/journal/foods
Foods 2024,13, 2377 2 of 17
misinterpretation of data from non–specific total protein measurement methods such as
Kjeldahl analysis.
MEL and CYA are water–soluble compounds, whereby MEL shows a water solubility
of 3.24 mg/mL H
2
O [
3
] and CYA shows a water solubility of 2.59 mg/mL H
2
O at 25
◦
C [
4
].
However, in concentrations exceeding 2
µ
g/mL, MEL and CYA crystallize in a one–to–
one ratio to form melamine cyanurate, a very poorly water–soluble complex [
5
]. Several
toxicology studies found evidence that the poorly soluble complex of MEL–CYA can cause
kidney failure in humans and animals [6,7].
Due to the increasing intensity and severity of food fraud in the past years, diverse
analytical methods have been developed and reported for MEL and its analogous CYA,
whereas lots of them use sample clean-up preparation to remove matrix compounds,
potentially disturbing analysis. Several sample preparation methods use and recommend
SPE (solid phase extraction) [
5
,
8
–
10
]. Because of complex matrices and to protect the
sensitive mass spectrometric (MS) systems, some working groups are using alternatively
LC–MS/MS [8] and GC–MS [8,11], also immunoassays [12] or HPTLC methods [13].
Trace analysis in food matrices is very challenging. Here, multidimensional separation
techniques are currently the state of the art. The 2D–LC method is claimed to be a more
powerful tool regarding peak capacity and sample complexity, further enabling the mass
spectrometer to analyze more compounds with high sensitivity [
14
]. Furthermore, a
2D–LC system can be used to overcome matrix effects that might interfere separation or
the following MS ionization.
To minimize matrix effects, the National Institute of Standards and Technology (NIST)
uses techniques based on isotope dilution mass spectrometry (IDMS), which can offer fur-
ther advantages to overcome matrix effects due to the similar behavior of the stable isotopes
and analyte in sample preparation, extraction, chromatography, and MS ionization [
15
].
In general, IDMS is applied preferably when the accuracy of the results is of predominant
analytical importance [
16
]. Especially the Exact Matching Double IDMS (EMD–IDMS)
technique eliminates instrumental biases and allows for a precise measurement of the
amount of substance in a sample against a similar reference material [17–19].
Despite instrumental effects on the measurement of the isotopologue amount, ratio
differences in the sample matrix itself can also lead to biases. To reduce the matrix effect,
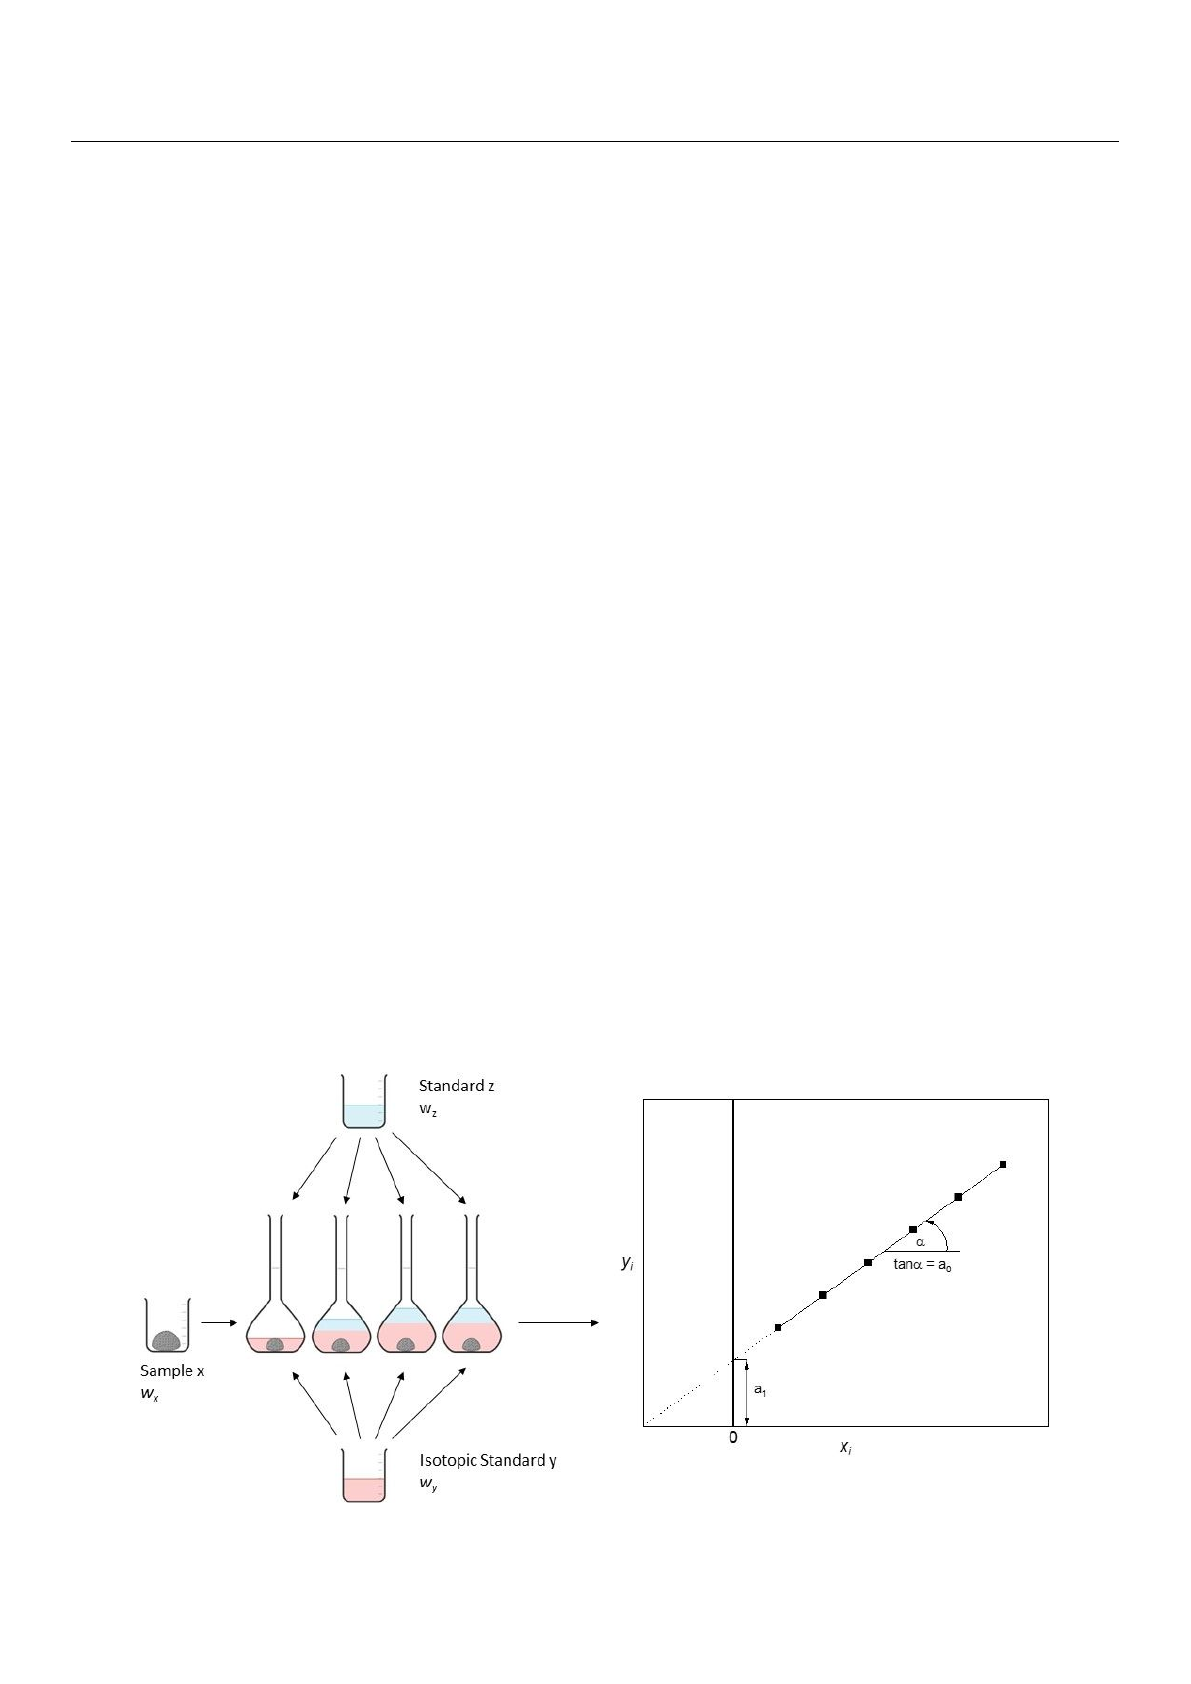
MSA–IDMS can be introduced as a combination of standard addition and IDMS (Figure 1),
which was first presented by Pagliano and Meija [
20
] and improved a couple of years later
by Brauckmann and co–workers [21].
Foods 2024, 13, 2377 2 of 17
which can induce misinterpretation of data from non−specific total protein measurement
methods such as Kjeldahl analysis.
MEL and CYA are water−soluble compounds, whereby MEL shows a water solubility
of 3.24 mg/mL H2O [3] and CYA shows a water solubility of 2.59 mg/mL H2O at 25 °C [4].
However, in concentrations exceeding 2 µg/mL, MEL and CYA crystallize in a one−to−one
ratio to form melamine cyanurate, a very poorly water−soluble complex [5]. Several
toxicology studies found evidence that the poorly soluble complex of MEL–CYA can cause
kidney failure in humans and animals [6,7].
Due to the increasing intensity and severity of food fraud in the past years, diverse
analytical methods have been developed and reported for MEL and its analogous CYA,
whereas lots of them use sample clean−up preparation to remove matrix compounds,
potentially disturbing analysis. Several sample preparation methods use and recommend
SPE (solid phase extraction) [5,8–10]. Because of complex matrices and to protect the
sensitive mass spectrometric (MS) systems, some working groups are using alternatively
LC−MS/MS [8] and GC−MS [8,11], also immunoassays [12] or HPTLC methods [13].
Trace analysis in food matrices is very challenging. Here, multidimensional
separation techniques are currently the state of the art. The 2D−LC method is claimed to
be a more powerful tool regarding peak capacity and sample complexity, further enabling
the mass spectrometer to analyze more compounds with high sensitivity [14].
Furthermore, a 2D−LC system can be used to overcome matrix effects that might interfere
separation or the following MS ionization.
To minimize matrix effects, the National Institute of Standards and Technology
(NIST) uses techniques based on isotope dilution mass spectrometry (IDMS), which can
offer further advantages to overcome matrix effects due to the similar behavior of the
stable isotopes and analyte in sample preparation, extraction, chromatography, and MS
ionization [15]. In general, IDMS is applied preferably when the accuracy of the results is
of predominant analytical importance [16]. Especially the Exact Matching Double IDMS
(EMD−IDMS) technique eliminates instrumental biases and allows for a precise
measurement of the amount of substance in a sample against a similar reference material
[17–19].
Despite instrumental effects on the measurement of the isotopologue amount, ratio
differences in the sample matrix itself can also lead to biases. To reduce the matrix effect,
MSA−IDMS can be introduced as a combination of standard addition and IDMS (Figure
1), which was first presented by Pagliano and Meija [20] and improved a couple of years
later by Brauckmann and co−workers [21].
Figure 1. The principle of MSA−IDMS measurement is shown.
Although several MS methods are proposed for the analysis of MEL and CYA in
different matrices, there is still a need for high accuracy methods especially for developing
Figure 1. The principle of MSA–IDMS measurement is shown.

Foods 2024,13, 2377 3 of 17
Although several MS methods are proposed for the analysis of MEL and CYA in
different matrices, there is still a need for high accuracy methods especially for developing
certified reference materials (CRM) [
8
,
22
]. The aim of the present study was to develop a
fast–screening method for MEL and CYA. Beneath the one–point calibration as single IDMS,
additional sophisticated methods are used, like the combination of standard addition and a
double IDMS as described by Brauckmann and co–workers [
21
]. The adoption of MSA–
IDMS has been attempted for the analysis of organic analytes. For comparison, results
and uncertainty estimations were evaluated with the classic approach of EMD–IDMS as
well as MSA–IDMS. All samples and calibration blends were prepared gravimetrically
in a controlled environment with traceable temperature, relative air humidity, and air
pressure [
23
]. Further, this method should be verified through participation in The Food
Analysis Performance Assessment Scheme (FAPAS
®
) program of the UK, operating under
the Food and Environment Research Agency (FERA) of the UK, to gain ISO/IEC 17025:2017
accreditation for both chemical compounds and especially infant formula as a matrix
of interest.
2. Materials and Methods
2.1. Reference Materials
The non–isotopically labeled CRM of melamine (2,4,6–triamino–1,3,5–triazine), MEL,
was purchased from Merck KGaA (Buchs, Switzerland), while cyanuric acid (2,4,6–triol–
1,3,5–triazine), CYA, was purchased from Dr. Ehrenstorfer
™
(LGC Standards GmbH,
Wesel, Germany). The isotopic labeled materials were both purchased from Merck KGaA
(Buchs, Switzerland). The non–isotopically labeled homologous MEL has a chemical purity
of 0.9995 g/g. The CYA CRM was certified with a content 0.983 g/g. The isotopically
labeled homologous
13
C
3
–MEL has a chemical purity of 0.988 g/g. The chemical purity of
13
C
3
–CYA was stated with 0.996 g/g. Details about the distribution of the isotopologues
were not given.
For HPLC analysis, individual stock solutions of MEL, CYA, and their isotopically
homologous
13
C
3
–MEL and
13
C
3
–CYA were prepared at 1 mg/mL in water by adding
6% (60 mL/L) formic acid. The individual working solution was obtained at 0.01 mg/mL
by further dilution with acidified water. All solutions were stored in the dark at
−
20
◦
C.
In contrary to MEL, CYA is less water–soluble; for this reason, CYA and MEL were dis-
solved by sonication for 30 min in the volumetric flask. HPLC–grade ammonium formate,
acetonitrile, formic acid (0.99 g/g), and water were purchased from Merck KGaA.
2.2. Preparation of MEL and CYA in Infant Formula as an In–House Matrix Reference Material
CRM producers and laboratories need to participate in interlaboratory comparisons
for their accreditation according to ISO/IEC 17025. In this context, proficiency testing
(PT) vendors provide laboratories with specific samples contaminated with an appropriate
amount of the requested chemical substances added to the matrix [
19
]. The item code for
the PT sample in this study was 30,110 with a size of 50 g. In general, this PT round for 2021
was announced for food manufacturers and testing laboratories, whereby 22 participants
were subscribed for CYA and 39 participants were subscribed for MEL.
In the present study, a pure solution containing a known amount of CYA,
13
C
3
–CYA,
and MEL,
13
C
3
–MEL, respectively, was prepared as reference sample in the context of
double IDMS. The preparation of a reference sample for double IDMS resulted in smaller
uncertainties than single IDMS [
24
–
26
]. However, to better understand the influence of
the matrix on the measured result, a self–made in–house matrix reference material with a
known amount of CYA and MEL was prepared.
Hereby, the in–house matrix reference material was obtained by spiking the analytes
at the beginning of the sample preparation to compare chromatographic peculiarities
regarding matrix effect and peak shape with those of solvent–based curves. Therefore,
1 kg of infant formula was purchased from a local market and analyzed by an accredited
LC–MS/MS method to confirm that it was free of MEL and CYA. An initial powder to be

Foods 2024,13, 2377 4 of 17
used as working standard with a concentration of 4.3 mg/kg for MEL, and 3.8 mg/kg for
CYA, respectively, was gravimetrically prepared by dissolving an appropriate quantity of
the neat material in water by 38
◦
C. An accurately weighed aliquot of standard solution
was added into the infant formula by stirring for 30 min at 4
◦
C to ensure a homogenous
distribution of MEL and CYA in the infant formula. The sample was lyophilized and
ground to a fine powder with a blender. The mixed powder samples were dispensed into
clean amber bottles and immediately capped with lids. The final product was stored at
room temperature before analysis.
2.3. Sample Preparation for LC–MS Analysis
A homogenized test portion of 0.5 g infant formula was weighed into a 15 mL
polypropylene centrifugal vessel. An extraction solvent (8 mL) of 50% (V/V) aqueous
acetonitrile containing 6% (V/V) formic acid was added to extract the maximum amount of
MEL and CYA. Protein precipitation was performed by adding acetonitrile as part of the ex-
traction and precipitation solution. An aliquot of ca. 100
µ
L of each sample
13
C
3
–MEL and
13C3–CYA with a concentration of 0.01 mg/g was added to the extraction solvent. Herein,
the appropriate quantities of
12
C–MEL and
13
C
3
–MEL, as well as
12
C–CYA and
13
C
3
–CYA,
respectively, should have a mass ratio as similar as possible. The vessel was placed in
an ultrasonic bath for 30 min, mixed for another 30 min using an overhead shaker, and
centrifuged at RCF = 12,000
×
gfor 20 min (Labofuge
™
400, Fisher Scientific AG, Reinach,
Switzerland). The supernatant formed after centrifugation was filtered through a 0.45
µ
m
Filter (PP w/GMF, Whatman
™
, Huberlab AG, Industriestrasse 123, Aesch, Switzerland)
and transferred to vials for LC–MS analysis.
2.4. 2D–HILIC–ESI–MS/MS Analysis
In the 2D chromatography, only a part of the peak in 1D is cut out and running over
a second column, whereby less matrix contaminants enter the MS system. Furthermore,
just minor sample pretreatment can be applied as well, which is crucial for a precise
determination of the signal ratios with a large set of samples and multiple injections. Crude
infant formula solutions were analyzed directly by 2D–HILIC–ESI–MS/MS. Calibration
curves were obtained by injecting different concentrations of the standards, and the areas
obtained were used to plot a linear curve. For quantitative analysis, linear regression was
used (r2> 0.999 and N= 4).
Chromatographic separation was achieved using an Agilent 1260 Series LC system
(Agilent Technologies Inc., Waldbronn, Germany) coupled with ESI–MS/MS. Due to their
hydrophilic character, a hydrophilic interaction liquid chromatography (HILIC) column
was used. For 1D, the analysis was performed on a TSKgel
®
amide 80 (150 mm, 3 mm
ID, particle size 3
µ
m, Tosoh Bioscience GmbH, Griesheim, Germany) and for 2D on a
TSKgel
®
amide 80 (20 mm, 2 mm ID, particle size 3
µ
m, Tosoh Bioscience GmbH, Griesheim,
Germany), whereby both were maintained at 40 ◦C.
The 1D separation was achieved with a mobile phase consisting of (A) 5 mmol/L
ammonium formate in water (pH 3.0) and (B) acetonitrile and at a flow rate of 0.4 mL/min
with a gradient elution employed with the ratio of (A) and (B) varied as follows: 25% A
(0–4 min)
, 20–95% A (4–4.2 min), 95% A (4.2–7 min), 95–25% A (7–7.1 min), and a re-
equilibration with 25% A (7.1.1–11.5 min) (
≈
4 column void volumes). Sample injection
volume was 1
µ
L. CYA was eluted under these conditions at 2.47 min and MEL at 4.14 min.
Both compounds were cut out for the 2D separation with a sampling time of 0.1 min and a
loop filling of 40 µL.
In the present study, the same mobile phase was used for 1D as well as for 2D, but
with the following gradient for the solvents (A) and (B): 40% A (0–0.4 min), 40–90% A
(0.4–0.6 min), 90% A (0.6–1.4 min), and 40% A (1.4–2.8 min).
The MS detection was performed in multiple reaction monitoring (MRM) mode.
MRM transitions, optimized collision energy (CE), and fragmentor (V) parameters are
listed in Table 1. Shortly, mass detection was set at m/z 127
→
85 for
12
C–MEL and m/z

Foods 2024,13, 2377 5 of 17
130.1
→
86.9 for
13
C
3
–MEL with positive electrospray ionization mode, respectively, at
m/z 128
→
42 for
12
C–CYA and m/z 131
→
43.1 for
13
C
3
–CYA with negative electrospray
ionization mode. Nitrogen was used as curtain, nebulizer, and collision gas. The source
parameters including gas temperature, gas flow, nebulizer, sheath gas temperature, sheath
gas flow, and nozzle voltage were set to 220
◦
C, 6 L/min, 40 psi, 330
◦
C, 10 L/min,
and 1800 V, respectively. MassHunter Workstation (Quantitative Analysis for QQQ 10.1,
Agilent Technologies Inc., Waldbronn, Germany) software was used for system control,
data collection, and processing.
Table 1. The optimized fragmentor and collision energy for each transition of the 2D–LC–MS.
Name Precursor Ion
[m/z]
Product Ion
[m/z]
RT
min
Ion
Polarity
Collision
Energy V
Fragmentor
V
CYA 128.0 42.0 2.7 negative 12 50
13C3–CYA 131.0 43.1 2.7 negative 12 50
MEL 127.0 85.0 6.7 positive 16 113
13C3–MEL 130.1 86.9 6.7 positive 16 113
In general, the chromatographic sequence was set up as followed including the sample
with spiked IS, the reference sample with labeled and unlabeled MEL and CYA sample
including the IS spike and procedural blanks. For every 10 samples, HPLC grade water
was injected into LC–MS/MS to check for carry–over of target chemicals between samples.
2.5. Method Validation
The Eurachem Method Validation Guideline (Eurachem/CITAC) by Ellison, Roesslein,
and Williams [
27
] is the basis for the evaluation process of the LC–MS/MS methods with
respect to selectivity, repeatability, linearity, sensitivity, and robustness. The concept behind
the method validation is based on a single stock solution of the analyte for both parts,
sample and reference. The spike solution for all blends is also from one stock solution. As a
result, the content or concentration is kept constant and all biases and contributions to the
measurement uncertainty can be detected and measured.
Concerning the selectivity, both isotopologues showed no overlap in the monoisotopic
signals of the analytes, which is also crucial for the derivation of the IDMS equation. The
corresponding equations are described in the following sections.
This concept is applied for EMD–IDMS and MSA–IDMS, allowing for the determina-
tion of their performance characteristics including the trueness and precision of the result
including the sample preparation procedure and weighing, the precision of the signal ratio,
and intermediate precision. The concept also allows for the differentiation between single
contributions to the measurement uncertainty, e.g., instrumental bias, repeatability, sample
preparation, as well as the influence of matrix. All binary and ternary blends were prepared
from the same CRM and spike stock solutions, so that the content in sample and reference
is the same (w
X
=w
Z
). In that case, the target value of Equations (1) and (8) becomes
dimensionless. Deviations from the average value of a measurement to this target value can
be referred to as biases. The standard deviation of the repeated measurement of one blend
is used to determine the uncertainty contribution of the instrument u(inst), and the repeated
measurement of the whole set of blends yields the uncertainty contribution of instrument
and preparation u(inst) + u(prep), which also covers biases, e.g., undetected sample loss or
insufficient removal of static charges. The validation of the robustness focuses on a possible
bias caused by non–matched samples. Thus, two repetitions of non–matched standard
addition experiments were conducted with the PT 30110 sample (FERA/FAPAS
®
). The same
sample was analyzed also with the EMD–IDMS method as part of the corresponding PT by
FAPAS
®
, allowing for the cross–validation and comparison of the two different and partly
new methods.
Loading more pages...