
This journal is cthe Owner Societies 2013 Phys. Chem. Chem. Phys., 2013, 15, 15623--15631 15623
Cite this: Phys.Chem.Chem.Phys.,2013,
15, 15623
Interaction of gold nanoparticles with
thermoresponsive microgels: influence of the
cross-linker density on optical properties†
Kornelia Gawlitza,
a
Sarah T. Turner,
a
Frank Polzer,
b
Stefan Wellert,
a
Matthias Karg,*
c
Paul Mulvaney
d
and Regine von Klitzing*
a
The interaction of spherical gold nanoparticles (Au-NPs) with microgels composed of chemically cross-
linked poly-(N-isopropylacrylamide) is reported. Simple mixing of the two components leads to
adsorption of the gold particles onto the microgels. Different loading densities can be achieved by
varying the ratio of gold particles to microgel particles. The adsorption of gold nanoparticles is analysed
by TEM, UV-Vis absorption spectroscopy and SAXS. The influence of the microgel mesh size on the
adsorption of gold nanoparticles is investigated by using microgels with three different cross-linker
densities. The results suggest a strong relationship between the nanoparticle penetration depth and the
cross-linker density. This, in turn, directly influences the optical properties of the colloids due to plasmon
resonance coupling. In addition, information about the mesh size distribution of the microgels is
obtained. For the first time the change in optical properties by varying cross-linker density and
temperature is directly related to the formation of dimers of gold particles, proven by SAXS.
1 Introduction
Microgels are colloidal polymer particles of submicron dimen-
sions with an internal gel-like structure. Microgels based on
poly-N-isopropylacrylamide (p-NIPAM) can respond to stimuli
such as temperature,
1–5
pH
6–8
and ionic strength.
9,10
Hybrid
materials can be prepared by combining such microgels with
inorganic nanoparticles to create multifunctional particles.
11–14
Ideally these hybrid materials combine the responsiveness of
the microgel with the optical, catalytic or magnetic properties
of the embedded inorganic material. Many hybrid materials are
based on the polymer coating of preformed nanoparticles
15–17
or the in situ synthesis of inorganic nanoparticles within a
polymer matrix.
18–20
In both cases the nanoparticles are larger
than the mesh size and are immobilized within the gel matrix.
In the study by Lange et al. it was demonstrated that plasmon
resonance coupling of Au-NPs can be induced by the contraction
of a thermoresponsive p-NIPAM matrix. Simulations show that
the plasmon coupling becomes more pronounced, if the distance
between the nanoparticle surfaces is below 5 nm.
20
However, to
date, only a few studies have dealt with the loading of microgels
with preformed nanoparticles. Lyon et al. loaded microgel parti-
cles with Au-NPs in order to prepare hybrid materials for photo-
thermal patterning of colloidal crystals
21
and for light induced
microlens formation.
22
It was demonstrated that strong illumina-
tion of a small region of a concentrated sample leads to photo-
thermal crystallisation. However, neither the internal structure of
the Au-NP loaded microgels nor any plasmon coupling effects
during the volume phase transition of the Au-NPs were investi-
gated. Kumacheva et al. attached gold nanorods to copolymer
microgels
23
and showed that laser excitation of the longitudinal
plasmon resonance of the gold nanorods can be used to induce a
collapse of the microgel core. However, the optical properties of
the hybrid particles during the volume phase transition were not
discussed. Using an approach similar to that of Kumacheva et al.,
polyelectrolyte-coated gold nanorods were attached at the surface
of oppositely charged microgels by Karg et al.
24,25
and the optical
properties of the gold nanorods were studied as a function of
microgel swelling. The microgel collapse led to a significant
decrease in the surface area, thereby reducing the distance
between the attached gold nanorods. Plasmon coupling was
observed below a certain nanorod spacing and the longitudinal
plasmon resonance was found to be significantly redshifted.
a
Technical University of Berlin, Stranski-Laboratory for Physical and
Theoretical Chemistry, Institute of Chemistry, 10623 Berlin, Germany.
E-mail: klitzin[email protected]
b
Humboldt University Berlin, Institute of Physics, TEM Group, 12489 Berlin,
Germany
c
University of Bayreuth, Physical Chemistry, 95440 Bayreuth, Germany.
E-mail: matthias.karg@uni-bayreuth.de
d
University of Melbourne, Bio21 Institute & School of Chemistry, Parkville,
Victoria, 3010, Australia
† Electronic supplementary information (ESI) available. See DOI: 10.1039/
c3cp51578h
Received 12th April 2013,
Accepted 22nd July 2013
DOI: 10.1039/c3cp51578h
www.rsc.org/pccp
PCCP
PAPER
Published on 23 July 2013. Downloaded by TU Berlin - Universitaetsbibl on 29/03/2016 10:46:10.
View Article Online
View Journal
| View Issue
15624 Phys. Chem. Chem. Phys., 2013, 15, 15623--15631 This journal is cthe Owner Societies 2013
In the present paper, the plasmon coupling induced by
increase in temperature, Au-NPs concentration and/or cross-
linker density is directly related to the formation of dimers of
Au-NPs. In addition, the Au-NP distribution is used to monitor
the local polymer density within the microgel particles. Citrate
stabilised, spherical gold nanoparticles are physically entrapped
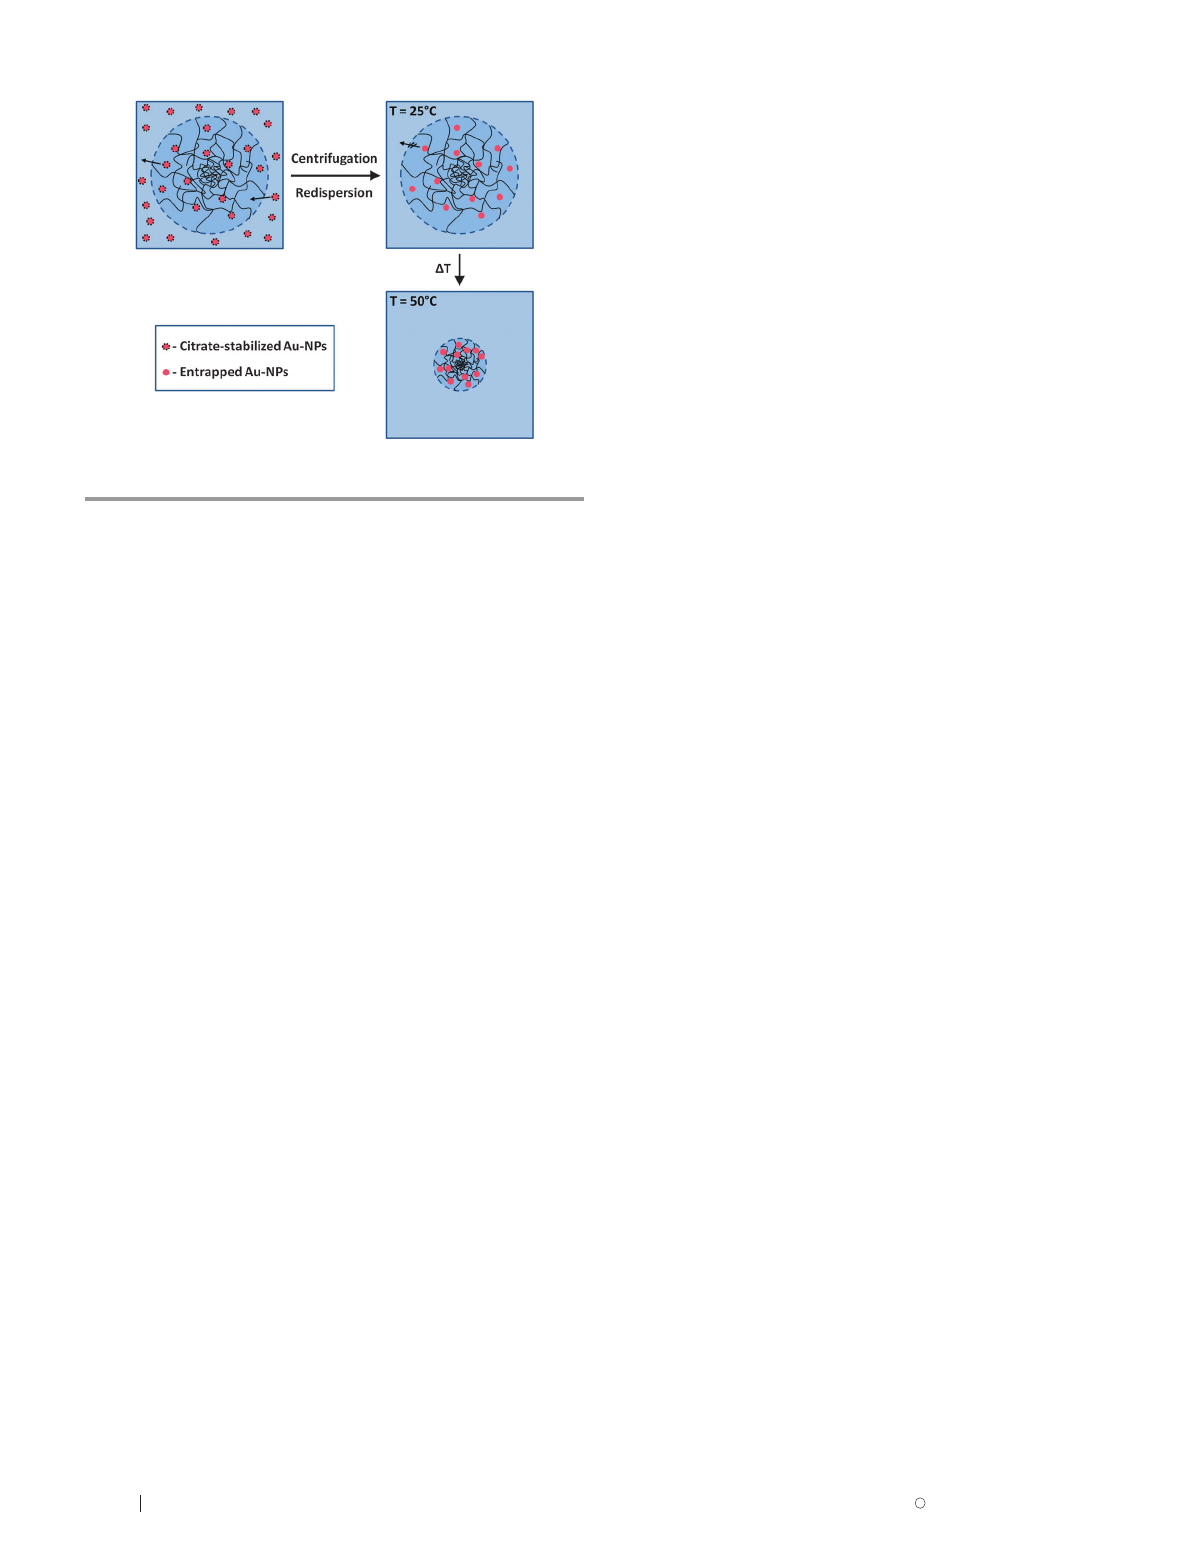
in chemically cross-linked p-NIPAM microgels, as shown in Fig. 1.
UV-Vis absorption spectroscopy is used to monitor changes in the
surface plasmon resonance of the Au-NPs upon loading into the
microgels. Depending on the loading density, plasmon resonance
coupling is observed. This coupling is also strongly dependent on
thedegreeofcross-linkingaswellastheswellingstateofthe
microgels. Transmission electron microscopy (TEM) is used to
study the penetration depth of the Au-NP and dynamic light
scattering (DLS) is used to investigate the swelling behaviour of
the hybrid particles. Structural changes in the microgel samples
are also followed by temperature-dependent SAXS measurements.
Here, the high contrast between the Au-NPs and the polymer–
water-matrix is beneficial.
2 Experimental methods
2.1 Materials
N-Isopropylacrylamide (97%) (NIPAM) was purchased from
Sigma-Aldrich (Munich, Germany). N,N0-Methylenebis(acrylamide)
(MBA) (Z99.5%), potassium peroxodisulfate (KPS) (Z99%),
gold(III) chloride hydrate (HAuCl
4
,Z49%) and sodium citrate
dihydrate (>99%) were from Fluka (Munich, Germany). NIPAM
was purified by recrystallisation in n-hexane and all other chemicals
were used as received. A three-stage Millipore Milli-Q Plus 185
purification system was used for water purification.
2.2 Preparation techniques
2.2.1 Synthesis of p-NIPAM microgel particles. Microgel
particles with cross-linker concentrations of 0.25 mol%
(p-NIPAM
0.25
), 5 mol% (p-NIPAM
5
) and 10 mol% (p-NIPAM
10
)
were synthesised by surfactant-free precipitation polymerisation
according to the protocol reported by Pelton and Chibante.
26
Briefly, 1.132 g of the monomer NIPAM (0.01 mol) and the
desired amount of the crosslinker MBA were dissolved in
100 mL of water in a three-neck flask. The temperature of the
solution was increased to 70 1C and degassed for 30 min.
Afterwards, 1 mL of an aqueous solution of KPS (0.08 M) was
added to the mixture while stirring continuously. After 4 h of
reaction time the temperature was decreased to room temperature
and the mixture was stirred overnight under an N
2
-atmosphere.
The crude microgel particles were purified by filtering over glass
wool, dialysing for 2 weeks with daily water exchange and finally
freeze drying the particles at 85 1Cand110
3
bar for 48 h.
2.2.2 Synthesis of gold nanoparticles. Gold nanoparticles
(Au-NPs) were synthesised using the well known method of
Enu
¨stu
¨n and Turkevich.
27
All glassware involved in the synthesis
was carefully cleaned with aqua regia. Briefly, 5 mL of a hot
citrate solution (0.6 wt%) were added to 100 mL of a boiling gold
salt solution (5 10
4
MHAuCl
4
) under vigorous stirring. The
growth of the Au-NPs was continued for 17 min leading to a deep
red dispersion. Finally, the solution was cooled down to room
temperature with continuous stirring.
2.2.3 Loading p-NIPAM microgel particles with Au-NPs. The
incorporation of the Au-NPs into the microgels was achieved by
adding 0.943 mL of the Au-NPs to 0.057 mL of p-NIPAM microgel
solution, resulting in a concentration of 1.9 10
15
Au-NPs per litre.
The concentration of the microgel particles was adjusted to yield
Au-NP loadings of either 241 or 1133 Au-NPs per microgel particle.
This mixture was homogenised for 10 min using a vortex mixer and
then centrifuged at 8000 rpm for 4 min. The residue obtained
was then redispersed in 1 mL water. This washing procedure
was repeated two times.
2.3 Characterisation methods
2.3.1 Light scattering. The swelling behaviour of the pure
microgel particles and the Au-NP loaded microgels was inves-
tigated via DLS. The correlation functions were recorded at a
constant scattering angle of 601using an ALV goniometer setup
with a HeNe laser as the light source (l= 632.8 nm, 35 mW).
The correlation functions were generated with an ALV/LSE-5004
correlator followed by analysis using inverse Laplace transfor-
mation (CONTIN
28
). The measurements were carried out over a
temperature range from 15 1Cto501C using a thermostated
toluene bath. In addition, DLS measurements at 15 1C and 50 1C
were done at angles from 301to 601with 151in between.
Static Light Scattering (SLS) data were recorded at scattering
angles from 171to 371in 21steps using an ALV/CGS-3 compact
goniometer system equipped with an ALV/LSE-5004 correlator
to determine the molecular weight of the polymer particles.
The concentration of the polymer particles was varied from
110
6
gg
1
to 7 10
6
gg
1
. The measurements were
recorded at 25 1C using a Huber Compatible Control thermo-
stat. A He–Ne laser (l= 632.8 nm, 35 mW) was used and the
laser light was polarised vertically with respect to the instru-
ment table.
Zeta potential measurements were carried out with a Malvern
Zetasizer NanoZS (l= 633 nm, 4 mW) using highly diluted,
Fig. 1 Scheme of the adsorption process of gold nanoparticles by microgel
particles.
Paper PCCP
Published on 23 July 2013. Downloaded by TU Berlin - Universitaetsbibl on 29/03/2016 10:46:10.
View Article Online

This journal is cthe Owner Societies 2013 Phys. Chem. Chem. Phys., 2013, 15, 15623--15631 15625
aqueous microgel dispersions and the as-synthesized gold
nanoparticle dispersion. The temperature during the measure-
ments was 25 1C.
2.3.2 UV-Vis spectroscopy. UV-Vis spectra were collected
using a Perkin Elmer Lambda 35 UV-Vis spectrophotometer at a
temperature of 25 1C. To obtain temperature dependent UV-Vis
spectra in a range from 20 1Cto501C a Cary 50 spectro-
photometer was used. All spectra were recorded in standard
10 mm quartz cells (Hellma, Germany).
2.3.3 Transmission electron microscopy. TEM specimens
were prepared using 5 mL of solution (see preparation techni-
ques for concentrations used) on a TEM copper grid with
carbon support film (200 mesh, Science Services, Munich,
Germany). The carbon coated copper grids were pretreated
using 10 seconds of a glow discharge. The excess of liquid
was blotted with a filter paper after 2 minutes. The remaining
liquid film on the TEM grid was dried at room temperature for
at least one hour. The specimen was inserted into the sample
holder (EM21010, JEOL GmbH, Eching, Germany) and trans-
ferred to a JEOL JEM 2100 (JEOL GmbH, Eching, Germany). The
TEM was operated at an acceleration voltage of 200 kV. All images
were recorded digitally using a bottom-mounted 4k 4k CMOS
camera system (TemCam-F416, TVIPS, Gauting, Germany) and
processed with a digital imaging processing system (EM-Menu4.0,
TVIPS, Gauting, Germany). The final image analysis was com-
pleted using ImageJ 1.42q. The number of adsorbed gold nano-
particles was determined by counting the nanoparticles in ten
individual microgel particles.
Cryo-TEM specimens were vitrified by plunging the samples
into liquid ethane using an automated plunge freezer (Vitrobot
Mark IV, FEI Deutschland GmbH, Frankfurt a. M., Germany).
The lacey carbon grids were pretreated for 10 seconds with glow
discharge. 5 mL of the sample solution was pipetted onto a TEM
copper grid with lacey carbon support film (200 mesh, Science
Services, Munich, Germany). The liquid was blotted with a filter
paper 30 seconds after application of the solution using a 0 blot
force for 1 second. No waiting or drain times were used.
After vitrification the specimen was inserted into a pre-cooled
high-tilt cryo transfer sample holder (Gatan 914, Gatan, Eching,
Germany) and transferred into a JEOL JEM 2100 (JEOL GmbH,
Eching, Germany). The TEM conditions remained the same
as above.
2.3.4 Small angle X-ray scattering (SAXS). SAXS measure-
ments were carried out using a SAXSess mc
2
system (Anton Paar
KG, Graz, Austria). The system is equipped with a sealed tube
microsource operated at 40 kV and 50 mA generating Cu-K
a
radiation having a wavelength of 0.154 nm. The instrument was
aligned in line-collimation operational mode. For the initial
data treatment the Saxsquant 3.5 software package was used.
Desmearing was carried out by including the measured beam
length profile in the desmearing procedure. Data were corrected
for dark current and scattering from the blank cell. The samples
were measured in a 1 mm quartz capillary and equilibrated for
15 min at 20 1Cand501C. The SASfit software (by J. Kohlbrecher
from the Paul Scherrer Institute, Villigen, Switzerland) was used
for data fitting.
3 Results
3.1 Characterisation of p-NIPAM microgel particles
Three p-NIPAM microgel systems with nominal cross-linker con-
centrations of 0.25, 5 and 10 mol% were prepared by surfactant-
free, precipitation polymerisation. For the sake of clarity, the
samples are denoted p-NIPAM
x
where xdescribes the mol% of
MBA. The hydrodynamic radii (R
H
)weremeasuredbyDLSand
results for 25 1Cand501CarepresentedinTable1.Thedetailed
swelling behaviour of the thermoresponsive microgels will be
presented in the Discussion section. The hydrodynamic radii of
the microgels have to be compared at 50 1Cwheretheyarefully
collapsed, as during polymerization. Interestingly, the hydro-
dynamic dimensions of the microgel system with the lowest
cross-linker density (p-NIPAM
0.25
) are significantly smaller than
those of the p-NIPAM
5
and p-NIPAM
10
particles. This is attributed
to less efficient polymerization when a very low concentration of
the cross-linker is present.
The swelling behaviour of the microgel particles is controlled
by the connectivity of the polymer and may be characterised by
the deswelling ratio a, as shown in eqn (1).
a¼VH
VH;0
¼RH
3
RH;03(1)
Here R
H3
and R
H,03
are the hydrodynamic radii in the collapsed
and swollen state, respectively. In our case the hydrodynamic
radii at 50 1C and 15 1C were used to calculate the deswelling
ratios. The values of aincrease linearly with increasing MBA
content as shown in Table 1. Due to the higher connectivity in the
polymer network at higher MBA concentrations, the microgel parti-
cles become less elastic and therefore the deswelling ratio increases.
This behaviour of p-NIPAM microgel particles has been intensively
studied by, e.g. Kratz et al.
29,30
The molecular weight of the p-NIPAM
microgels was determined using SLS and Zimm-plot analysis. A
residual water content of around 10%, which was determined
by Karl–Fischer-titration, and a refractive index increment
dn/dc= 0.167 cm
3
g
1
were used in the calculations.
31
The
Zimm-plots can be found in the ESI† (Fig. S1). Table 1 sum-
marises the molecular weights of the three microgels. As
expected, the lowest molecular weight is found for p-NIPAM
0.25
(1.7 10
9
g mol
1
), whereas the values for p-NIPAM
5
and
p-NIPAM
10
are somewhat higher, in good agreement with the
R
H
values.
Zeta potential measurements were performed at 25 1Cin
order to estimate the p-NIPAM surface charge density. Small,
negative values of 71 mV were measured for all three
microgels (see Table 1). This negative charge is due to the
Table 1 Hydrodynamic radii at 25 1C and 50 1C, deswelling ratios, molecular
weights and zeta potentials of p-NIPAM microgel particles with MBA-contents of
0.25, 5 and 10 mol%
MBA
[%]
R
H,251C
[nm]
R
H,501C
[nm] aM
W
[g mol
1
]z[mV]
0.25 239 11 112 5 0.07 1.7 10
9
710
7
6.5 0.5
5 281 33 169 1 0.15 8.4 10
9
310
8
5.7 0.5
10 249 10 173 6 0.25 6.9 10
9
110
8
7.9 0.9
PCCP Paper
Published on 23 July 2013. Downloaded by TU Berlin - Universitaetsbibl on 29/03/2016 10:46:10.
View Article Online
15626 Phys. Chem. Chem. Phys., 2013, 15, 15623--15631 This journal is cthe Owner Societies 2013
anionic radical initiator used for the polymerisation. Note, that zeta
potential values are rather difficult to interpret for large, gel-like
particles such as p-NIPAM microgels and therefore zserves only as
an indication of the slightly negative microgel surface charge.
3.2 Characterisation of Au-NPs
The Au-NPs were characterised using TEM, UV-Vis spectroscopy
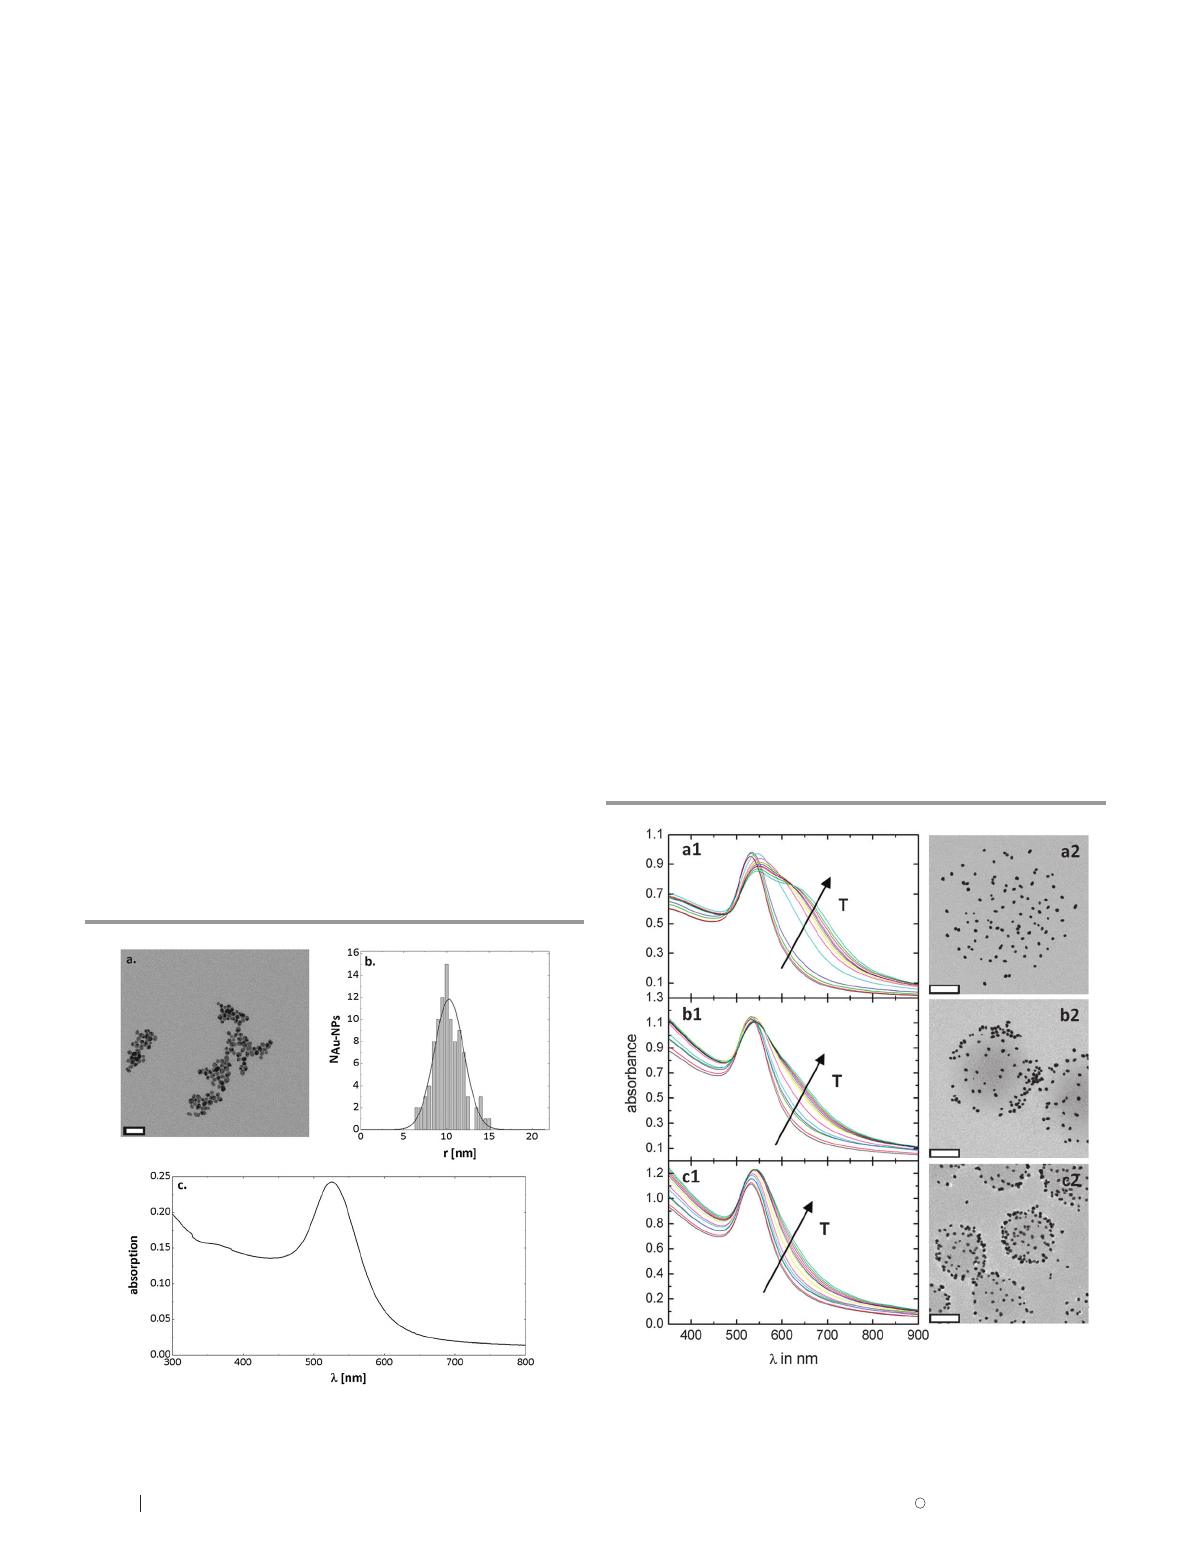
and SAXS. Fig. 2a shows a representative TEM image of the nearly
spherical particles. Fig. 2b shows the size distribution of the Au-NPs
with an average radius of 10.3 4.0nmobtainedfrommeasuring
the size of at least 100 individual particles from different TEM
images. A UV-Vis spectrum recorded from aqueous dispersion at
25 1C is presented in Fig. 2c. The spectrum shows the typical localised
surface plasmon resonance leading to an absorption maximum at
E525 nm. Using the optical density of gold the number concen-
tration of Au-NPs could be calculated (2 10
15
particles per L).
The zeta potential of the citrate stabilised Au-NPs was
measured from dilute aqueous dispersion at 25 1C and yielded
a surface potential of 30 2 mV.
In addition, the particle size, size distribution and the shape
of the pure Au-NPs were all determined by SAXS measurements
performed at 20 1C. The obtained scattering profile could be
successfully fitted using a form factor for polydisperse spheres,
resulting in a particle radius of 12.8 2.4 nm. Since the measure-
ments were performed in the highly dilute regime, any structure
factor contribution could be neglected (S(Q)E1). The obtained
radius is in reasonable agreement with the average radius obtained
from TEM, taking the standard deviation into account. The
corresponding scattering curve is shown in the ESI† (Fig. S2).
3.3 Loading p-NIPAM microgel particles with Au-NPs
Two different concentrations of Au-NPs were used to load
the p-NIPAM microgel particles. The molecular weight of the
microgels (Table 1) allows calculation of the number density of
microgel particles in the dispersion. At the same time the
number concentration of the Au-NPs dispersion can be calcu-
lated using the extinction cross-section of gold. Therefore, the
theoretical number of Au-NPs per p-NIPAM microgel particle
could be calculated. For experiments with a low degree of
loading the ratio of Au-NPs per microgel particle was kept
constant at 241 for the different microgels. In contrast the ratio
was 1133 for high loading experiments.
3.3.1 Low loading regime. In order to study the influence
of the swelling state of the microgel on the optical properties of
the entrapped Au-NPs, temperature dependent UV-Vis absor-
bance measurements were performed. The results are shown in
Fig. 3 (left column).
The TEM images (Fig. 3, right column) show that the Au-NPs
are more concentrated on the outside of the microgel particle
for the p-NIPAM
5
and p-NIPAM
10
particles (Fig. 3b2 and c2)
compared to p-NIPAM
0.25
particles (Fig. 3a2). Furthermore, image
analysis reveals an average radius of the Au-NPs of 10.3 nm,
which is in good agreement with the radius obtained for the bare
gold nanoparticles prior to mixing with the microgels. We define
the loading efficiency as the percentage of gold particles observed
to be adsorbed to each gold particle compared to the nominal
number added to the solution. As seen in Table 2, the loading
efficiency is around 37% for all three p-NIPAM microgels.
Taking the error of E10% into account, the loading efficiency
can be considered to be constant for the different cross-linker
concentrations.
Fig. 2 TEM-image (scale bar: 80 nm) (a), size distribution (b) and UV-Vis spectrum
(c) of synthesised Au-NPs.
Fig. 3 TEM images (scale bar: 200 nm) and UV-Vis spectra of p-NIPAM
0.25
(a1 and a2), p-NIPAM
5
(b1 and b2) and p-NIPAM
10
(c1 and c2) for the low
loading regime of Au-NPs.
Paper PCCP
Published on 23 July 2013. Downloaded by TU Berlin - Universitaetsbibl on 29/03/2016 10:46:10.
View Article Online
This journal is cthe Owner Societies 2013 Phys. Chem. Chem. Phys., 2013, 15, 15623--15631 15627
The difference in Au-NP loading and in plasmon coupling of
the p-NIPAM
0.25
sample is of particular interest. Although the
microgel particle is only barely visible by electron microscopy
due to its very low contrast, the circular assembly of Au-NPs
enables the microgel particle to be easily recognised in the
images, and even allows the size to be estimated. UV-Vis spectra
at different temperatures are presented in Fig. 3a1. Compared
to the spectrum of bare Au-NPs (Fig. 2c), the absorption
maximum is redshifted by E10 nm to 535 nm at low tempera-
tures, where the p-NIPAM particles are in the swollen state. This
redshift is attributed to the increase in the local refractive index
environment in the presence of p-NIPAM chains. If spectra
recorded at different temperatures are compared, two effects
can be observed: (1) the plasmon resonance at 535 nm redshifts
with increasing temperature, which is related to a further
refractive index increase during the microgel collapse. (2) A
shoulder appears at E675 nm when the temperature increases.
This shoulder is related to plasmon coupling between Au-NPs.
During the microgel collapse the distance between neighbouring
Au-NPs decreases and plasmon resonance coupling can occur
if this distance is small enough. Hence, the spectra at higher
temperatures are a superposition of the spectra of isolated
Au-NPs and aggregates of Au-NPs present in the microgel.
Due to the rather low loading density these aggregates are
assumed to be almost exclusively pairs of Au-NPs.
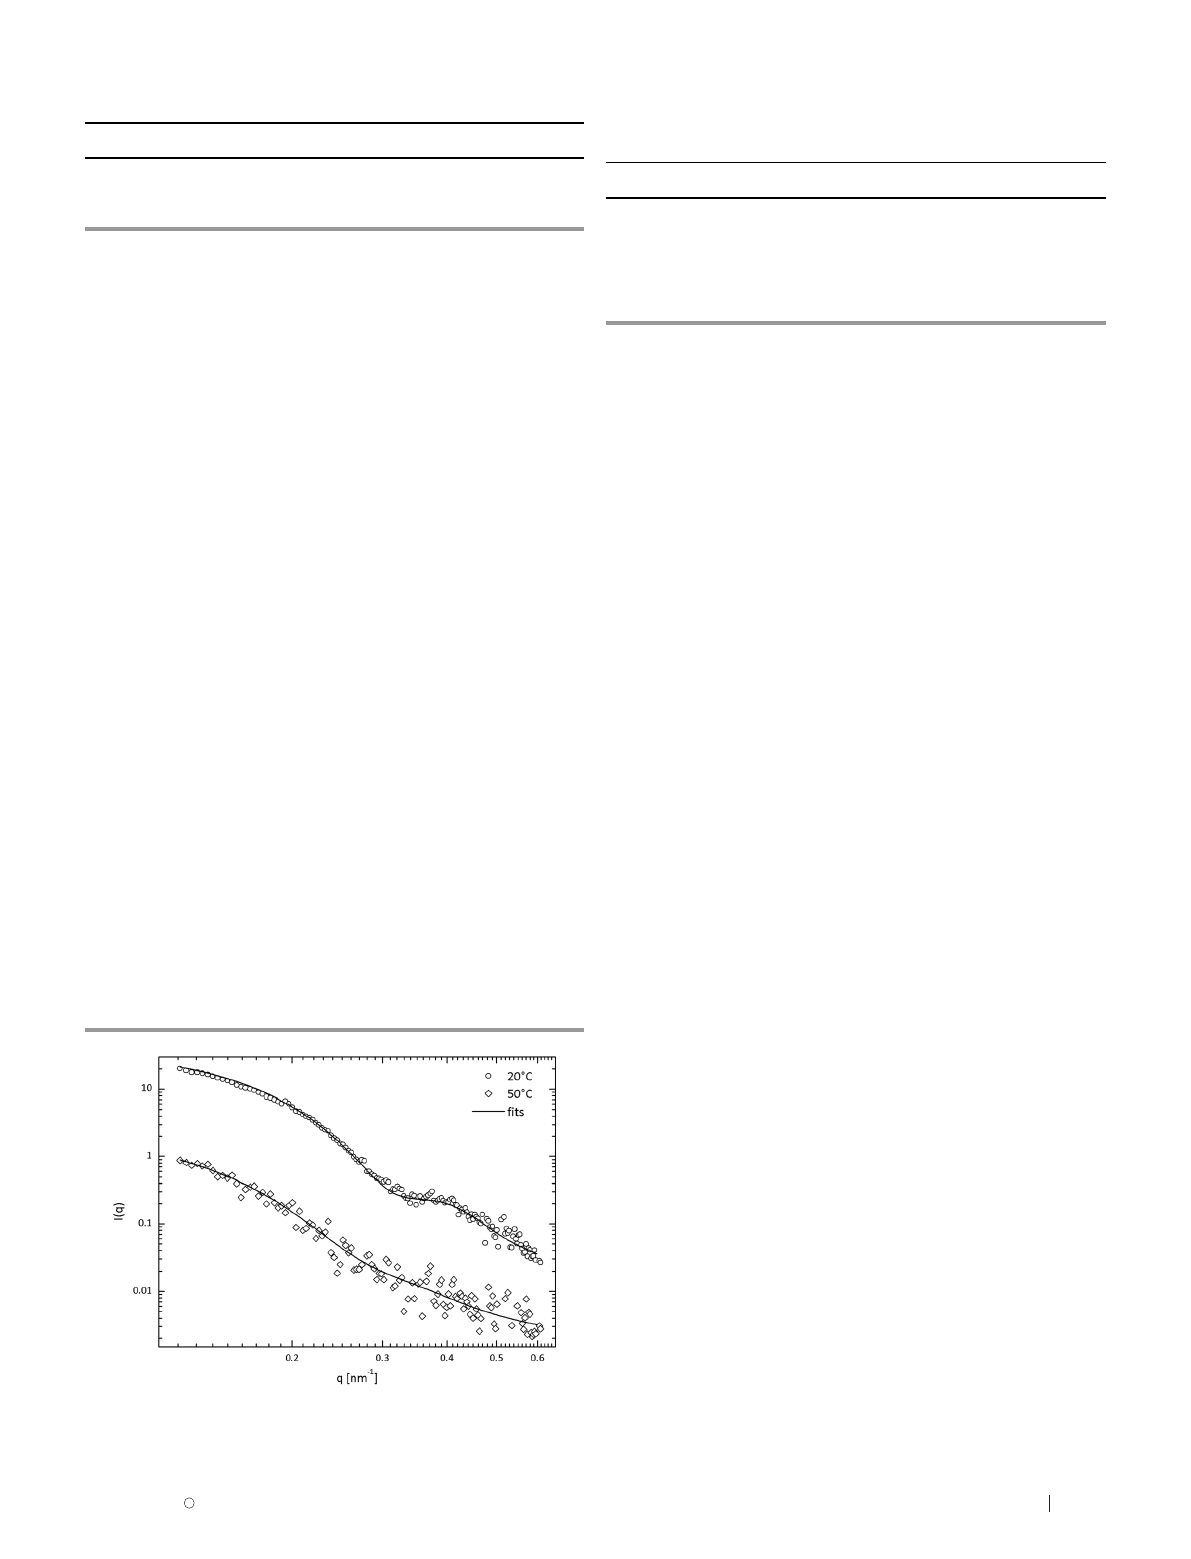
To further investigate the origin of the observed, strong
plasmon resonance coupling at temperatures above the VPTT,
SAXS measurements of all three loaded microgels were done at
20 1C and 50 1C. The measured scattering curves of Au loaded
p-NIPAM
10
are presented in Fig. 4.
Due to the huge difference in the electron density of Au-NPs
and the polymer–water-matrix, the X-ray scattering from Au
dominates the signal, while the polymer particles and water
contribute only weakly. Due to the long measurement time,
a small amount of aggregation of the Au-NPs occurs, which
leads to sedimentation and a decrease in the intensity signal
above the VPTT. Assuming no contribution from the structure
factor, the data can be well described using a form factor for
polydisperse, homogeneous spheres below the VPTT (T=201C).
However, for temperatures above the VPPT, a simple poly-
disperse sphere form factor failed to describe the measured
SAXS profiles. Instead we used a form factor corresponding to
ellipsoids to fit the data, in order to account for gold particle
dimers. Table 3 shows the calculated radii for the spheres and
ellipsoids as well as the ratio of the radius of the semi-principal
axis to the radius of the equatorial axis (n) in the case of
ellipsoids. It is evident that the value of ncorresponds closely
to the expected one for dimers (E2).
3.3.2 High loading regime. The results for hybrid samples
in the high loading regime (1133 Au-NPs per p-NIPAM microgel
particle) are shown in Fig. 5a1 and a2 for p-NIPAM
0.25
,in
Fig. 5b1 and b2 for p-NIPAM
5
and in Fig. 5c1 and c2 for
p-NIPAM
10
.
The TEM-images clearly reveal a substantially higher degree
of Au-NP loading compared to the microgels with less initial
Au-NP added, as expected. The loading efficiencies are pre-
sented in Table 4 and show a slight decrease compared to the
low loading regime (Table 2). This might be an indication for
saturated adsorption at high added loadings of Au-NPs but the
effect is too weak for a strong statement.
For microgels with an MBA content of 5 mol% and 10 mol%,
the Au-NPs are concentrated in the outer part of the polymer
network. This local enhancement in particle numbers is more
evident for the microgels with higher loadings. The UV-Vis
spectra show that even for low temperatures all three loaded
p-NIPAM microgel particles possess a shoulder at longer wave-
lengths than the plasmon resonance at E535 nm. For all three
types of p-NIPAM particles there is an absorption band at
E675 nm, which increases with increasing temperature, i.e.,
when the microgel shrinks. Furthermore, for p-NIPAM
0.25
a
third shoulder at E750 nm appears in the UV-Vis spectrum at
high temperatures.
The scattering curves obtained from the SAXS measure-
ments and the corresponding fits for Au loaded p-NIPAM
10
in
the high loading regime are shown in Fig. 6.
Table 2 Loading efficiency for the low loading regime of Au-NPs
MBA [%] N
Au,max
N
Au,adsorbed
N
Au,adsorbed
[%]
0.25 241 99 41
5 241 86 36
10 241 83 34
Fig. 4 Saxs-scattering curves and the corresponding fits of p-NIPAM
10
loaded
with gold nanoparticles in the low loading regime at 20 1C and 50 1C.
Table 3 Radii, amounts of individual and pairs of Au-NPs and the ratio (n)ofthe
radius of the semi-principal axis to the radius of the equatorial axis obtained by
SAXS-measurements for the low loading regime
MBA [%] T[1C] R[nm] x
sphere
[%] x
ellipsoid
[%] n
0.25 20 13.1 100 0 1
0.25 50 13.2 0 100 1.9
5 20 13.0 100 0 1
5 50 13.8 78 22 2.2
10 20 13.2 100 0 1
10 50 13.0 84 16 1.9
PCCP Paper
Published on 23 July 2013. Downloaded by TU Berlin - Universitaetsbibl on 29/03/2016 10:46:10.
View Article Online
Loading more pages...