How suitable are clinical vignettes for the
evaluation of symptom checker apps? A test
theoretical perspective
Marvin Kopka
1,2
, Markus A Feufel
1
, Eta S Berner
3
and Malte L Schmieding
2
Abstract
Objective: To evaluate the ability of case vignettes to assess the performance of symptom checker applications and to suggest
refinements to the methodology used in case vignette-based audit studies.
Methods: We re-analyzed the publicly available data of two prominent case vignette-based symptom checker audit studies
by calculating common metrics of test theory. Furthermore, we developed a new metric, the Capability Comparison Score
(CCS), which compares symptom checker capability while controlling for the difficulty of the set of cases each symptom
checker evaluated. We then scrutinized whether applying test theory and the CCS altered the performance ranking of the
investigated symptom checkers.
Results: In both studies, most symptom checkers changed their rank order when adjusting the triage capability for item
difficulty (ID) with the CCS. The previously reported triage accuracies commonly overestimated the capability of symptom
checkers because they did not account for the fact that symptom checkers tend to selectively appraise easier cases (i.e.,
with high ID values). Also, many case vignettes in both studies showed insufficient (very low and even negative) values
of item-total correlation (ITC), suggesting that individual items or the composition of item sets are of low quality.
Conclusions: A test–theoretic perspective helps identify previously undetected threats to the validity of case vignette-based
symptom checker assessments and provides guidance and specific metrics to improve the quality of case vignettes, in par-
ticular by controlling for the difficulty of the vignettes an app was (not) able to evaluate correctly. Such measures might prove
more meaningful than accuracy alone for the competitive assessment of symptom checkers. Our approach helps elaborate
and standardize the methodology used for appraising symptom checker capability, which, ultimately, may yield more reli-
able results.
Keywords
Digital health, self-triage, urgency assessment, patient-centered care, care navigation, symptom checker, test theory,
methodology, case vignettes
Submission date: 1 March 2023; Acceptance date: 28 July 2023
Introduction
In recent years, symptom checkers have been developed as
smartphone applications (“apps”) or web-browser based
online applications to aid laypersons in self-assessing their
medical complaints.
1
These tools ask users a series of ques-
tions about their current medical complaints and provide
potential diagnoses (app-assisted self-diagnosis) and/or
guidance on where to seek care as output (app-assisted
self-triage).
2
They are typically used at home when seeking
1
Department of Psychology and Ergonomics (IPA), Division of Ergonomics,
Technische Universität Berlin, Berlin, Germany
2
Institute of Medical Informatics, Charité –Universitätsmedizin Berlin, cor-
porate member of Freie Universität Berlin and Humboldt-Universität zu
Berlin, Berlin, Germany
3
Department of Health Services Administration, University of Alabama at
Birmingham, Birmingham, AL, USA
Corresponding author:
Marvin Kopka, Division of Ergonomics, Technische Universität Berlin, Straße
des 17. Juni 135, 10623 Berlin, Germany.
Email: marvin.kopka@tu-berlin.de
Creative Commons Non Commercial CC BY-NC: This article is distributed under the terms of the Creative Commons Attribution-NonCommercial
4.0 License (https://creativecommons.org/licenses/by-nc/4.0/) which permits non-commercial use, reproduction and distribution of the work
without further permission provided the original work is attributed as specified on the SAGE and Open Access page (https://us.sagepub.com/en-us/nam/
open-access-at-sage).
Original Research
DIGITAL HEALTH
Volume 9: 1–18
© The Author(s) 2023
Article reuse guidelines:
sagepub.com/journals-permissions
DOI: 10.1177/20552076231194929
journals.sagepub.com/home/dhj

health information or deciding where or whether to seek
care.
1,3
As the use of such patient-facing clinical decision
support systems has become increasingly popular,
3–5
it
becomes an important task for researchers and regulators
to develop methods to assess the accuracy and safety of
their advice.
6
Currently, symptom checker apps are com-
monly tested by their developers or independent research-
ers. Though some studies are conducted in a real life
setting where patients enter their own complaints into
the studied symptom checker,
7
most studies rely on
researchers, physicians or laypersons inputting a curated
set of patient descriptions summarized in clinical case
vignettes. Both when comparing symptom checkers
against each other and when assessing a single symptom
checker, metrics for triage and diagnostic accuracy, and
sometimes sensitivity, specificity and safety of triage
recommendations (i.e., not giving advice of less urgency
than appropriate for the symptoms) are determined.
However, studies vary substantially in the details of
their methods and the scope of the case vignettes and
symptom checkers considered.
A recent systematic review revealed that currently the
safety and accuracy of symptom checkers vary not only
substantially between individual apps,
8
but also across
the published studies assessing them. Among the possible
reasons for this variation between studies are differences
in the selected sample of apps (i.e., different apps or ver-
sions of them are being assessed) and methodological
differences, for example, how urgency levels are defined
or on which types of complaints the apps are tested.
8
For example, some authors evaluate symptom checkers
using vignettes on a broad variety of general symp-
toms,
1,2,9–13
while others focus on vignettes with symptoms
or diseases from specificfields such as rheumatology or
hepatitis C.
14–20
Another methodological difference is the source of input
used for creating the case vignettes based on either real-
world patient histories
10,14,15,17,19,20
or descriptions of ficti-
tious patients.
1,2,9,11–13,18,21
Each case vignette is usually
created using various medical materials and is reviewed
by multiple physicians to obtain a gold standard solution.
1
While this approach originates in the evaluation of
medical professionals
22
andtransferringittotheevalu-
ation of symptom checkers seems reasonable, the validity
of this practice has been questioned.
23,24
For example,
Haddad and Tylee
25
developed a test to evaluate school
nurses’recognition of depression and examined the clin-
ical vignettes used for this purpose with a test theory
approach. Though their findings indicate that most of the
items used were appropriate for the authors’purpose,
some were unsuitable for the evaluation—because they
were too easy to solve or did not correlate with the con-
struct—although they were medically correct. Other
studies noting limitations of case vignettes recommended
creating a benchmarking process to assess symptom checker
accuracy
26
and to conduct studies “with greater methodological
rigor and transparency”.
27
To answer this call and because case vignettes are com-
monly used to competitively compare symptom checkers’
safety and accuracy, this paper aims to critically review
this standard practice using a test theoretical perspective.
28
By re-analyzing the data from previously published and
highly influential studies, we determine common metrics
of test theory and use them to evaluate the ability of case
vignettes to audit symptom checkers’performance. The
three questions we address are as follows: 1. Using metrics
from test theory, how suitable are case vignettes to assess
symptom checker performance? 2. If we account for low-
quality vignettes, how does this change our interpretation
of the currently published results on symptom checkers’cap-
abilities? 3. In what way can a test theory perspective help
advance the methodology for assessing symptom checkers’
capabilities? Our overall aim is to elaborate on and standard-
ize the evaluation methods for symptom checker audits and
to answer recent calls to improve the validity and reliability
of studies using case vignettes to assess symptom checker
performance.
29
Methods
Design
We conducted a secondary analysis of previously published
data on triage accuracy of symptom checkers (test subjects)
to calculate the common test theoretical metrics of the case
vignettes (test items) used in these studies.
Study inclusion
This study aimed to include papers that are comparable to
one another, highly cited in this field and provide access to
their data. For this reason, only studies focusing on
symptom checkers capable of handling a broad variety
of symptoms and diseases were included (i.e., excluding
studies that focus on specific diseases such as Hepatitis C).
Studies were further required to have used case vignettes
and must have been cited at least 10 times by the time of
our search (from 1 November 2021 until 31 December
2021).
Combinations of the search terms “symptom checker,”
“accuracy,”“reliability,”“self-triage,”and “self-diagnosis”
were entered into the database search engines Web of
Science and Google Scholar, which led to the identification
of 14 studies on symptom checker accuracy. Out of those, 8
did not focus on general symptoms, but specific symptoms
or diseases such as COVID-19
14
or orofacial pain.
21
Of the
remaining 6 studies, one did not use case vignettes
10
and
two were cited no more than 10 times.
2,11
Finally, data
from one study was not available upon request.
12
Thus,
two papers were included in the analysis for this study:
2DIGITAL HEALTH

one conducted by Hill and colleagues
9
and another con-
ducted by Semigran and colleagues.
1
Hill et al. examined the accuracy of symptom checkers
that were publicly available in Australia in 2020 and pro-
vided patients with medical advice based on their symptoms
free of charge. To identify these symptom checkers, they
used search engines and the iOS and Android app stores
to find apps that were available in English, aimed at
patients, and that provided advice on a broad set of diseases.
Some of them were classified as employing Artificial
Intelligence (AI), whereas others used rule-based algo-
rithms.
8,30
Overall, they entered 48 case vignettes into 16
symptom checkers yielding a total of 688 case evaluations,
as most symptom checkers were not able to assess all case
vignettes.
Semigran et al. employed the same approach in 2015 but
searched for symptom checkers worldwide rather than in a
particular country. They did not report on the algorithms
used in the tools. Overall, Semigran et al. used a curated
set of 45 case vignettes with 15 symptom checkers provid-
ing triage advice yielding a total of 532 case evaluations.
Eight of the evaluated symptom checkers were included
in both studies. In its sample of 48 case vignettes, Hill
et al. included modified versions of 30 case vignettes
from the Semigran et al. study. These case vignettes
included both common and uncommon diseases and symp-
toms ranging from low urgency situations for which self-
care would be sufficient to emergency scenarios.
Both studies found that accuracy for triage and diagnosis
was mediocre and highly variable across the set of symptom
checkers in their sample. Moreover, triage accuracy was
dependent on triage level with emergencies more com-
monly classified correctly than low acuity case vignettes.
They also found triage advice to be risk-averse overall,
i.e., the urgency levels of a case were more commonly over-
estimated rather than underestimated. Both author teams
acknowledged several limitations in their methodologies that
pertaintothepresentstudy:1.Theyusedcasevignettesthat
might not capture the complexity of patient complaints in the
real world and 2. they asked a single researcher with a back-
ground in the medical sciences or in public health and with
knowledge about the gold standard solution to the case vignettes
to enter the case vignettes in the symptom checkers rather than a
set of laypeople. They further report that—despite their system-
atic search—they might not have identified all symptom check-
ers that were available at the time.
Other than sharing the same purpose, i.e., supporting
laypersons in self-assessing their symptoms, the studied
symptom checkers do not necessarily have much in
common. The set of symptom checkers evaluated in the
Hill et al. and Semigran et al. studies includes smartphone
and website-based applications, from a wide range of provi-
ders (private companies, health insurance companies, and gov-
ernment bodies) and with different algorithmic approaches
(e.g., Bayesian networks or rule-based logic systems).
Unless the algorithmic approach is self-evident from the user
interface, the exact approach is rarely described by the pro-
vider, though some refer to their app’s reasoning engines as
“artificial intelligence”. Most of the studied symptom checkers
were marketed directly to consumers via app stores or websites
without being integrated into healthcare delivery processes.
Only some were either endorsed or integrated into the care
pathways of healthcare institutions.
We concur with other researchers,
1,2
that triage advice
from symptom checkers is more important when it comes
to assessing their safety and potential impact on healthcare
delivery than their diagnostic suggestions. Thus, we focus
on triage recommendations from symptom checkers in
this study. Since not all symptom checkers appraised all
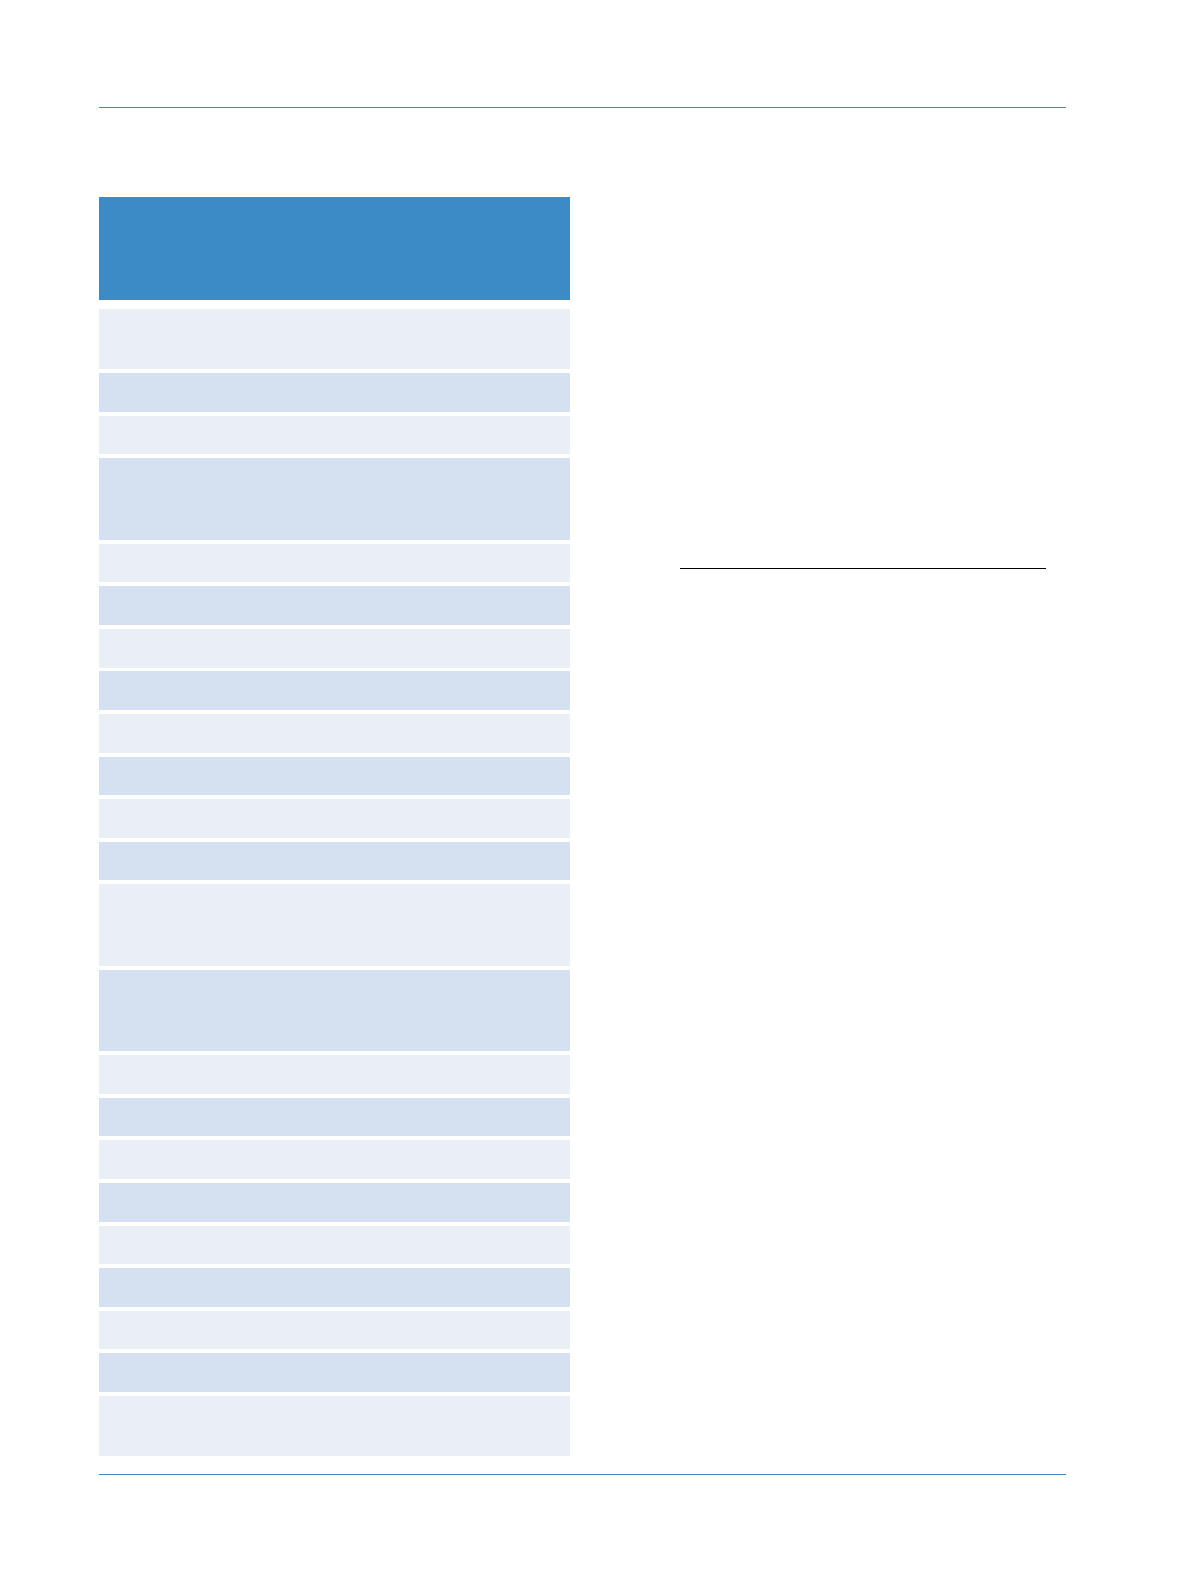
vignettes, Table 1 provides an overview of the symptom
checkers and the number of case vignettes they were
tested with in each study.
Metrics
Though numerous symptom checkers are available and
included in the two studies, their number is rather low
when it comes to validating test items and determining
their test-theory metrics.
31
Thus, we selected two metrics
from classical test theory, which can feasibly be calculated
with a smaller number of data points: ID and part-whole
corrected ITC.
28
Based on these metrics, we constructed
two new measures to competitively re-evaluate the per-
formance of the symptom checkers evaluated in both
studies (i.e., adjusted accuracy and CCS). A graphical over-
view of our procedure can be found in Figure 1.
Metrics from classical test theory on test items (case vignettes)
Item difficulty. ID is a measure of how difficult a test item
iis for the symptom checkers as test subjects.In our case,
this metric reflects the percentage of symptom checkers in
a given study sample that were able to correctly solve
case vignette i. It is calculated using the following formula:
IDi=Ci
Ti
where ID
i
represents the ID of case vignette i,C
i
the abso-
lute number of symptom checkers correctly solving case
vignette iand T
i
the total number of symptom checkers pro-
viding advice to case vignette i(false or correct).
Thus, higher values indicate that the vignette was easier
to solve (i.e., with a value of 1, all symptom checkers could
solve the vignette), while lower values indicate a more dif-
ficult case vignette (i.e., with a value of 0.5, only half of the
sample of symptom checkers evaluating this case vignette
solved it correctly). This metric is relevant to create a
balanced palette of test items, including both difficult and
easy case vignettes to evaluate symptom checkers.
32
Kopka et al. 3
Part-whole corrected item-total correlation. ITC is a
measure of item discrimination used to identify a set of
items that helps reliably compare test subjects’performance
and rule out those items that result in inconsistent perform-
ance patterns. For the purposes of our analysis, this means
that it reflects the degree to which correctly solving a specific
case vignette (test item) is associated with a symptom check-
er’s (test subject’s) accuracy on the remaining case vignettes.
The part-whole corrected ITC is computed by calculating the
accuracy for each symptom checker when the case vignette
in question is omitted. Subsequently, the app’s suggestion
on the omitted case vignette—coded as either true (correct
suggestion) or false (incorrect suggestion)—is correlated
with the respective accuracy excluding this case vignette
across all symptom checkers. It can also be described as
follows:
28
rit(i)=ritSD(x)−
pi(1 −pi)
√
SD(x)2+pi(1 −pi)−2ritSD(x)
pi(1 −pi)
√
where r
it(i)
represents the correlation of the accuracy on
vignette iwith the overall accuracy when vignette iis
omitted, SD(x) is the standard deviation of solving a vignette
correctly, p
i
is the probability that vignette iwas solved cor-
rectly, and r
it
is the point biserial correlation of vignette iwith
the symptom checker’s accuracy twithout omitting any
vignette.
ITC values close to 0 indicate that solving vignette icor-
rectly cannot predict the probability of a symptom checker
to solve the remaining vignettes correctly. High values (up
to a maximum score of 1) indicate that vignette iis suitable
for predicting the overall accuracy of symptom checkers.
Negative ITC values indicate an inverse relationship
between a symptom checker’s overall accuracy and the
accuracy regarding case vignette i. That is, poor-performing
symptom checkers tend to answer vignette icorrectly, while
high-performing symptom checkers tend to appraise case
vignette incorrectly. Hence, ITC values close to zero or nega-
tive indicate that the respective vignette is potentially inad-
equate to assess the performance of a symptom checker,
having little informative value for a competitive comparison
between symptom checkers. For the construction of test
items in validated instruments, only items with ITC values
above 0.2 are considered acceptable according to test
theory, with values closer to 1 being preferable.
33
Also, an
ITC value cannot be calculated if a test item (here, a case
vignette) is solved correctly by either all or none of the test
subjects (here, symptom checkers). According to test
theory, such test items should be excluded from validated
measurement instruments as they provide no value for the
competitive comparison between test subjects.
To further explore the construct validity of this triage
accuracy metric, we also determined each case vignette’s
part-whole corrected ITC by triage level. To do this, we cor-
related the accuracy of each individual vignette with the
Table 1. Information on the symptom checkers and the number of
cases entered in each study.
App
Number of
case vignettes
in Hill et al.
(N =48)
Number of
case vignettes
in Semigran
et al. (N =45)
Children’s Wisconsin Symptom
Checker (CHW)
17 Not assessed
Doctor Diagnose 20 16
Drugs.com 41 42
Drugs.com as a mobile app from
the Google Play store
(Drugs.com Google Play)
41 Not assessed
Early Doc Not assessed 17
Everyday Health 31 Not assessed
Family Doctor 47 41
FreeMD Not assessed 44
Healthdirect 46 Not assessed
HealthlinkBC 48 Not assessed
Healthwise 48 44
Healthy Children 17 15
Harvard Medical School Family
Health Guide (HMS Family
Health Guide)
Not assessed 40
Johns Hopkins All Children’s
Hospital (Hopkins all
Children)
17 Not assessed
Isabel 48 45
iTriage Not assessed 43
National Health Service (NHS) Not assessed 44
St Lukes Online 17 Not assessed
Steps2Care Not assessed 42
Symcat 46 45
Symptify Not assessed 40
Symptomate 31 14
University of Michigan Health
(UofM Health)
45 Not assessed
4DIGITAL HEALTH
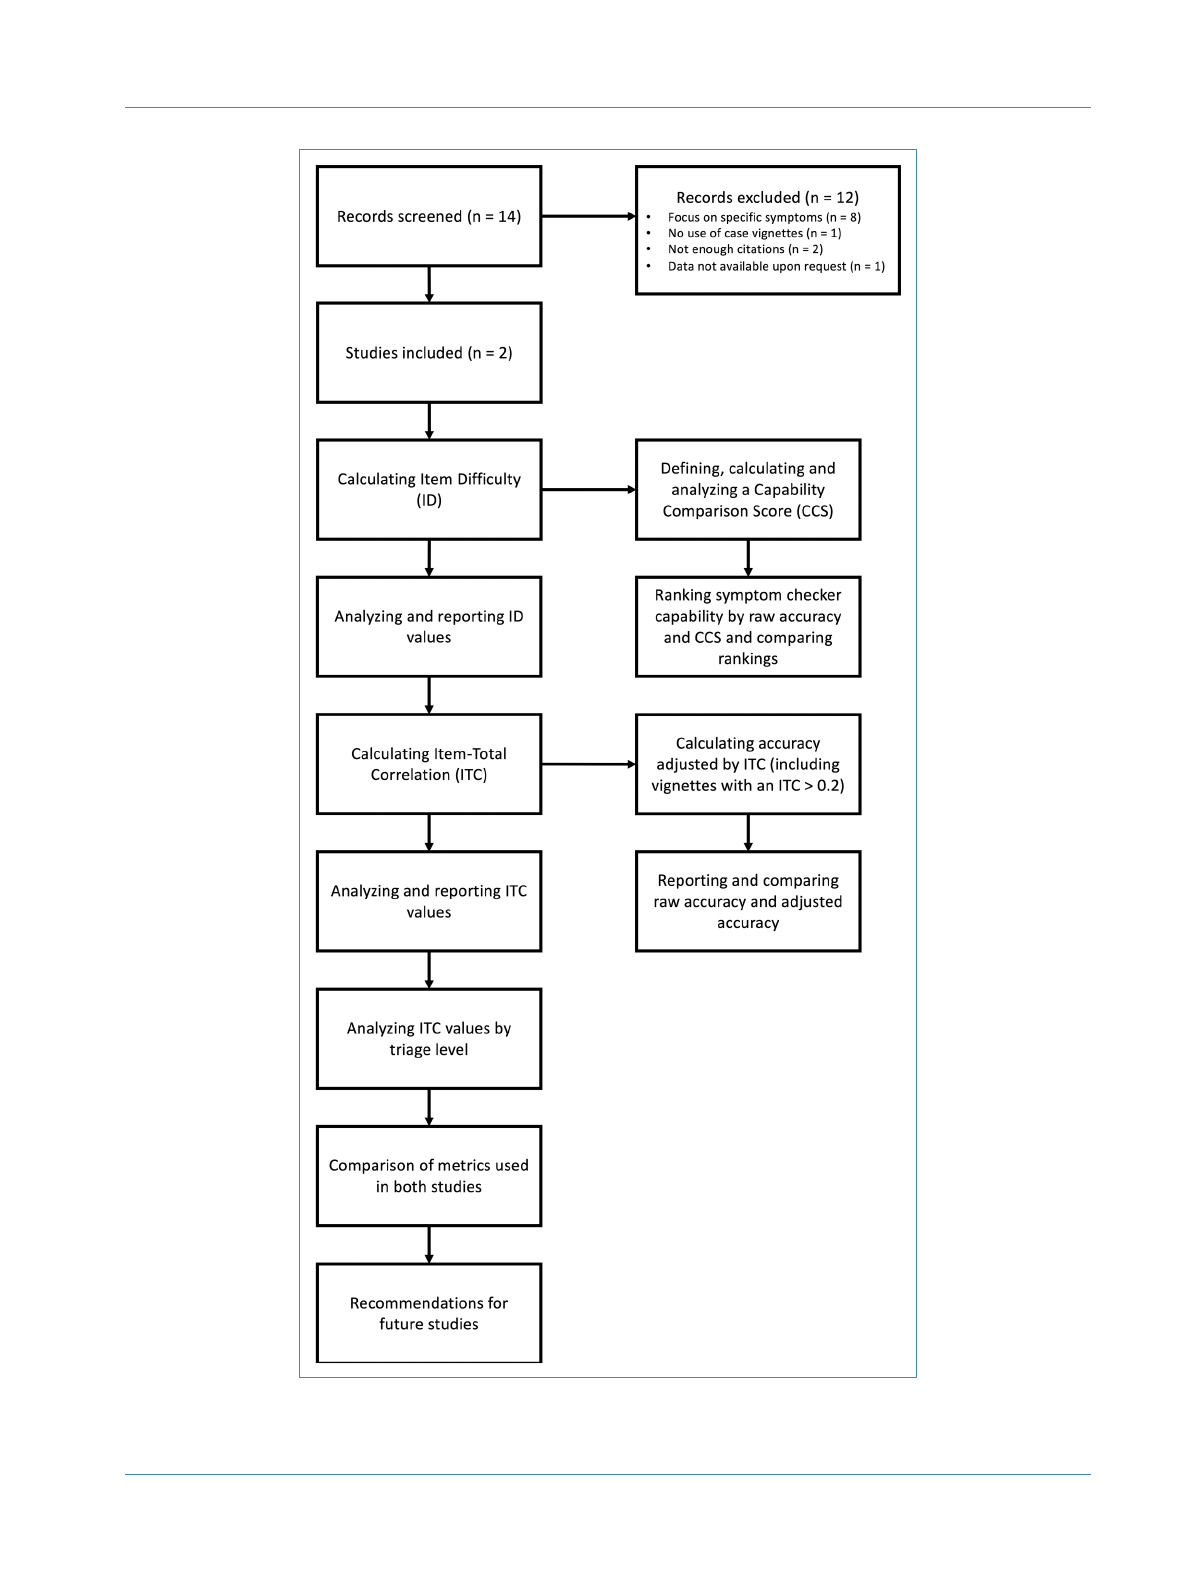
Figure 1. Methodological procedure of the present study.
Kopka et al. 5
Loading more pages...