
Neutralisation rate controls the self-assembly of
pH-sensitive surfactants
Dominic W. Hayward*a,b, Leonardo Chiappisia,b, Jyh Herng Teob, Sylvain Pr´
evostb, Ralf
Schweinsb, and Michael Gradzielski*a
aStranski-Laboratorium f¨
ur Physikalische und Theoretische Chemie, Institut f¨
ur Chemie, Technische Universit¨
at
Berlin, Straße des 17. Juni 124, D-10623 Berlin, Germany
bInstitut Laue-Langevin, 71 avenue des Martyrs, CS 20156, 38042 Grenoble cedex 9, France
*ha[email protected], michael.gradzielski@tu-berlin.de
S1 Further Details Relating to the SANS Analysis
S1.1 Rebinning
In order to simplify the fitting procedure, the data taken from the three instrument configurations were combined into one
dataset and rebinned to reduce the number of data points. This was done in three steps:
1. The entire Q-range is split up into N bins distributed evenly in log(Q)
2. Each data point is assigned to its corresponding bin
3. The average intensity and uncertainty is calculated for each bin
Table S1. Summary of the densities, neutron scattering length densities and volumes used in the scattering model.
Density (g/cm3) Neutron SLD (10−6˚
A−2) Volume ( ˚
A3)
D2O 1.11 6.39 30
Hydrophobic segment 0.75 -0.31 340
Hydrophilic segment 1.25 1.33 341
S2 Further Details Relating to the DLS Analysis
S2.1 Calculation of the Weight Fractions
To estimate the weight fraction of vesicles in the surfactant solutions, the first-order field correlation functions from the dynamic
light scattering data were first fitted to a bimodal exponential model of the form:
g(1)(τ,Q) = A·exp(−D1Q2τ)+(1−A)·exp(−D2Q2τ)(S1)
where
A
and
(1−A)
are the relative intensity contributions from components 1 and 2 respectively. The weight fractions of
each component were then be obtained by taking into account the respective volumes of the scatterers following the method of
Shibayama et. al.1modified to take into account the scattering from a mixture of micelles and vesicles:
wm=
A/Vm
A/Vm+ (1−A)/VvQRm<1.78 and QRv<1.1
A/Vm
A/Vm+ ((1−A)/Vv)·(QRv)2/1.12QRm<1.78 and QRv≥1.1
(ARmQ4)/1.784
(ARmQ4)/1.784+((1−A)/Vv)·(QRv)2/1.12QRm≥1.78 and QRv≥1.1
(S2)
where
wm
is the weight fraction of the micelle fraction,
Vm
and
Rm
are the volume and radius of the micelles,
Vv
and
Rv
are
the volume and radius of the vesicles and
Q
is the scattering vector. Briefly, the significance of the value
QRm∼1.78
arises
from the crossover point where the form factor of the scattering from a spherical particle changes from a plateau (at low-
Q
) to a
Porod function (at high-Q), hence the
Q−4
dependence. Similarly, the value
QRv∼1.1
arises from the crossover point where
the form factor of the scattering from a locally flat particle, changes from a plateau to a Q−2dependence.
1
Electronic Supplementary Material (ESI) for Soft Matter.
This journal is © The Royal Society of Chemistry 2019
S3 Supplementary Table
Table S2.
Tabulated mean aggregation numbers as calculated from the plateau of the corresponding static light scattering data
(shown in Figure S6). Data are shown graphically in Figure 4b in the main text.
NaOH Addition Rate (eq./s) Base Concentration (mol/L) Mean Aggregation Number
2.78×10−30.1 49
3.70×10−40.1 56
3.70×10−50.1 52
3.70×10−60.1 92
3.70×10−70.1 442
3.70×10−80.1 3653
2.78×10⁻³¹ 46
3.70×10−41 63
3.70×10−51 60
3.70×10−61 167
3.70×10−71 419
3.70×10−81 2615
2.78×10−310 62
3.70×10−410 68
3.70×10−510 68
3.70×10−610 99
S4 Supplementary Figures
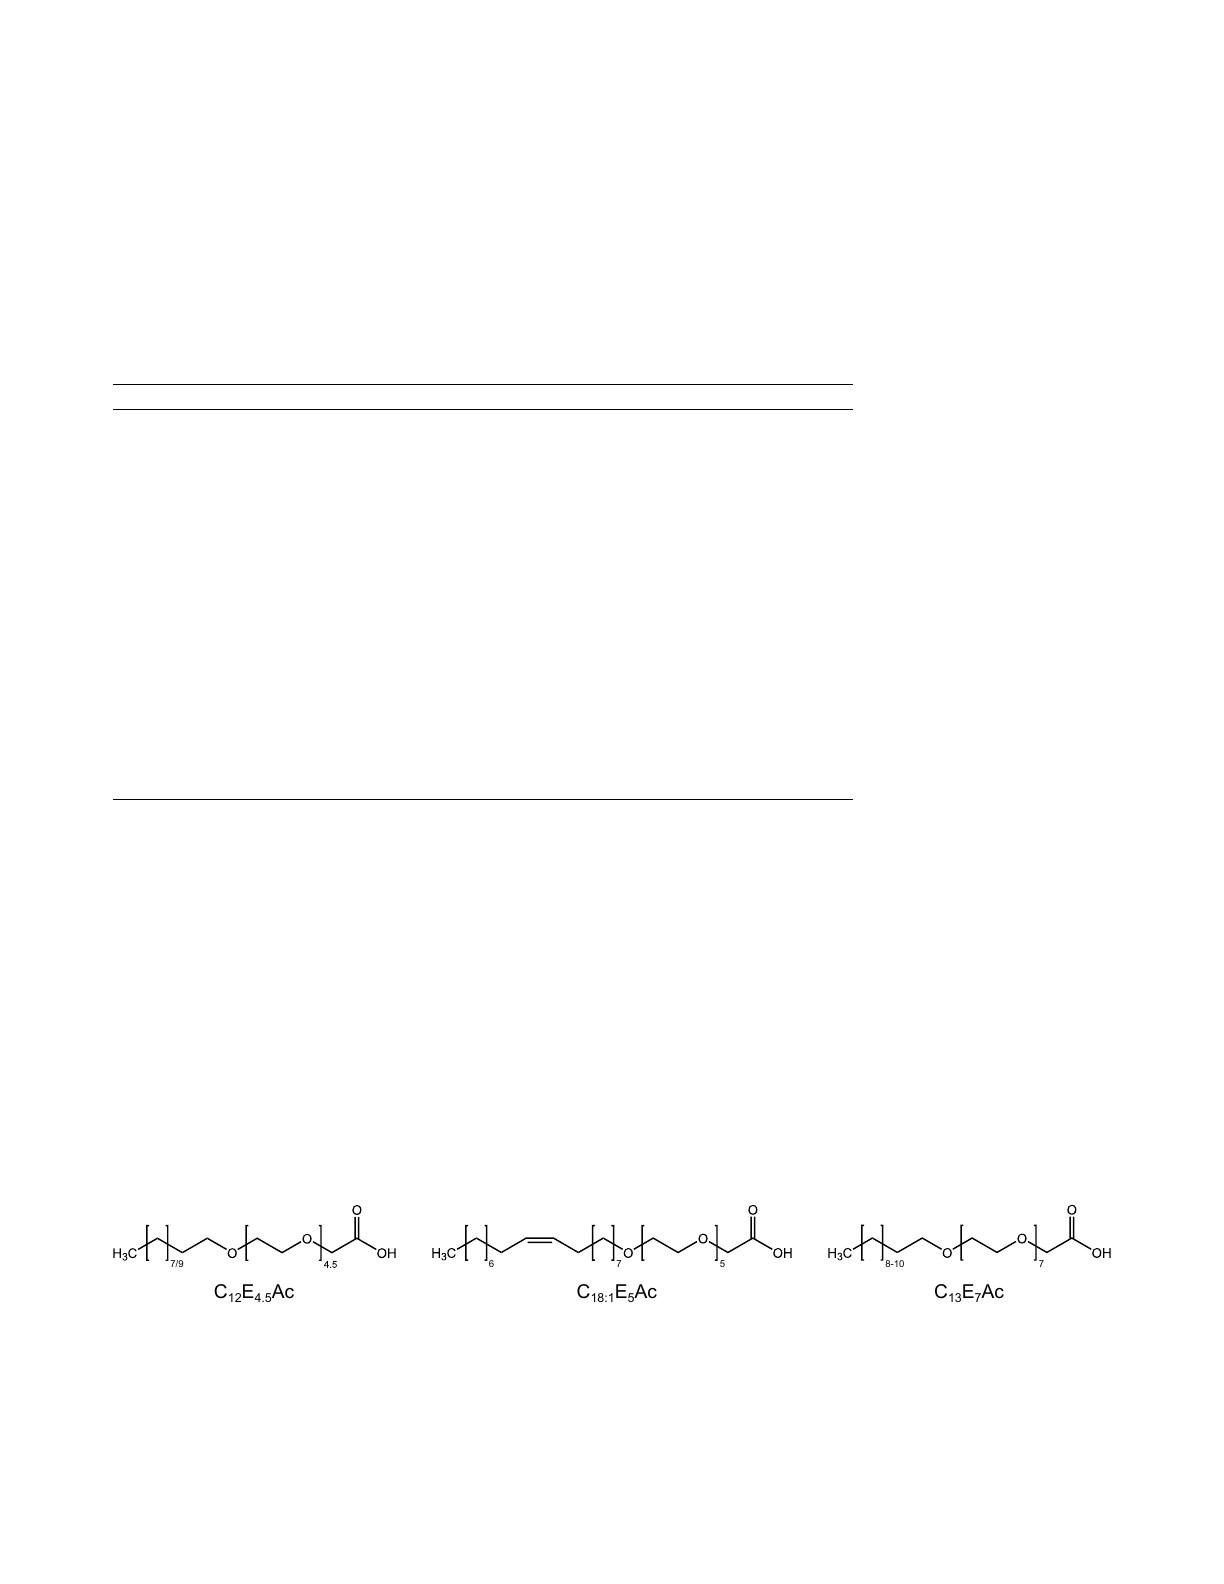
7/9 8-10 75
7
6
C12E4.5Ac C18:1E5Ac C13E7Ac
Figure S1. Approximate chemical structures of the three principal surfactants used in this work. Note that the materials are
technical surfactants and therefore have a significant associated polydispersity, as can be seen in Figure S2.
2
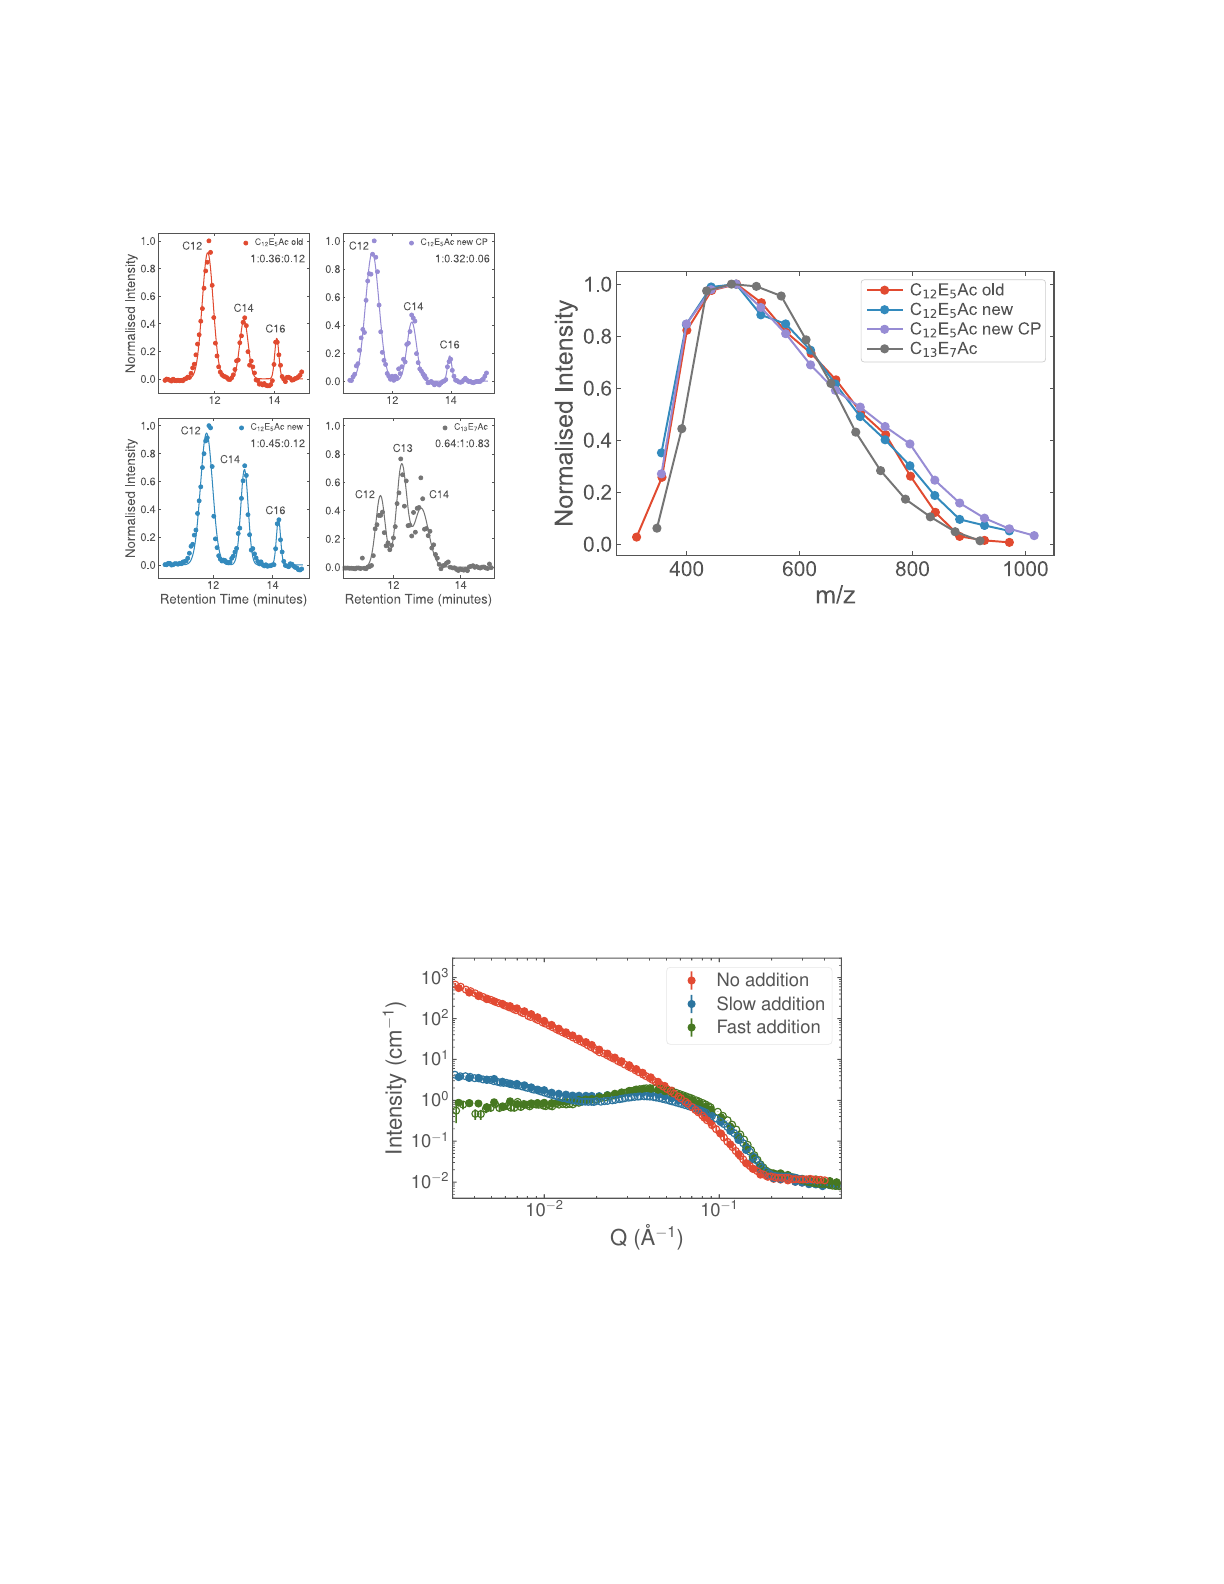
Figure S2.
Electrospray ionisation mass spectra of the C
12
E
5
Ac materials used in this study. The spectra of C
13
E
7
Ac are also
shown for comparison. Figures on the left show the chromatograms with the relative proportions of C12:C14:C16
(C12:C13:C14 for C
13
E
7
Ac) chains found in the surfactants. The figure on the right shows the mass spectrum for the C12 peak
(C13 for C13E7Ac).
10−210−1
Q (Å−1)
10−2
10−1
100
101
102
103
Intensity (cm−1)
No addition
Slow addition
Fast addition
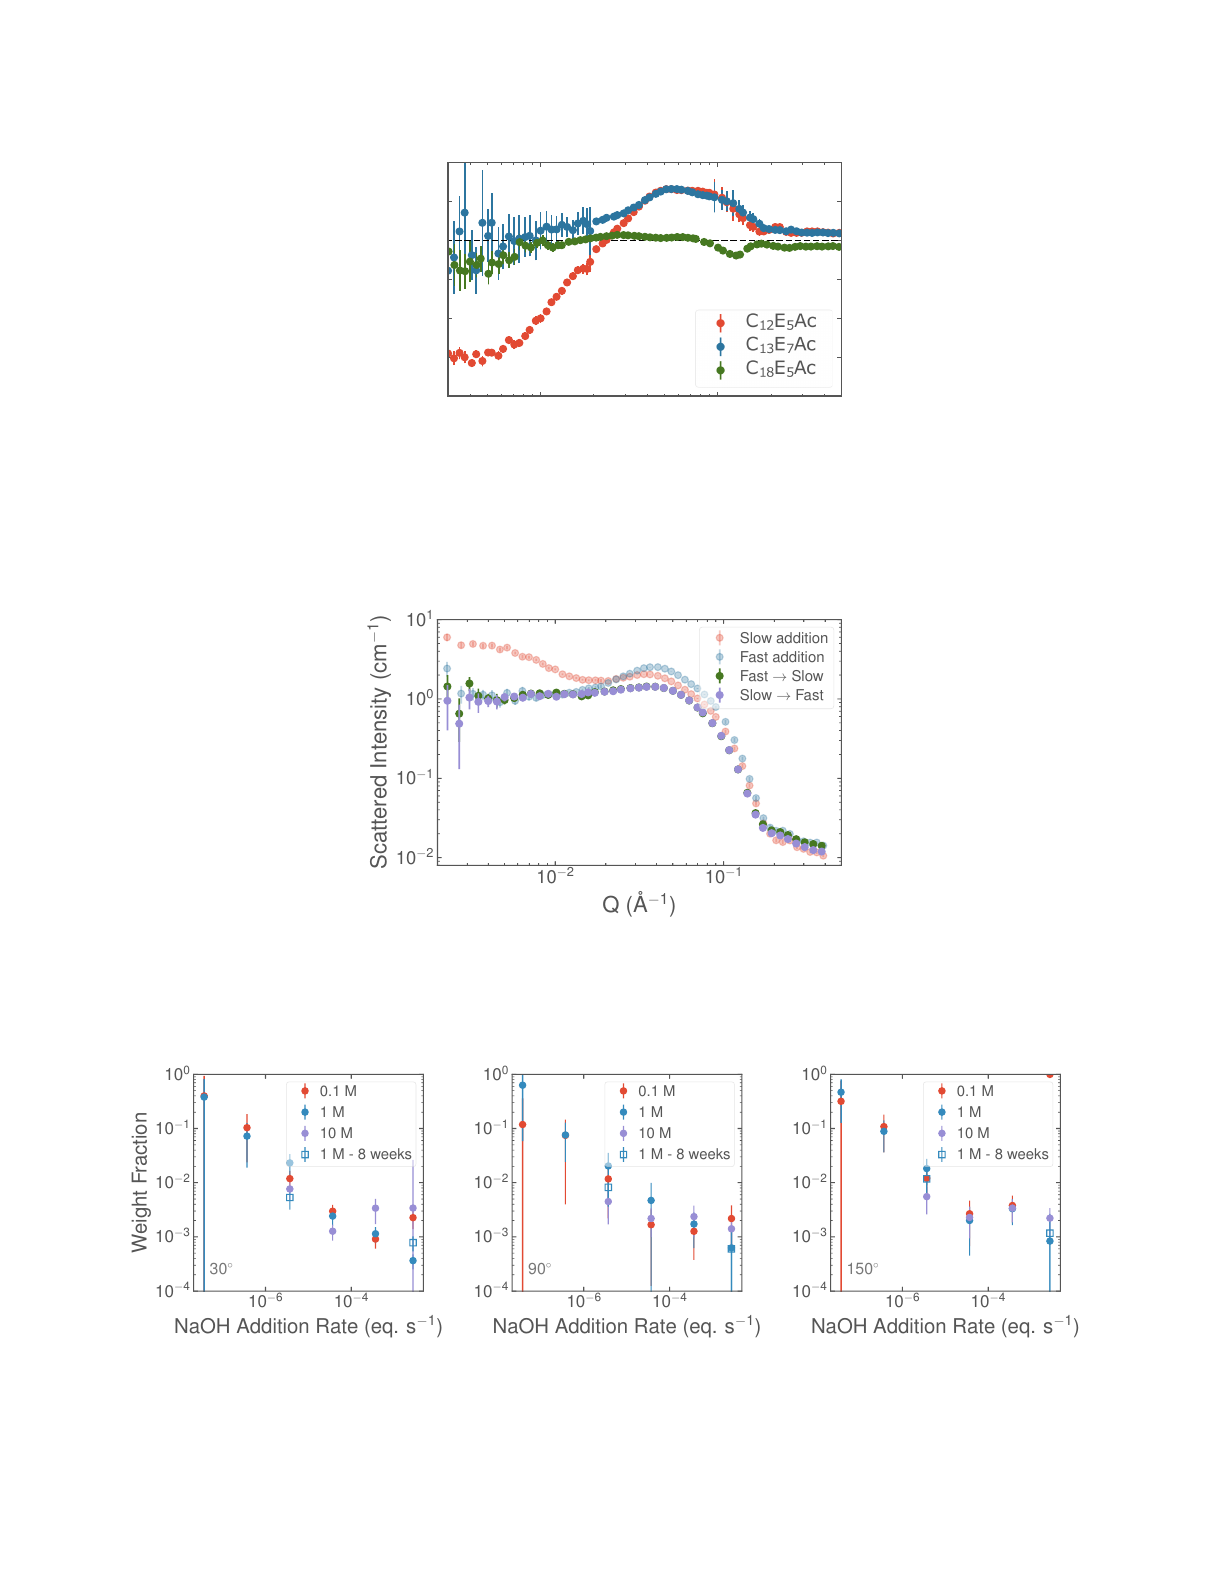
Figure S3. Azimuthally averaged SANS data from 1 %wt solutions of C12E5Ac, showing both the original batch (closed
symbols) and the batch used in this study (open symbols). In all cases the ‘slow’ addition speed was 3.7
×
10
-6
eq. s
-1
and the
fast addition speed was 2.8 ×10⁻³ eq. s-1.
3
10−210−1
Q (Å−1)
0.00
0.25
0.50
0.75
1.00
1.25
1.50
Intensity Ratio [Fast/Slow]
Figure S4. Ratio of the azimuthally averaged SANS data from the fast and slow additions of 1 M NaOH to 1 %wt solutions
of C
12
E
5
Ac. The ‘slow’ addition speeds were 3.7
×
10
-6
, 4.5
×
10
-6
and 4.7
×
10
-6
eq. s
-1
and the fast addition speeds were 2.8
×10-3, 3.4 ×10⁻³ and 3.6 ×10⁻³ eq. s-1 for the C12E5Ac, C13E7Ac and C18:1E5Ac samples respectively
10−210−1
Q (Å−1)
10−2
10−1
100
101
Scattered Intensity (cm−1)
Slow addition
Fast addition
Fast →Slow
Slow →Fast
Figure S5. Azimuthally averaged SANS data from 1 %wt solutions of C12E5Ac, showing both the original batch (closed
symbols) and the batch used in this study (open symbols). In all cases the ‘slow’ addition speed was 3.7
×
10
-6
eq. s
-1
and the
fast addition speed was 2.8 ×10⁻³ eq. s-1.
10−610−4
NaOH Addition Rate (eq. s−1)
10−4
10−3
10−2
10−1
100
Weight Fraction
30◦
0.1 M
1 M
10 M
1 M - 8 weeks
10−610−4
NaOH Addition Rate (eq. s−1)
10−4
10−3
10−2
10−1
100
90◦
0.1 M
1 M
10 M
1 M - 8 weeks
10−610−4
NaOH Addition Rate (eq. s−1)
10−4
10−3
10−2
10−1
100
150◦
0.1 M
1 M
10 M
1 M - 8 weeks
Figure S6. Weight fractions of surfactant in vesicle form in 1 wt% solutions of C12E5Ac after the addition of NaOH at
various concentrations and addition rates. Plots show results taken at 30◦, 90◦and 150◦. A plot showing the average of all
measurements in the range 30◦–150◦is given in Fig 4a in the main text.
4
246
Q2(10−4nm−2)
10−6
10−5
10−4
10−3
10−2
Intensity (cm−1)
0.1 M
2.8 ×10⁻³
3.7 ×10⁻⁴
3.7 ×10⁻⁵
3.7 ×10⁻⁶
3.7 ×10⁻⁷
3.7 ×10⁻⁸
246
Q2(10−4nm−2)
1 M
2.8 ×10⁻³
3.7 ×10⁻⁴
3.7 ×10⁻⁵
3.7 ×10⁻⁶
3.7 ×10⁻⁷
3.7 ×10⁻⁸
246
Q2(10−4nm−2)
10 M
2.8 ×10⁻³
3.7 ×10−43.7 ×10−5
3.7 ×10⁻⁶
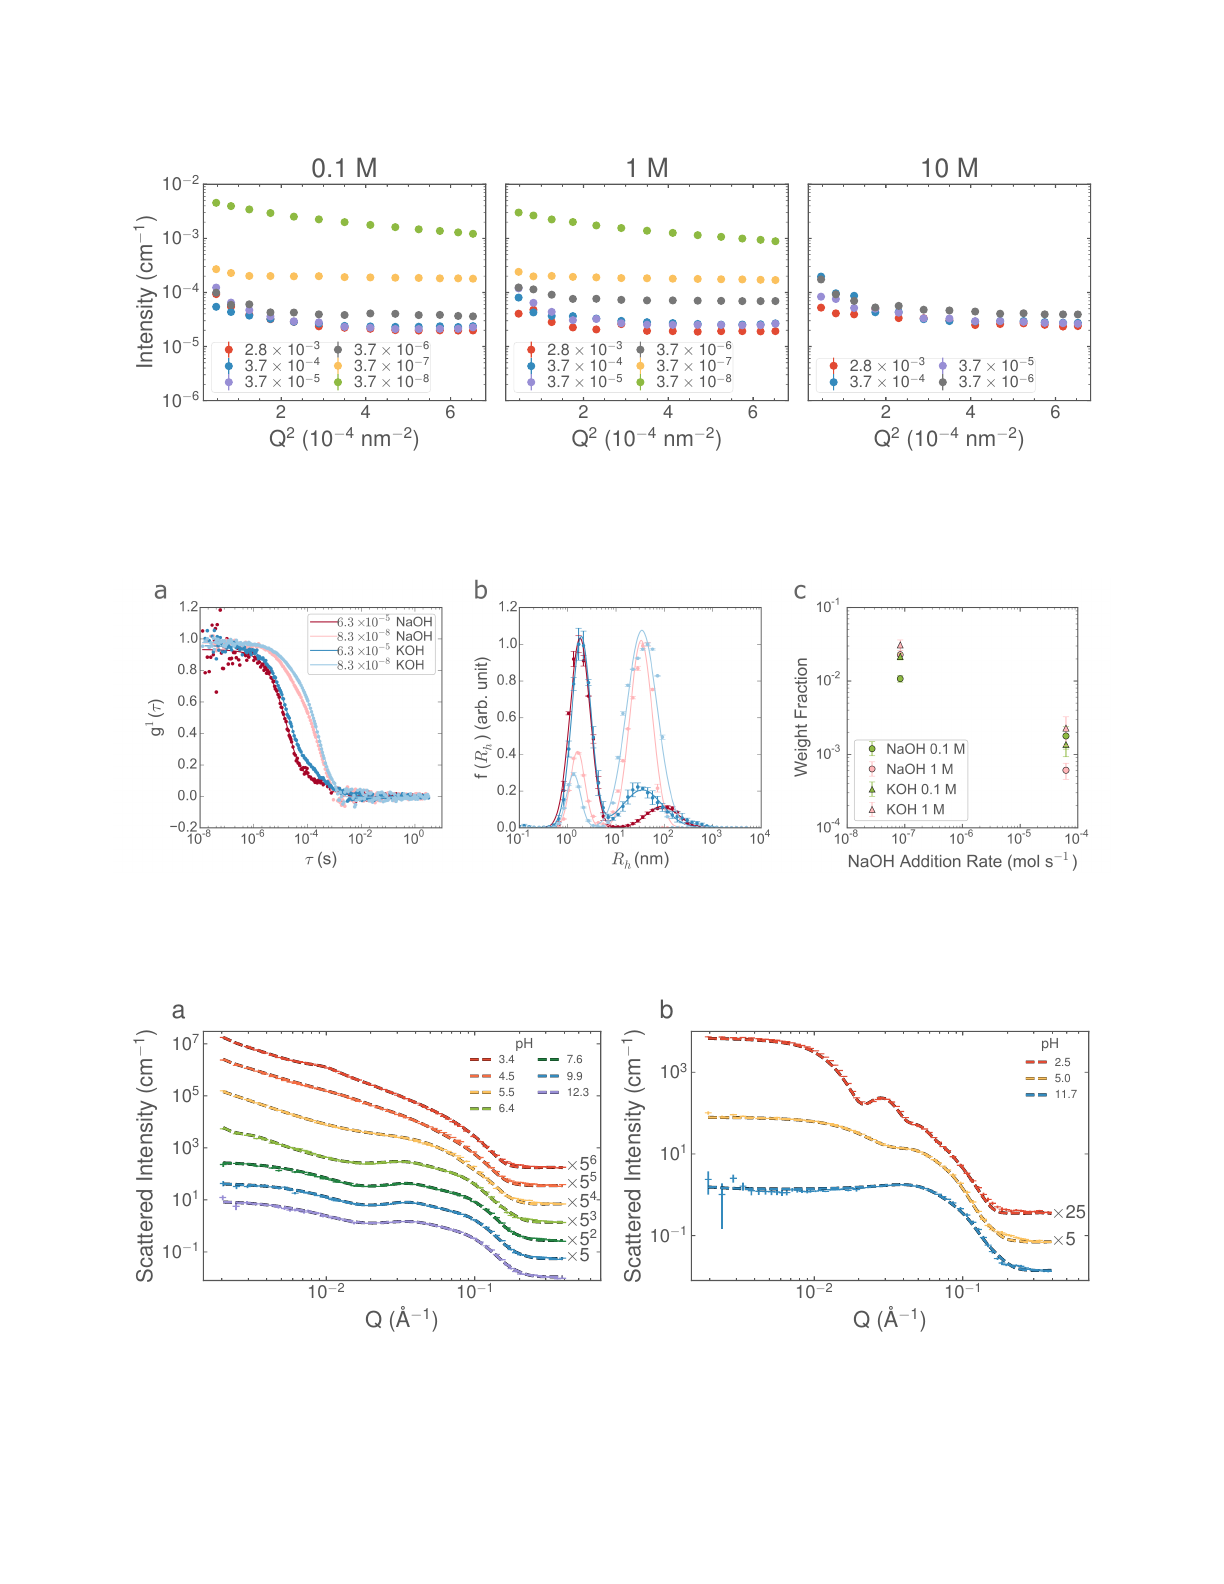
Figure S7. Static light scattering data collected at pH 10 following that addition of NaOH to C12E5Ac. The plot subtitles
indicate the concentration of the NaOH and the plot legends indicate the addition speeds in eq/s.
Figure S8.
DLS correlation functions (a), the corresponding size distribution functions (b) and the related weight fraction of
vesicles (c) from 1 wt% solutions of C12E5Ac after the addition of 1 M NaOH and 1 M KOH.
10−210−1
Q (Å−1)
10−1
101
103
105
107
Scattered Intensity (cm−1)
×56
×55
×54
×53
×52
×5
pH
a
3.4
4.5
5.5
6.4
7.6
9.9
12.3
10−210−1
Q (Å−1)
10−1
101
103
Scattered Intensity (cm−1)
×25
×5
pH
b
2.5
5.0
11.7
Figure S9.
Azimuthally averaged SANS data from 1 %wt solutions of C
12
E
5
Ac, previously published in reference
2
showing
the structural changes occurring as the pH is increased via the slow addition of NaOH (a) and the corresponding slow addition
of NaOH in the presence of 24.5 mM NaOH (b).
5
Loading more pages...