
remote sensing
Article
A Weighted SVM-Based Approach to Tree Species
Classification at Individual Tree Crown Level Using
LiDAR Data
Hoang Minh Nguyen 1,2, Begüm Demir 3and Michele Dalponte 1,*
1Department of Sustainable Agro-ecosystems and Bioresources, Research and Innovation Centre,
Fondazione E. Mach, Via E. Mach 1, 38010 San Michele all’Adige (TN), Italy;
2External Affairs Office, Hanoi University of Science and Technology, No.1 Dai Co Viet Street,
Hanoi 100000, Vietnam
3Faculty of Electrical Engineering and Computer Science, Technische Universität Berlin, Einsteinufer 17,
*Correspondence: [email protected]
Received: 9 October 2019; Accepted: 6 December 2019; Published: 9 December 2019
Abstract:
Tree species classification at individual tree crowns (ITCs) level, using remote-sensing data,
requires the availability of a sufficient number of reliable reference samples (i.e., training samples)
to be used in the learning phase of the classifier. The classification performance of the tree species
is mainly affected by two main issues: (i) an imbalanced distribution of the tree species classes,
and (ii) the presence of unreliable samples due to field collection errors, coordinate misalignments,
and ITCs delineation errors. To address these problems, in this paper, we present a weighted Support
Vector Machine (wSVM)-based approach for the detection of tree species at ITC level. The proposed
approach initially extracts (i) different weights associated to different classes of tree species, to mitigate
the effect of the imbalanced distribution of the classes; and (ii) different weights associated to different
training samples according to their importance for the classification problem, to reduce the effect
of unreliable samples. Then, in order to exploit different weights in the learning phase of the
classifier a wSVM algorithm is used. The features to characterize the tree species at ITC level are
extracted from both the elevation and intensity of airborne light detection and ranging (LiDAR) data.
Experimental results obtained on two study areas located in the Italian Alps show the effectiveness of
the proposed approach.
Keywords:
LiDAR; tree species classification; support vector machines; weighed support
vector machines
1. Introduction
Tree species classification has an important role in a wide range of applications, from forest
management to biodiversity mapping. Indeed, with tree species maps, it is possible to increase
the value of forest inventories [
1
], plan for sustainable forest management [
2
,
3
], and monitor forest
biodiversity [
4
]. Along with the development of remote-sensing technology, the number of studies
on tree species classification has increased over the last decades. In the literature, many studies
have been carried out on species mapping in different forest environments, from tropical (e.g., [
5
]) to
boreal (e.g., [
6
]). Based on different types of remote-sensing data, different approaches to tree species
classification have been proposed. Airborne hyperspectral data are considered to be the most accurate
data sources for classification of tree species [
7
]. However, these data have many constraints in the
acquisition phase (e.g., the time of the acquisition and the weather are influencing the data acquired),
Remote Sens. 2019,11, 2948; doi:10.3390/rs11242948 www.mdpi.com/journal/remotesensing

Remote Sens. 2019,11, 2948 2 of 18
and they need a complex preprocessing when dealing with data over large areas composed by many
stripes acquired in different days.
In the forestry and ecology domains, a type of data that is widely used to predict forest structural
characteristics is light detection and ranging (LiDAR) data. In many countries, these data are frequently
available in many forest areas, as they are acquired also for other purposes (e.g., digital terrain
models extraction). The information contained in LiDAR data about the elevation of trees is very
useful to predict, for example, trees’ aboveground biomass, but this information, combined with the
intensity information related to trees spectral characteristics, could be used to extract a wide range
of useful features for species classification. For example, the separation between broadleaves and
coniferous trees can be accomplished by comparing the canopy height models (CHM) of the two
acquisitions in summer and winter, as broadleaves often obtain a remarkably lower value in winter
periods [
8
,
9
]. Another promising property of LiDAR is its features related to the recorded intensity
(e.g., [
10
,
11
]); these intensity features can distinguish not only between coniferous and broadleaves but
also among coniferous species [
8
]. Currently, the majority of the studies using LiDAR data for tree
species classification have been developed in boreal forests (e.g., [
12
–
17
]), where the species number is
usually limited to three, while very few studies used such features in other biomes (e.g., [18–21]).
In order to get a detailed tree species classification map, it is necessary to work either at pixel or at
individual tree crown (ITC) level. In the case of ITC level, ITCs should be automatically delineated on
remote-sensing data, and then a unique species should be assigned to each ITC. This allows for a more
informative map compared to a pixel-level map, and, potentially, it is possible to assign to each ITC the
height, the aboveground biomass, and other structural characteristics. In the literature, a large majority
of the tree species classification papers focus on ITC level mapping, using both manually delineated or
automatically delineated ITCs [
22
]. Regarding the automatic delineation of the ITCs, a wide range of
literature exists [23,24].
Accurate tree species classification requires reliable ground reference data for all the available tree
species, in order to properly train the classifier. In operational scenarios, gathering a sufficient number of
training samples for each tree species to be classified is difficult due to the time needed for this operation
that is reflected in a high cost of the field data collection. In general, the main issues that decrease the quality
of the training samples in the case of tree species classification can be summarized as follows.
•
Class imbalance (or biased sampling) problem: In a forest, not all the tree species are present in
the same amount. There are always majority species that represent usually the dominant species
and cover the majority of the canopy, and minority species for which, in the extreme cases, only
few trees per hectare are present. This results in a class imbalanced training set that, for minority
classes, leads to (i) poor estimations of the true underlying distributions of the samples and
(ii) reduced information given to the classification algorithm by the considered training samples.
•
Field data positions accuracy: Localization of the exact position of a tree in a forest is a particularly
difficult task, and it is usually done by using a global positioning system (GPS) device. In some
cases, the accuracy could be particularly low, especially in a dense forest or in mountain areas,
where the GPS accuracy is usually low. When mapping tree species at tree level, an error of more
than one meter could lead to inaccurate classification results.
•
Errors in ITCs delineation: Automatic ITCs delineation methods are not perfect, and they are usually
associated with a delineation error that could be quite high in the case of broadleaves trees. Moreover,
the quality of the delineated ITCs depends on the considered remote-sensing data, i.e., low spatial
resolution images or low point density LiDAR data could provide inaccurate delineations.
•
Matching errors between field data and remote sensing data: Trees measured in the field should be
associated to an ITC delineated on the remote-sensing data. This procedure is subject to possible
errors due to misalignments between the field positions and the remote-sensing data, and also
because multiple adjacent trees measured in the field could be identified as just one crown by the
automatic ITC delineation algorithm.
Remote Sens. 2019,11, 2948 3 of 18
In the literature, to the best of our knowledge, very few studies focused on addressing the
abovementioned problems of the training dataset [
5
,
25
,
26
]. As an example, in [
5
] imbalanced class
problem is investigated with two strategies: (i) creating a dataset where each class has the same amount
of training samples equal to the number of samples of the smallest class; and (ii) allowing a different cost
parameter for each class while using the SVM classifier. Most of the other state-of-the-art techniques
exploit semi-supervised methods to combine the information from both labeled and unlabeled sets [
25
],
whereas in the case of unreliable training set none of them has proved to be effective.
In this paper, we introduce a weighted Support Vector Machine (wSVM)-based approach to tree
species classification, at individual tree crown level, using LiDAR data. The proposed approach aims
at addressing problems associated with imbalanced, biased, and unreliable training sets for tree species
classification at ITC level. To this end, weights of tree species samples and classes are initially defined
based on three different strategies. The first strategy exploits the class abundances to weight differently
the samples of the different classes. The second strategy exploits the training samples and their
distribution in the feature space to weight differently each training sample, while the third strategy
exploits the unlabeled samples (that could be extracted from the study area) and their distribution
in the feature space to weight differently each training sample. Then, a wSVM algorithm that gives
more importance to the labeled training samples with high weights and less importance to those of
lower weights while modeling the SVM separating hyperplane is applied. Experiments carried out on
two study areas located in the Italian Alps demonstrated the effectiveness of the proposed approach.
The main contribution of this work to the current literature is the development of three novel weighting
strategies to drive the learning phase of the wSVM, and the application of such techniques in the
domain of tree species classification using LiDAR data. The use of LiDAR data for species classification
in temperate forests also represent an interesting finding as, compared to spectral data, not many
studies exist that use only LiDAR data for species classification, especially in such biome. In particular,
we show that, by using LiDAR data, it is possible to accurately map the main conifer species that
dominates the forests in the Alps.
2. Materials and Methods
2.1. Datasets Description
In this study, we considered two datasets located in the Autonomous Province of Trento (Italy):
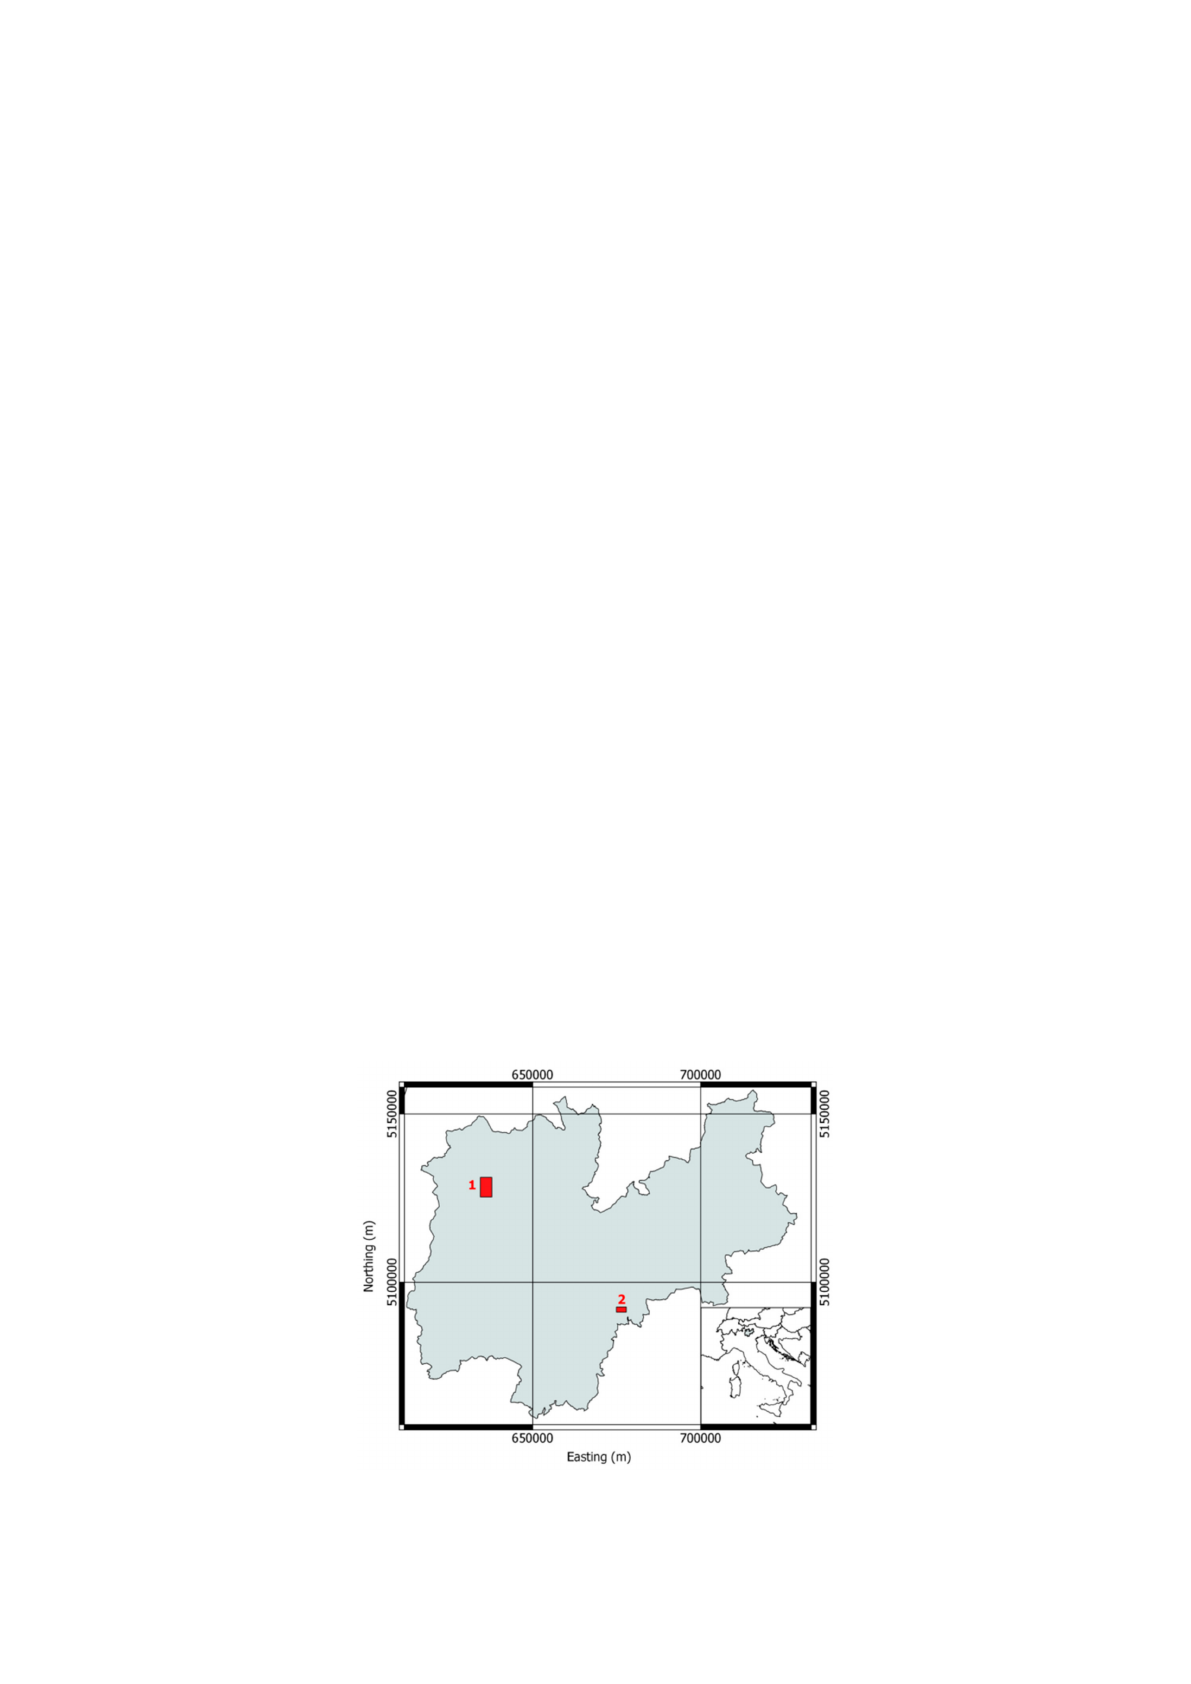
(i) Pellizzano and (ii) Lavarone. Figure 1shows the location of the study areas.
Figure 1.
Location of the two considered study areas: (1) Pellizzano and (2) Lavarone. In the inset is
the location of the Autonomous Province of Trento in Italy.

Remote Sens. 2019,11, 2948 4 of 18
2.1.1. Dataset 1: Pellizzano
The Pellizzano study area (32 km
2
) is located in the municipality of Pellizzano (46
◦
17’22”N,
10
◦
46’05”E) in the Italian Alps (see Figure 1), and its altitude varies between 900 and 2200 m. Most of
the total land area of the municipality is covered by productive forest, with a high number of
different species, and patches of both pure and mixed tree species. The dominant species are Norway
spruce (Picea abies (L.) H. Karst) that accounts for 65% of the total stem volume and European Larch
(
Larix decidua Mill.)
with around 25%. The remaining 10% consists of other conifers, such as silver
fir
(Abies alba Mill.)
, Swiss stone pine
(Pinus cembra L.)
, and some broadleaves such as silver birch
(Betula pendula Roth), common alder (Alnus glutinosa (L.) Gaertn.), sycamore maple (Acer pseudoplatanus
L.), and rowan (Sorbus aucuparia (L.) Crantz.).
The species, height, and locations of 5517 trees were collected in the summers of 2013 and 2014.
However, the position and the species were only recorded for 3039 trees. These trees were located in
the field across all the landscape, and the sampling was done in order to locate the largest number
of species. The remaining trees were sampled inside 52 angle count sampling plots, and for these
trees also the diameter at breast height and the height were measured. The height was measured by
using a Haglöf Vertex hypsometer. For more information about the collection of the reference data,
the reader is referred to [
27
]. Due to the low number of field samples for some species, the tree species
were grouped into six classes: (i) sliver fir (199 trees); (ii) green alder (249 trees), (iii) European larch
(1034 trees); (iv) other broadleaves (1150; all the broadleaves different from green alder), (v) Norway
spruce (2553 trees); and (vi) pines (197 trees; Swiss stone pine, Scots pine, and Austrian pine).
Airborne LiDAR data were acquired between 7 and 9 September 2012, using a Riegl LMS-Q680i
laser scanner (RIEGL Laser Measurement Systems GmbH, Horn, Austria). The scan frequency was
400 kHz, with a 60
◦
field of view. Up to four returns per pulse were recorded, and the mean point
density was approximately 48 pulses m−2.
2.1.2. Dataset 2: Lavarone
The study area (4 km
2
) is located in the municipality of Lavarone (45
◦
57’30.09”N, 11
◦
16’25.17”E)
in the Italian Alps (see Figure 1). The area has a complex structure that contains patches of mixed and
pure species composition. The altitude varies from 1200 to 1600 m above the sea level. The dominant
tree species are Norway spruce (Picea abies (L.) H. Karst.) at about 47% of the total stem volume, silver
fir
(Abies alba Mill.)
at about 36%, and European beech (Fagus sylvatica L.) at about 13%. Other relevant
species are European larch (Larix decidua Mill.) and Scots pine (Pinus sylvestris L.), which account for
about 4%.
The species, height, and locations of 5655 trees were collected in the summers of 2016 and 2018.
The field measurements of 2016 were done in 41 plots of 15 meters radius: the position, the species,
and the DBH of 4812 trees were measured. The remaining trees (843) were measured in 2018, and they
were sampled across all the landscape, and the sampling was done in order to locate the largest number
of species. Due to the low number of field samples for some species, the tree species were grouped into
five classes: (i) sliver fir (2164 trees); (ii) European larch (113 trees); (iii) broadleaves (1795 trees; all the
broadleaves species), (iv) Norway spruce (1437 trees); and (v) Scots pine (146 trees).
LiDAR data were acquired by an Optech ALTM 3100EA sensor with a maximum scan angle of
21 degrees. The mean point density was 21.5 points per square meter for the first return, while the
pulse density was 14.4 pulses m−2. Up to four returns per pulse were measured.
2.2. LiDAR Data Preprocessing
The LiDAR point cloud was normalized to create a canopy height model (CHM) by subtracting
the DTM from the z values of the LiDAR pulses. This operation was carried out by using the module

Remote Sens. 2019,11, 2948 5 of 18
lasground of the LAStools software (https://rapidlasso.com/). The intensity value of each LiDAR point
was range-calibrated, using the following equation:
IC=I∗R
Rsα
(1)
where
IC
is the calibrated intensity,
I
the raw intensity,
R
is the sensor-to-target range, and
Rs
is the
reference range or average flying height. We considered an exponential factor
α
of 2.5 [
10
] since the
environmental factors can be considered stable and the same acquisition parameters and instruments
were maintained during the survey [28].
2.3. ITCs Delineation
The automatic ITCs delineation was performed by using the method implemented in the R
package itcSegment and used in [
27
]. The algorithm follows three steps: (1) smoothing of the canopy
height model: a Gaussian low-pass filter is applied to the rasterized CHM to smooth the surface and to
reduce the number of potential local maxima; (2) local maxima extraction: a circular moving window of
variable size is applied to the smoothed CHM to find a set of potential treetops (local maxima). A pixel
of the CHM is labeled as local maxima if its value is greater than all other values in the window while
being greater than some minimum height above ground. The window size is adapted according to
the height of the central pixel of the window, which is predetermined in a user-defined look up table;
(3) crown region growing: the algorithm iteratively searches for possible neighboring pixels to grow the
crown of the tree around each local maxima. A pixel belongs to a specific region only if its vertical
distance from the local maximum is less than a predefined percentage of the local maximum height,
and less than a predefined maximum difference. The process repeats until no further pixel is added to
any region. Once the region is fully grown, a 2D convex hull is applied, resulting in polygons that
represent individual trees (ITCs).
To generate the reference ITCs dataset for species classification, a matching process between
delineated ITCs and reference ground observations was applied. The adopted matching procedure
followed two steps: (1) candidate search: all ground reference trees falling inside an ITC were considered
as matching candidates; (2) candidate vote: selected candidates were ranked by their difference in height
with the delineated ITCs and their Euclidian distance to the local maxima. A distance metric Dwas
estimated by considering both parameters to select the best candidate as follows:
D=q(xCAN −xITC)2+(yCAN −yITC)2+w∗(hCAN −hITC)2(2)
where
(xCAN,yCAN,hCAN)
and
(xITC,yITC,hITC)
denotethelocationsandheightsofthefieldmeasured
trees and the delineated ITCs, respectively; and
w
is the user-defined weight. Here, the value of
w
is
set as 0.5 [29].
The matched ITCs were divided into training and test sets that were defined in order to have
similar distributions in terms of species, tree height, and spatial location. In Table 1, a summary of the
training and test sets for the two datasets is presented.
Table 1. Number of training and test ITCs for the Pellizzano and Lavarone datasets.
Dataset 1: Pellizzano Dataset 2: Lavarone
Class Name Training Set Test Set Class Name Training Set Test Set
Sliver fir 52 51 Sliver fir 232 231
Green alder 80 79 European larch 35 34
European larch 313 312 Broadleaves 108 108
Other broadleaves 343 343 Norway spruce 253 252
Norway spruce 697 696 Scots pine 37 36
Pines 56 56
Loading more pages...