
1. Introduction
Average flood losses in the USA amount to US$32.1 billion per year and flood risk is estimated to grow by
26.4% in 2050 (Wing etal.,2022). Impact patterns are inequitable across different socio-economic groups (Wing
etal.,2022). Thus, there is an urgent need for improved and more equitable adaptation to flood risk in the US.
Proactive adaptation strategies, that is, informed actions based on risk assessments that are adopted before a
flood hits, can be driven by top-down measures (e.g., community-level policies or infrastructural interventions
for flood protection) or bottom-up actions (e.g., purchase of flood insurance by households). Household adap-
tation, for instance through insurance purchase (Cremades etal.,2018), has the potential to lower future flood
risk substantially by reducing the financial vulnerability to residual risk (Aerts etal.,2018; Jongman etal.,2015;
Kundzewicz etal.,2018).
In the US, top-down and bottom-up flood adaptation measures are interlinked within the mechanism that relates
individuals' flood insurance access and communities' flood risk management. Flood insurance adoption as a
bottom-up measure is regulated within the National Flood Insurance Program (NFIP). The NFIP was founded
in 1968 as the only source of flood insurance in the US. Communities maintain minimum floodplain manage-
ment standards to make insurance accessible for their inhabitants (Horn & Brown,2018). Within the NFIP, the
Community Rating System (CRS) (FEMA,2021c) is a top-down strategy to encourage insurance adoption. If a
community agrees to undertake flood risk mitigation and floodplain management measures, it is ranked with a
higher CRS class and the insurance premiums in the community will be lowered (Sadiq etal.,2019).
Abstract Floods cause average annual losses of more than US$30 billion in the US and are estimated
to significantly increase due to global change. Flood resilience, which currently differs strongly between
socio-economic groups, needs to be substantially improved by proactive adaptive measures, such as timely
purchase of flood insurance. Yet, knowledge about the state and uptake of private adaptation and its drivers is
so far scarce and fragmented. Based on interpretable machine learning and large insurance and socio-economic
open data sets covering the whole continental US we reveal that flood insurance purchase is characterized by
reactive behavior after severe flood events. However, we observe that the Community Rating System helps
overcome this behavior by effectively fostering proactive insurance purchase, irrespective of socio-economic
backgrounds in the communities. Thus, we recommend developing additional targeted measures to help
overcome existing inequalities, for example, by providing special incentives to the most vulnerable and exposed
communities.
Plain Language Summary Flood resilience of individuals and communities can be improved by
bottom-up strategies, such as insurance purchase, or top-down measures like the US National Flood Insurance
Program's Community Rating System (CRS). Our interpretable machine learning approach shows that flood
insurances are mostly purchased reactively, after the occurrence of a flood event. Yet, reactive behaviors are
ill-suited as more extreme events are expected under future climate, also in areas that were not previously
flooded. The CRS counteracts this behavior by fostering proactive adaptation across a widespread range
of socio-economic backgrounds. Future risk management including the CRS should support and motivate
individuals' proactive adaptation with a particular focus on highly vulnerable social groups to overcome existing
inequalities in flood risk.
VEIGEL ETAL.
© 2023 The Authors.
This is an open access article under
the terms of the Creative Commons
Attribution-NonCommercial License,
which permits use, distribution and
reproduction in any medium, provided the
original work is properly cited and is not
used for commercial purposes.
Interpretable Machine Learning Reveals Potential to
Overcome Reactive Flood Adaptation in the Continental US
Nadja Veigel1,2,3 , Heidi Kreibich2 , and Andrea Cominola1,3
1Chair of Smart Water Networks, Technische Universität Berlin, Berlin, Germany, 2Section 4.4 Hydrology, GFZ German
Research Centre for Geosciences, Potsdam, Germany, 3Einstein Center Digital Future, Berlin, Germany
Key Points:
• Flood insurance purchase in the US is
dominated by reactive behavior after
severe floods
• The Community Rating System (CRS)
fosters proactive insurance adoption
irrespective of socio-economic
background
• The CRS should further balance
existing inequalities by targeting
specific population segments
Supporting Information:
Supporting Information may be found in
the online version of this article.
Correspondence to:
N. Veigel,
nadja.v[email protected]
Citation:
Veigel, N., Kreibich, H., & Cominola, A.
(2023). Interpretable machine learning
reveals potential to overcome reactive
flood adaptation in the continental US.
Earth's Future, 11, e2023EF003571.
https://doi.org/10.1029/2023EF003571
Received 5 FEB 2023
Accepted 6 SEP 2023
Author Contributions:
Conceptualization: Nadja Veigel, Heidi
Kreibich, Andrea Cominola
Data curation: Nadja Veigel
Funding acquisition: Heidi Kreibich,
Andrea Cominola
Methodology: Nadja Veigel, Andrea
Cominola
Resources: Heidi Kreibich, Andrea
Cominola
Software: Nadja Veigel, Andrea
Cominola
Supervision: Heidi Kreibich, Andrea
Cominola
Validation: Nadja Veigel
Visualization: Nadja Veigel
Writing – original draft: Nadja Veigel
10.1029/2023EF003571
RESEARCH ARTICLE
1 of 11

Earth’s Future
VEIGEL ETAL.
10.1029/2023EF003571
2 of 11
Previous studies have shown that individuals' adaptation actions are potentially impacted by a large number of
demographic, socio-economic, and psychological factors (Koerth etal.,2017; McPhillips etal.,2018), including
risk perception (Bubeck etal.,2012; Sanders etal.,2020), preparedness, and social networks (Hu,2020). For
instance, clear increases of flood insurance take-up rates were observed after the occurrence of catastrophic
floods by several studies (Gallagher,2014; Kuang & Liao,2020). Moreover, resilience differs quite strongly
between different socio-economic groups and there are problems of inequitable access to adaptation meas-
ures and unbalanced consideration of different socio-demographic groups in flood risk management policies
(Knighton etal.,2021; Wing etal.,2022). A US wide study with focus on selected metropolitan areas showed
a disproportional exposure of metropolitan areas with a higher percentage of Black, Indigenous, and People of
Color (BIPoC) residents (Knighton etal.,2021). Another study in Georgia showed that African-Americans as
well as educated and older people were more likely to purchase flood insurance (Atreya etal.,2015). Conversely,
Cannon etal.(2020) found that the dominant ethnicity in a neighborhood was not significantly associated with
insurance coverage, whereas Knighton etal.(2021) describe unequal exposure patterns.
Overall, the literature on the socio-economic drivers of bottom-up adaptation measures in the US is heteroge-
neous and in some cases contradictory. This could be a result of spatially heterogeneous individual reactions or
analysis run on small samples. This reveals a research gap: to generalize beyond fragmented results, studies are
needed that provide large scale evidence on the drivers of bottom-up flood adaptation strategies in combination
with community-level policies.
Here, we investigate the relationship between socio-economic backgrounds, household flood insurance purchase
(bottom-up), and the community-scale CRS (top-down) in the whole continental US. We aim to reveal the main
drivers of insurance uptake and explore the potential of the CRS to foster proactive adaptation and overcome
inequitable flood risk management across household and community scales, without any a priori assumption on
individuals' motivations, or utility maximization. We formulate the following research questions:
1. What are the main socio-economic and behavioral drivers of flood insurance purchase in the US? Is the CRS
effective in fostering individuals' flood insurance purchase?
2. Which patterns emerge in the socio-economic composition of communities that are active in the CRS? Are
there inequalities in the representation of different social groups?
2. Materials and Methods
To address the above questions, we develop a data-driven method based on interpretable machine learning (ML).
We investigate the role of socio-economic characteristics, flood history, and participation in the CRS with respect
to flood insurance purchase as for the whole continental US. Similarly, we model communities' participation in
the CRS as a function of flood history and socio-economic characteristics.
2.1. Data Sources and Data Preparation
We analyze open-access flood insurance data by the NFIP and the American Community Survey (ACS) by the
US Census Bureau with a census tract resolution to model the policy records since 2009 that were in-force at the
time of data retrieval (FEMA,2020). From the ACS we initially selected 400 different potential behavioral and
socio-economic predictors to model individuals' and communities' flood resilience and compare it across differ-
ent census tracts. Additionally we model CRS participation probability (FEMA,2021a).
The locations of the NFIP policies-in-force (FEMA,2020) are redacted to 0.1° precision upon retrieval. To coun-
teract the resulting high concentration of points (in a few census tracts), we apply a random spread to the points.
Finally, we spatially aggregate this data to match the census tract scale of the ACS data. Thus, we total the data
points within the census tracts and divide by the number of housing units. We then use the resulting processed
data as output variable to train a ML model to predict household flood insurance purchase as a function of the
potential behavioral and socio-economic predictors. In building the set of candidate model input features, or
predictors, we manually select 400 variables from more than 25,000 census variables contained in the ACS data
set. Feature values were retrieved as total counts and divided by the number of inhabitants in a census tract to
estimate the percentage of people showing a respective feature. We consider the claims filed within the NFIP as a
proxy to estimate past average annual number of floods (feature called flood history, regular) and the maximum
Writing – review & editing: Nadja
Veigel, Heidi Kreibich, Andrea Cominola

Earth’s Future
VEIGEL ETAL.
10.1029/2023EF003571
3 of 11
amount of people affected in a flood per census tract (FEMA,2019) to estimate flood severity (flood history,
severe). This strategy may result in an under-estimation of under-insured census tracts for the flood severity
variable. The area within the flood zone in a census tract is calculated based on the official Special Flood Hazard
Area (SFHA) by FEMA (FEMA,2021b) and distinguished between coastal (flood zone V) and fluvial flood
zones (flood zone A). Two features describing whether the insurance policy covered a building or its contents are
calculated based on the metadata of the policies in force indicating the percentage of policies covering contents
and those covering buildings. We find no significant pair-wise variable correlations in our input variables, which
we assume to be a result of spatial heterogeneity and locally differing effects. The resulting data set contains 400
features for 72,366 samples (census tracts) across all states in the continental US.
2.2. Regression of Flood Insurance Purchase per Household and Classification of CRS Participation
We first perform a regression task to estimate insurance coverage in a census tract based on the 400 features
described in the previous section using a Gradient Boosting Decision Trees (GBDT) framework. In GBDT
an ensemble model is assembled by step-wise addition of decision trees to minimize the residual error of a
tree ensemble. We use an efficient form of state-of-the-art GBDT called Light Gradient Boosting Machine
(LightGBM) (Ke etal.,2017). LightGBM builds on Gradient-based-One Side-Sampling and Exclusive Feature
Bundling to accelerate model training and achieve higher prediction accuracy (Ke etal.,2017). We train the
LightGBM using data from 80% of the census tracts (n=54,274) and test on the remaining 20% (n=18,092)
(see Text S1.3 in Supporting InformationS1). We train the LightGBM model both at the aggregate level for the
whole US, as well as a series of individual models, one for each state in the continental US. For the regression
problem of insurance purchase modeling, we tune the hyperparameters of the LightGBM via grid search and
k-fold cross-validation (k=10) on the training set. For all simulations we select a Tweedie objective for extremely
unbalanced zero-inflated distributions as in Zhou etal.(2020). Its gradient is calculated as the log likelihood of a
Tweedie distribution (dispersion parameter equivalent to 1.7). For details on the implementation in this specific
framework please refer to Veigel etal.(2022). We estimate the Tweedie distribution dispersion parameter by
fitting a Tweedie distribution to the target variable in the training data set before training the LightGBM. Finally,
we assess the model performance using multiple performance metrics, including the Root-Mean-Square Error
(RMSE), the Mean Absolute Error (MAE), and the coefficient of determination (R
2). LightGBM robustness to
possible correlation and redundancy in the input data is achieved by selection of one feature within a correlated
group.We apply a hierarchical grouping strategy (Text S1.2 in Supporting InformationS1) to counteract this
model limitation.
In the second part of our research, we use LightGBM also in classification mode to tackle the binary classifica-
tion problem of predicting whether a community takes part in the CRS. LightGBM hyperparameters are trained
similarly to the above regression task, but the area under the receiver operating characteristic curve was used as an
objective function (Bradley,1997). Estimated participation probabilities above 0.5 are classified as participating
communities. Class imbalance in the training data set is equalized prior to training by random under-sampling in
the class with more instances to contain the same amount of observations as in the underrepresented class (Guo
etal.,2008).
2.3. Interpretable Machine Learning
We use LightGBM in combination with SHapley Additive exPlanations (SHAP) (S. Lundberg & Lee,2017) with
the two-fold goal of, first, predicting insurance coverage and CRS participation and, second, understanding which
predictors (features) affect the model outcome and with which magnitude. SHAP values are an Interpretable ML
method that quantifies the shift of the predicted value caused by each individual input feature. They represent
the marginal change we observe in a conditional expectation function upon feature introduction at each step in a
unique and additive manner. Since the calculation of marginal impacts depends on the features previously eval-
uated, the contribution should be averaged over all previously implemented features. Several methods to achieve
this estimation were previously proposed, tough they are computationally demanding (S. Lundberg & Lee,2017).
Conversely, SHAP values can be estimated efficiently by exploiting the structure of tree based models such as
LightGBM. They are calculated by evaluating all possible combinations of branches that end in the respective
node with the Tree SHAP algorithm (S. M. Lundberg etal.,2020). In this work, we adopt SHAP values over other
measures of feature importance to quantify the effect of features on model output. SHAP enhances interpretation

Earth’s Future
VEIGEL ETAL.
10.1029/2023EF003571
4 of 11
by quantifying whether a specific predictor has a positive or negative influence on model output, along with
whether specific ranges of interest emerge, when a predictor has a stronger/weaker influence on the model output.
We calculate SHAP values both for the regression problem of predicting household flood insurance purchase in a
census tract, where the SHAP value represents the change in insurance policies per housing unit in a census tract
that can be attributed to a specific input variable, and for the classification problem of predicting communities'
participation in the CRS, where the SHAP values represent the changes in participation probability attributed to
a specific input variable. To mitigate the potential presence of weakly correlated features in our data set contain-
ing 400 variables, we apply a grouping strategy, in which we combine the SHAP values for thematically related
features. Feature importance within a group is quantified as the weighted sum of absolute SHAP values. The
combined feature importance within a group is represented even if the importance gets assigned to one variable
or split across multiple variables depending on the model structure. The results and discussion are based on those
variables that show the highest SHAP, either individually, or in groups.
2.4. Kruskal Wallis and Dunn's Test
As an output of the binary classification problem of CRS participation probability estimation we obtain the
SHAP values representing the changes observed for the communities' participation probability in the CRS. If
a community was less likely to participate because of a specific feature, such feature would be attributed with
negative SHAP values more frequently. Positive SHAP values represent a shift toward a higher participation
probability, and SHAP values close to zero (±0.01) indicate no change in participation probability. To understand
if the effects of a feature on communities' participation in the CRS as quantified by SHAP values are statistically
significant, that is, the distributions of that feature across different SHAP groups (positive, negative, null) are
statistically different, we performed a Kruskal Wallis (KW) test (Kruskal & Wallis,1952) and post-hoc Dunn's
test (Dunn,1964). The KW test is a non-parametric test to evaluate the similarity of variances and estimate if
the samples of a feature originate from the same distribution when taken from different SHAP groups. The
effect size describes how strongly the groups differ from each other by comparing the feature value variances.
Prior to running the KW test we apply a floodzone correction, dividing the percentage of inhabitants that are
characterized by a certain feature by the floodplain area in a census tract. We further apply a post-hoc Dunn's
test (Dunn,1964) on the variables with significant results in the KW test to identify which groups exactly show
significant differences with each other (Text S1.3 in Supporting InformationS1).
3. Results
3.1. Flood Insurance Coverage and CRS Participation Model Performance
We here present results both for an aggregate model trained over the entire data set at the continental US scale,
and models fitted individually for each state. The aggregate US LightGBM model we implement to predict
flood insurance coverage at the census tract level and identify its significant drivers attains a very good train-
ing performance (R
2=0.987, RMSE=0.004, MAE=0.001) and satisfactory test performance (R
2=0.677,
RMSE=0.019, MAE=0.003). For further model performance analysis broken down by individual US states
please refer to Figure S1 and Table S1 in Supporting InformationS1, which show that our model generalizes
well for the majority of the US states, even if overfitting occurs in a small number of cases (e.g., Pennsylvania).
This result demonstrates the ability of our ML approach to model overall flood insurance purchase patterns at the
continental scale. Conversely, flood insurance coverage models fitted to individual states achieve varied accu-
racy levels, suggesting that some local effects might not be captured by the set of predictors we included in our
analysis. Notably, R
2 higher than 0.6 (obtained for the US states included in Figure1) are achieved for high-risk
US states such as Georgia (test R
2=0.81) and Louisiana (test R
2=0.78). Model performance results confirm
that despite the existence of several climate zones and heterogeneous socio-demographic characteristics among
different states in the continental US, a relation between flood insurance coverage and local socio-economic and
behavioral drivers exists.
3.2. Flood Insurance Policies Are Purchased as a Reactive Flood Adaptation Behavior
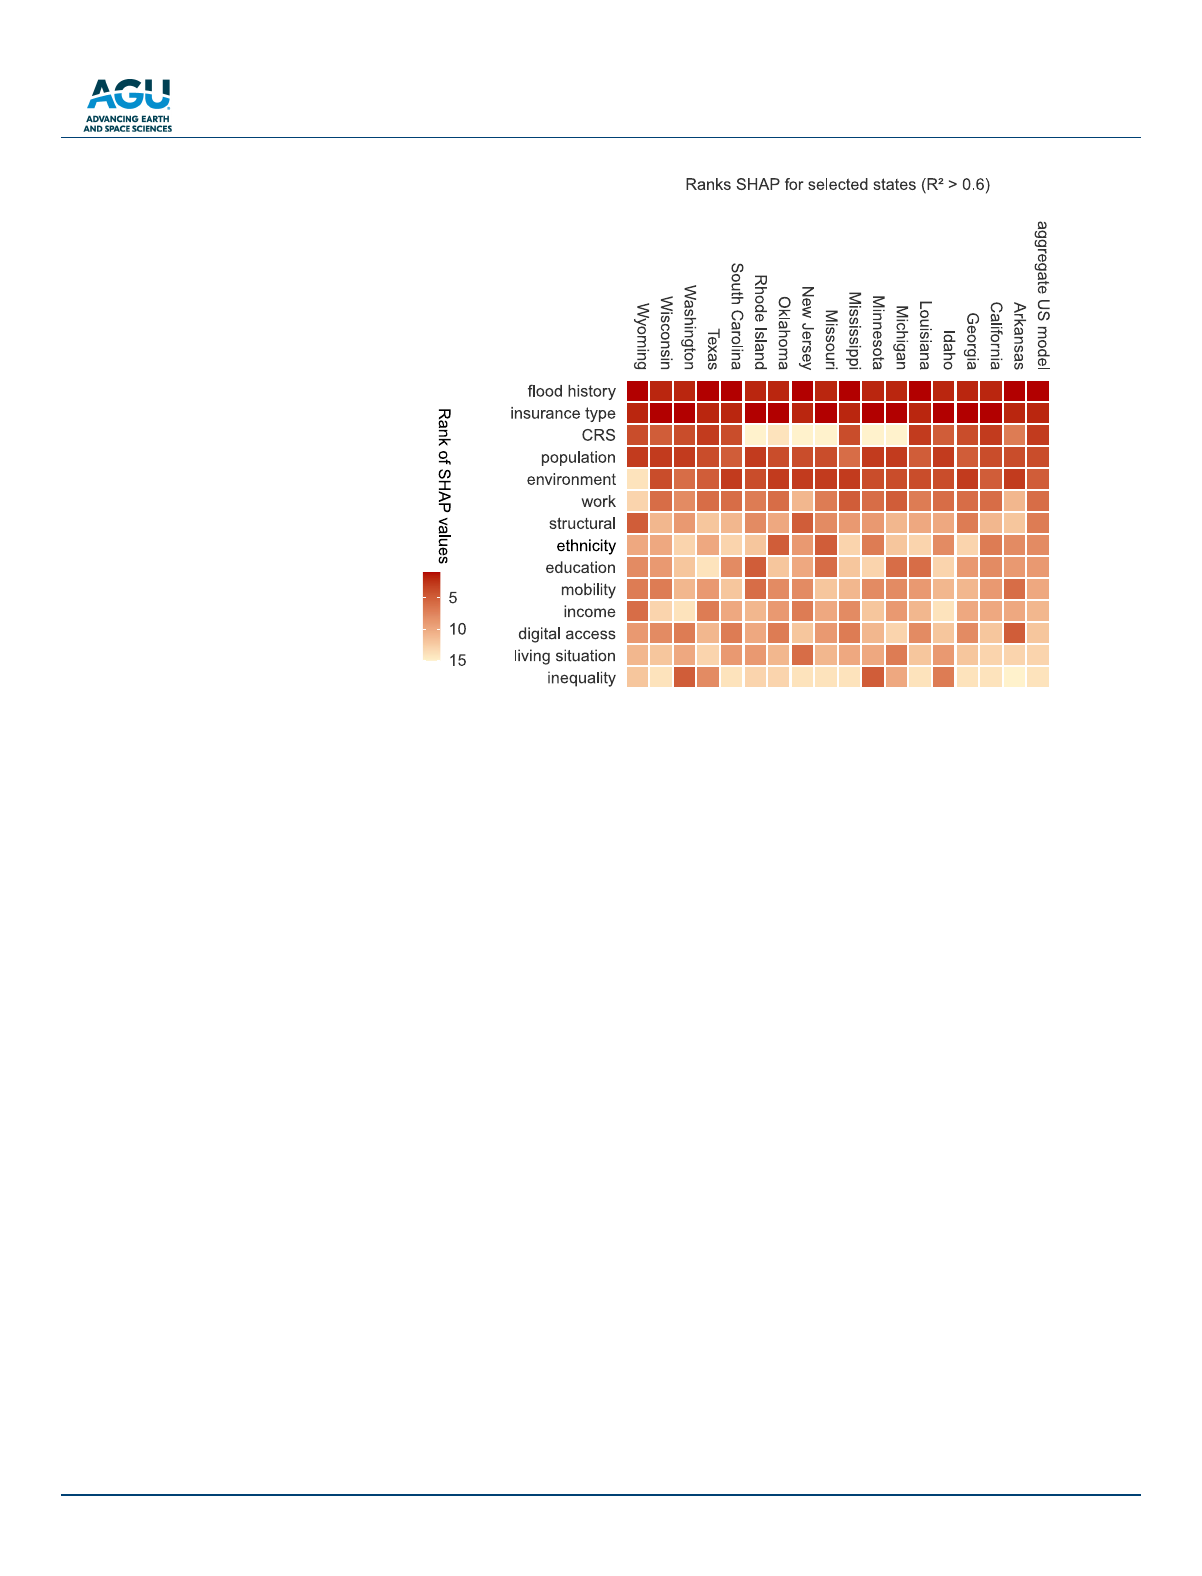
Individual state-level and aggregate US model alike indicate that flood history is the most important predictor
of flood insurance coverage (Figure1). The top-ranked flood history feature summarizes both flood frequency
Earth’s Future
VEIGEL ETAL.
10.1029/2023EF003571
5 of 11
(regular) and severity (severe) (see Section2). Both the feature ranking in Figure1 and spatial patterns of flood
severity, flood frequency, and their SHAP values in Figures2a–2e reveal that flood insurance purchase is a reac-
tive behavior, triggered by the occurrence of severe or frequent flooding events.
Flood insurance policies are either covering damage to buildings or to their contents. This is the second most
important determinant of flood insurance coverage (insurance type in Figure1). If the majority of insurance poli-
cies in a census tract covers building damage, the SHAP value for this variable increases, that is, there is a strong
correlation with overall flood insurance purchase.
Spatial patterns of population density also correlate with flood insurance purchase, with lower insurance cover-
age associated with high population density, that is, in urban areas (population in Figure1). Typically metropol-
itan areas experience high turnover of residents leading to lesser knowledge of the flood history in those areas.
Therefore urban areas should be in the focus of resilience increasing strategies.
Conversely, other socio-economic backgrounds only marginally correlate with insurance coverage. Features
related to income, structural characteristics of buildings (structural in Figure1), education, and overall living
situation are ranked with lower importance, as shown by the lowest weighted sum of absolute SHAP values.
3.3. Community-Level Policies Foster Proactive Adaptation
The results in Figure1 show that the CRS stands out for positively influencing insurance coverage in a census
tract and helps overcome reactive behaviors, being ranked right after flood history and flood insurance type.
People are more likely to purchase a flood insurance to protect their property and belongings if the community
they live in participates in the CRS. Therefore we implement a second model to classify which communities
participate or do not participate in the CRS. The CRS follows a categorization system with 10 categories with
Figure 1. Feature importance for individual state models and an aggregated US model. Feature importance is quantified
as the weighted sum of absolute SHapley Additive exPlanations (SHAP) values, ranked from top to bottom in descending
order based on the values obtained for the aggregate US model. The graph shows feature groups including age, gender, and
population density (population), the area within floodzones (environment), work-related characteristics such as the average
daily working hours (work), and information about the building (structural). Only individual-state models that achieved a
training performance with R
2>0.6 are selected for representation. Maximum number of affected people or annual average
number of floods (combined in the feature group of flood history) is the most relevant determinant of flood insurance
purchase for all states.
Loading more pages...