
Mobile Crowdsensing Services for Tinnitus Assessment and Patient Feedback
R¨
udiger Pryss1, Winfried Schlee2, Berthold Langguth2, Manfred Reichert1
1Institute of Databases and Information Systems, Ulm University, Germany
2Clinic and Policlinic for Psychiatry and Psychotherapy, University of Regensburg, Germany
1{ruediger.pryss, manfred.reichert}@uni-ulm.de
Abstract—Assessment of chronic disorders requires new
ways of data collection compared to the traditional pen &
paper based approaches. For example, tinnitus, the phantom
sensation of sound, is a highly prevalent disorder that is difficult
to treat; i.e., available treatments are only effective for patient
subgroups. In most individuals with tinnitus, loudness and
annoyance of tinnitus varies over time. Currently, established
assessment methods of tinnitus neither systematically assess
this moment-to-moment variability nor environmental factors
having an effect on tinnitus loudness and distress. However,
information of individual fluctuations and the effect of envi-
ronmental factors on the tinnitus might represent important
information for tinnitus subtyping and for individualized treat-
ment. In this context, a promising approach for collecting
ecological valid longitudinal datasets at rather low costs is
mobile crowdsensing. In the TrackYourTinnitus project, we
developed an advanced mobile crowdsensing platform to reveal
more detailed information about the course of tinnitus over
time. In this paper, the patient mobile feedback service as
a particular component of the platform is presented. It was
developed to provide patients with aggregated information
about the variation of their tinnitus over time. This mobile
feedback service shall help a patient to demystify the tinnitus
and to get better control of it, which should facilitate coping
with this chronic health condition. As the basic principles
and design of this mobile services are also applicable to
other chronic disorders, promising perspectives for disorder
management and clinical research arise.
Keywords-Mobile Crowdsensing, Mobile Healthcare Appli-
cation, Patient Feedback, Mobile Healthcare Service, Mobile
Service.
I. INTRODUCTION
Healthcare craves for new ways of collecting large and
ecological valid longitudinal data. This applies to the as-
sessment of tinnitus as well. Tinnitus is a highly prevalent
disorder, for which currently no sufficient therapy exist [1].
Furthermore, Tinnitus is a purely subjective sensation that
can only be assessed by the report of the individual patient.
The pathophysiology of tinnitus is incompletely understood
and clinical trials frequently reveal contradictory results.
Presumably, these non-conclusive results can be explained
by the fact that tinnitus is not a homogeneous clinical entity.
Instead, there exist many forms of tinnitus, varying in their
clinical characteristics as well as in the response to specific
therapeutic interventions [2], [3]. Additional complexity is
introduced by the fact that the perception of tinnitus loudness
and distress is not constant in most cases, but varies over
time depending on the context (e.g., environmental sound
level or stress) [4].
Currently, tinnitus is assessed based on questionnaires,
visual analogue scales or psychoacoustic measurements.
However, these assessment methods, which are used both
in clinical practice and research, do not capture the within-
day and between-day variability of tinnitus loudness and
distress over time. Moreover, contextual and environmental
influence on Tinnitus loudness questions the current routine,
where assessments are performed in most cases in clinics
or at home, but practically never during work or any other
activity of daily life. In order to mitigate these shortcomings,
new ways of collecting ecological valid longitudinal datasets
at rather low costs from patients during their daily life
are required. For this purpose, we developed the mobile
crowdsensing platform TrackYourTinnitus (TYT). The latter
tracks individual tinnitus perception using smart mobile
devices of users. The tracking procedure comprises a specific
questionnaire we developed to assess tinnitus perception
and tinnitus-related parameters during the daily routine of
a user. Additionally, the smart mobile device of a user
records the environmental sound level, while the user fills
in the assessment questionnaire. Results are transferred to
the TYT backend that, in turn, offers features enabling
researchers to evaluate gathered patient data. Note that in
the context of personalized healthcare, mobile crowdsensing
offers completely new perspectives [4]–[7] on the daily
routine of patients.
The analysis of the first data assessed with TYT [4], [8],
[9] has confirmed the hypotheses of (1) a relevant variability
of tinnitus loudness and annoyance for the majority of pa-
tients and (2) an interaction with exogenous and endogenous
factors. These findings have high relevance for individual
patients: The TYT may detect specific relationships between
influencing factors and tinnitus annoyance, which have not
been identified by patients in conventional studies before.
For example, tinnitus annoyance may depend on the stress
level the patient had the day before. Information of the
patients about such relationships may (1) help gaining more
control about a symptom that seemed to be completely un-
controllable, (2) provide guidance for behavior and thus help
to better cope with tinnitus and perceive the tinnitus as less

stressful. Moreover, smart feedback on tinnitus variability
and influencing factors is expected to motivate users to use
the mobile TYT services.
Such results highlight the potential of Ecological Mo-
mentary Assessment (EMA; also known as: ambulatory
assessment & experience sampling), which is provided by
TYT, to support clinicians in assessing neuropsychiatric
symptoms accurately and in making valid diagnoses. In
EMA, the variable in question (e.g., symptoms) is assessed
repeatedly in daily life [10]. Instead of retrospectively asking
the individuals (in an interview or questionnaire) how strong
they experienced a symptom in a given past time interval,
the individuals are asked how they currently experience the
symptom; this is done at several time points within the given
time interval.
This paper presents the mobile feedback service of the
TYT platform. We provide detailed backgrounds, present
technical issues, and discuss the perspective of patients on
the feedback service. In this context, the developed feedback
service is expected to increase general user motivation. The
remainder of this paper is organized as follows: Section II
introduces the TYT platform and its main features. In Section
III, the mobile service for patient feedback is presented.
Finally, Section IV discusses related work and Section V
concludes the paper with a summary and outlook.
II. THE TRACKYOURTINNITUS PLATFORM
The TYT mobile crowdsensing platform aims at measuring
fluctuations of tinnitus perception and tinnitus distress under
real life conditions during the patient’s day. In particular,
mobile crowdsensing services shall enable researchers to
gather data from huge numbers of users. Note that this
allows tracking the moment-to-moment fluctuation of the
tinnitus. Furthermore, tracked data may be related to ev-
eryday behavior as well as the daily routine of patients
to systematically identify relationships between individual
routines and tinnitus fluctuations. Moreover, the TYT mobile
crowdsensing platform can be further developed to assess the
effects of specific standardized therapeutic interventions.
We developed the TYT mobile crowdsensing platform as a
multidisciplinary research team consisting of psychologists,
physicians, and computer scientists. The platform comprises
a website for user registration, two mobile applications (for
iOS and Android), and a MySQL database as a central
repository for the data collected [6], [11], which can be
made available to the clinicians and researchers. The website
also provides two important other features: (1) users can
visualize their recorded tinnitus data and (2) users can
provide information about their current tinnitus treatment.
In order to be able to track the daily tinnitus perception, the
following procedure must be accomplished by a user.
First, users have to create an TYT account using our
website.
Second, after registering, users have to fill in three regis-
tration questionnaires. First, users have to fill in the “Mini-
TQ-12” questionnaire, which measures tinnitus-related psy-
chological problems. Second, users have to fill in the “Tin-
nitus Sample Case History Questionnaire (TSCHQ)”. The
TSCHQ questionnaire determines the current tinnitus status
of the user as well as his tinnitus history. Finally, users
have to fill in the “Worst Symptom” questionnaire. This
questionnaire asks the user about his current worst symptom
caused by tinnitus. While the first two questionnaires consti-
tute already used instruments, the third one have been newly
developed by the authors. Altogether, users have to complete
58 questions with respect to the three questionnaires. The
completion of these three questionnaires is a prerequisite to
be able to use the TYT website features as well as the mobile
applications.
Third, after the registration questionnaires have been
completed, a user can use the mobile applications to track
the daily tinnitus perception. Therefore, the user has to log
in to the Android or iOS mobile application. Then, he is
asked to fill in the assessment questionnaire developed by
us. The questionnaire comprises 8 questions (cf. Table I) and
rates the tinnitus perception of the user when being asked
(e.g., current tinnitus loudness).
Fourth, the assessment questionnaire, in turn, is provided
in two ways: (1) the mobile application automatically applies
the questionnaire to the user or (2) the user makes the
conscious decision to fill in the questionnaire. The first
way is our desired procedure and realized as follows: The
assessment questionnaire is randomly presented to the user
up to 12 times per day. Therefore, we realized a notification
feature for Android and iOS as well as a notification
algorithm [6]. This procedure of applying the assessment
questionnaire ensures that (1) users cannot foresee the time
of being asked and that (2) users are asked in various daily
situations. Such a randomized approach was realized in order
to improve the ecological validity of the method applied.
Fifth, while filling in the assessment questionnaire, the
smart mobile device of a user records the environmental
sound level. Currently, the sound level measurements are
evaluated in more detail. One question, among others, that
arises is based on the fact whether measurements of the iOS
platform and the Android platform are comparable.
Sixth, finally, results gathered with the assessment ques-
tionnaire and sound recording are transferred to the TYT
database. The latter, in turn, offers features enabling re-
searchers to evaluate gathered patient data. This feature has
been used for the results presented in this paper.
III. PATIENT FEEDBACK
Experiments we had conducted with the TYT platform
and its mobile services revealed that proper feedback on
the collected data is essential for users in order to increase
their motivation for regularly using the mobile app. Note that

Question Scale Measurement
of
1
Did you perceive the tinnitus right now? BS Perception
2
How loud is the tinnitus right now? VAS Loudness
3
How stressful is the tinnitus right now? VAS Strain
4
How is your mood right now? VAS Mood
5
How is your arousal right now? VAS Arousal
6
Do you feel stressed right now? VAS Stress
7
How much did you concentrate on the things
you are doing right now?
VAS Concentration
8
Do you feel irritable right now? BS Irritability
BS=Binary Scale, VAS=Visual Analogue Scale
Table I: TrackYourTinnitus Assessment Questions
proper feedback constitutes a salient incentive for patient
engagement in the context of mobile healthcare services
in general [12]. Regarding tinnitus, for example, a well-
designed feedback function should provide the patients
with information that allows them to better understand the
dependencies between tinnitus loudness and annoyance on
environmental factors. This information shall help them to
demystify tinnitus, to obtain an improved control, and to
better cope with their tinnitus. Our results confirm that about
40 percent of the tinnitus variance can be explained with the
variance of exogenous and endogenous factors. If individual
users have understood this relationship, they can get better
control over their tinnitus. Motivated by this data gathered
with TYT, we developed a sophisticated mobile feedback
service. The latter was integrated with both the TYT backend
and the Android mobile application.
In general, different approaches for providing mobile
feedback can be distinguished. First of all, feedback could
be provided by medical experts based on the information
gathered with the smart mobile device. Alternatively, feed-
back can be automatically generated by smart services and
information systems respectively. Furthermore, the way how
feedback is provided to users is essential. TYT comprises a
mobile feedback service that automatically generates user
feedback and additionally provides the option for transfer-
ring selected information to the treating physician, who can
then give feedback. Whether feedback is based on real time
data only or also considers historical data constitutes another
differentiation. The TYT service considers historical data
gathered with the assessment questionnaire. Based on this
data, individual feedback is calculated automatically.
Finally, we learned that the ability to configure parameters
relevant for feedback calculation is highly welcome by users.
TYT allows them to specify a time window that shall be
applied to the personal data gathered with the assessment
questionnaire. If a user specifies the respective parameter,
feedback calculation will be limited to the specified time
window. Therefore, the parameter allows patients to check
whether the received feedback has evolved over time.
This section presents the TYT mobile feedback service
along three perspectives. First, we sketch the overall feed-
back procedure and present factors relevant in this context.
Second, we discuss the user perspective on the feedback
service. Finally, we present technical issues related to the
developed feedback algorithms.
A. Overall Feedback Procedure
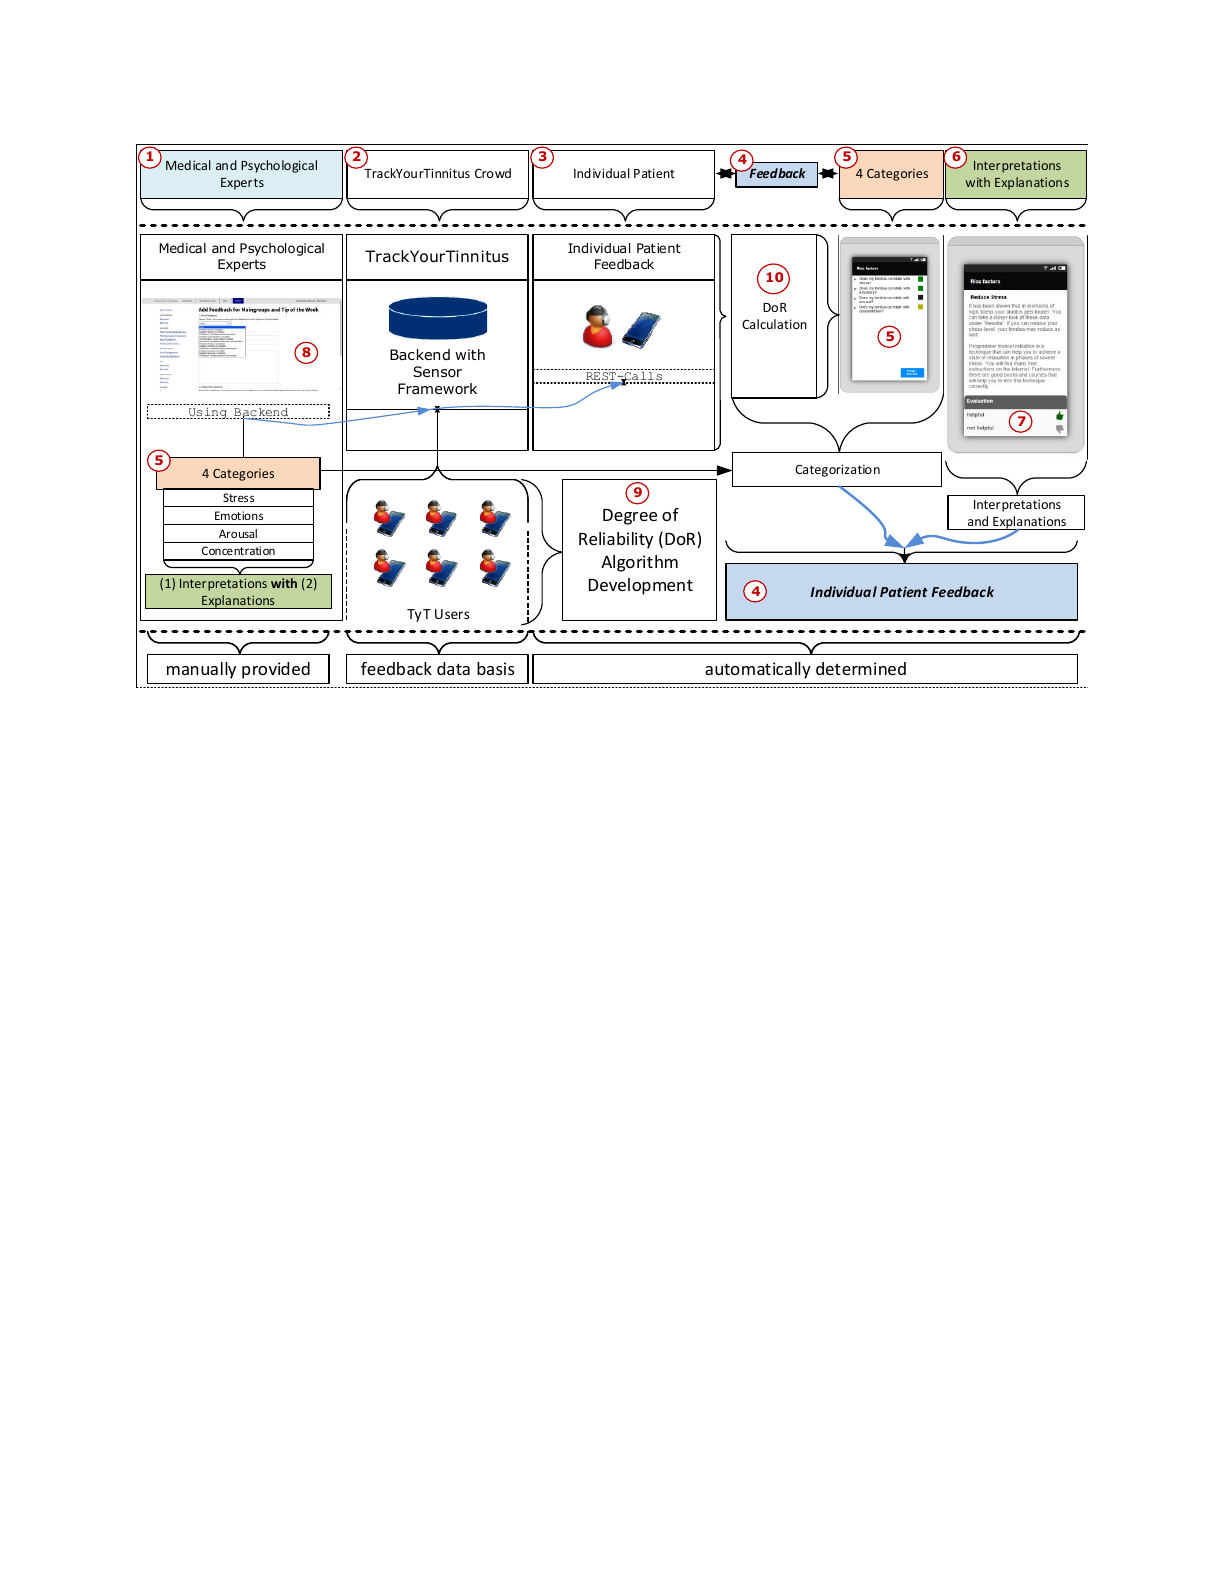
Fig. 1 gives an overview on the mobile feedback service.
Its general idea is to categorize patients based on the
collected data and to provide specific feedback depending on
the category the patient is assigned to. Accordingly, patients
are categorized based on their questionnaire data. The cat-
egorization of individuals will be calculated automatically.
For example, if in a given individual the tinnitus loudness
correlates with stress levels, the person will be automatically
assigned to category stress.
Altogether, we identified four categories (cf. Fig. 1 5
).
The four patient categories are derived based on analyses of
the data collected by all TYT users (cf. Fig. 1 2
). Thereby,
we focused on the correlation of subjective loudness (cf.
Table I, Question 2) with other measurements (cf. Table I,
Questions 3-8). If we had observed a particular correlation
for a considerable subset of the patients, we derived a
corresponding feedback category. This analysis revealed that
a correlation with Question 1 is not relevant. Note that
Question 1 solely considers the current tinnitus situation.
That means, patients may not perceive the tinnitus right now,
but perceive it in general. The remaining correlations for
strain (cf. Table I, Question 3) and irritability (cf. Table
I, Question 8) require further considerations before taking
them into account.
Assigning patients to one of the four categories constitutes
the first part of the feedback procedure (cf. Fig. 1 5
).
Furthermore, each category is coupled with specific interpre-
tations. These interpretations, in turn, are created by medical
experts using the TYT backend and include, for example,
general recommendations (cf. Fig. 1 8
). If a relationship
between perceived stress and perceived tinnitus is detected,
for example, the feedback about it further includes the
information that there exist specific approaches for stress
reduction (cf. Fig. 1 6
). These interpretations, in turn, are
assigned to one or more of the categories, again with
the help of the TYT backend (cf. Fig. 1 6
). Furthermore,
interpretations are associated with detailed explanations that
will be created by the medical experts as well. Patients
may rate these explanations (cf. Fig. 1 7
) to inform the
medical experts whether they have benefited from it. The
interpretations together with the explanations constitute the
second part of the feedback. Moreover, the two discussed
parts form the entire feedback for an individual patient (cf.
Fig. 1 4
). Technically, the feedback will be provided by the
TYT mobile feedback service.
There are two additional aspects of the TYT mobile feed-
back service. First, we developed a metrics called degree
of reliability (dor) (cf. Fig. 1 9
). The latter is calculated for
Backend with
Sensor
Framework
TrackYourTinnitus Individual Patient
Feedback
REST-Calls
Medical and Psychological
Experts
Using Backend
TyT Users
manually provided feedback data basis automatically determined
Degree of
Reliability (DoR)
Algorithm
Development
Categorization
Interpretations
and Explanations
Individual Patient Feedback
DoR
Calculation
4 Categories
Stress
Emotions
Arousal
Concentration
(1) Interpretations with (2)
Explanations
4 Categories Interpretations
with Explanations
Individual Patient
TrackYourTinnitus Crowd
Medical and Psychological
Experts Feedback
1 2 3 45 6
4
5
5
7
8
9
10
Figure 1: Patient Feedback Overview
each feedback category, indicating whether the amount of
collected patient data is sufficient. To evaluate sufficiency for
an individual patient, we considered collected data of all TYT
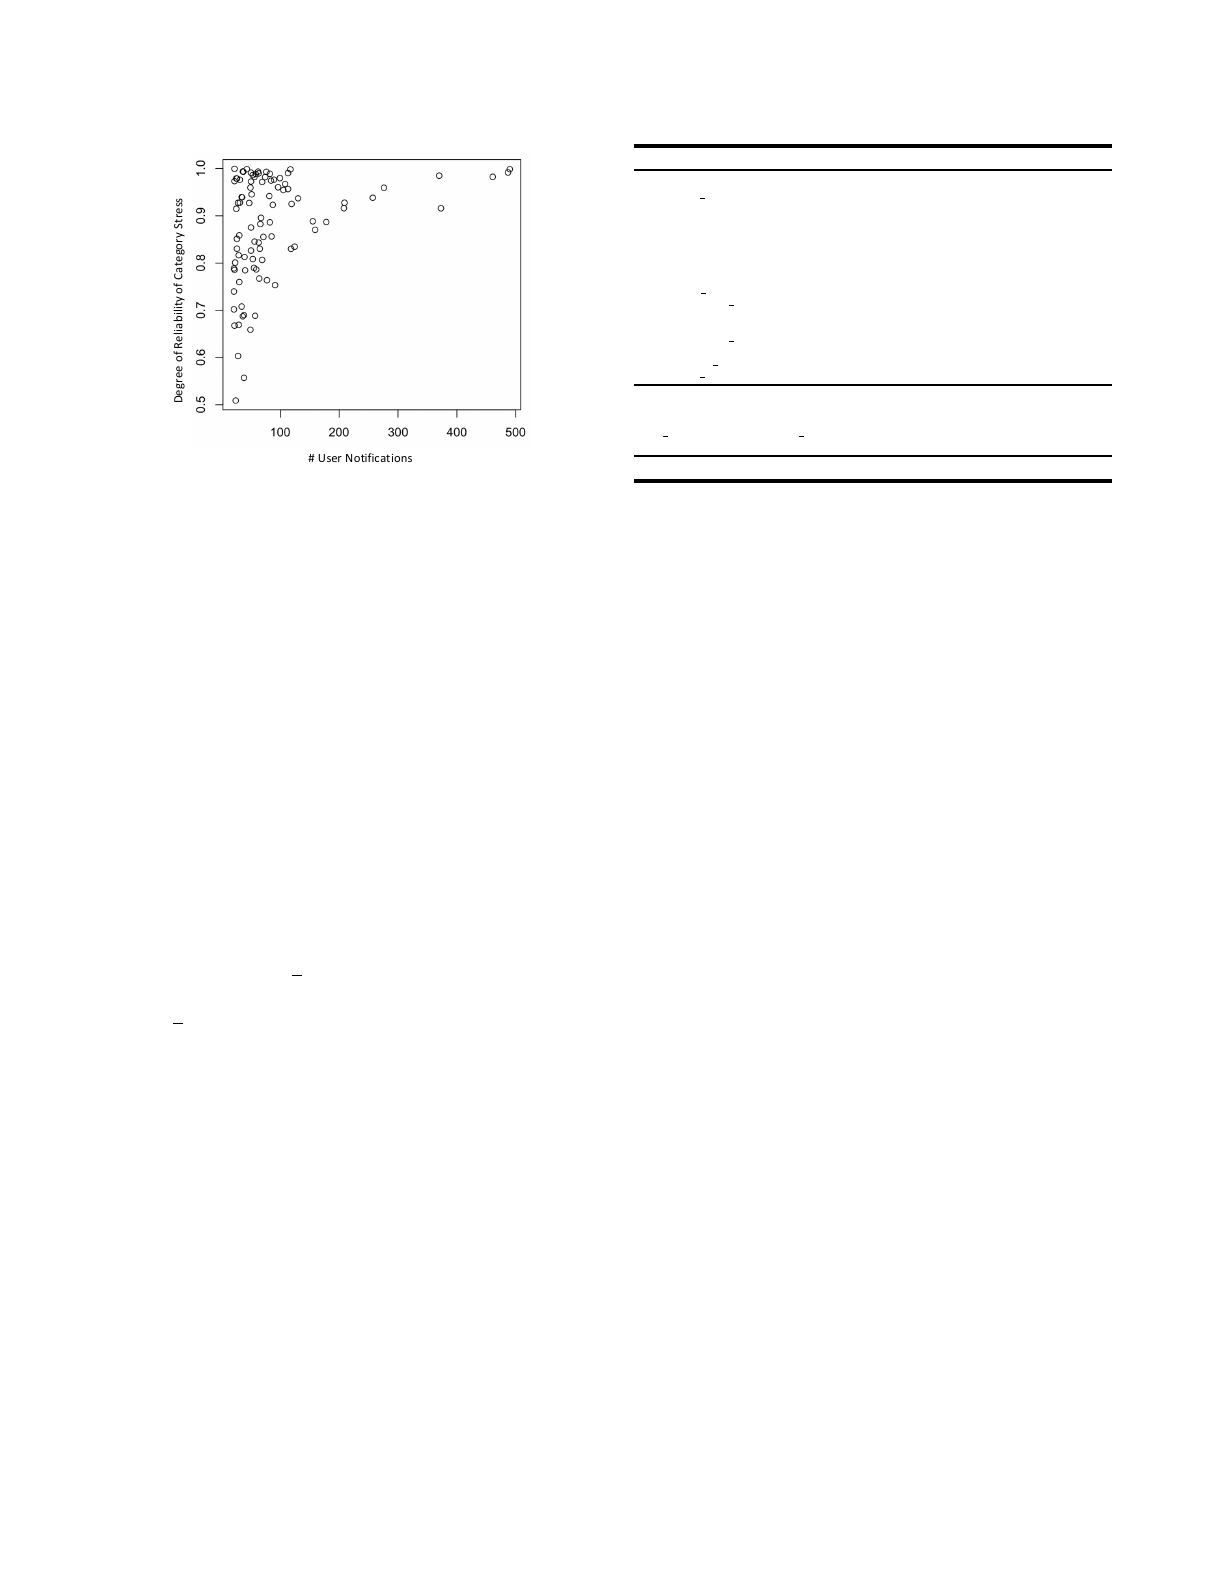
users. Thereby, different perspectives were considered. For
example, we calculated dor for category stress and related
it to the amount of user notifications (cf. Fig. 2). Based on
this, we developed a scale for dor as depicted in Fig. 4 3
.
Note that dor ≥0.6must hold in order to start calculating
the correlation for a category. For example, if the calculated
dor for category stress is less than 0.6, the calculation
needed for deciding whether the patient belongs to this
category will not be started. If there are not enough data for
categorizing a user, the TYT mobile feedback service returns
this information to TYT users. Note that each category is
considered independently with respect to the needed amount
of data. This allows patients to obtain direct and valuable
feedback on their collected data. Either they unveil that not
enough data was collected or that feedback evolves over
time.
Second, the correlation of a category is based on the
Pearson product-moment correlation coefficient (PCC) [13]
(cf. Fig. 110
). Recall that the degree of reliability (dor)
is coupled with the correlation calculation such that PCC
is only calculated if dor ≥0.6holds. To tie correlation
calculation with the degree of reliability revealed two advan-
tages: First, patients may compare their assignments among
the four categories. For example, if a patient belongs to
category stress, but not to concentration, more data needs
to be collected with respect to concentration (cf. Table I
Question 7). Second, the dor scale is based on all patients.
Therefore, individuals will benefit from collected data of all
TYT users.
B. Patient Perspective
Another fundamental perspective on the TYT mobile
feedback service is the one of the patient. Fig. 3 presents
examples of feedback screens regarding the smart mobile
device of a patient. Additionally, the interactions between
the screens are shown in Fig. 3. Patients use the feedback
as follows: First, they click on My Feedback (cf. Fig. 3 1
).
Second, after clicking on My Tinnitus, they configure the
period of time for feedback calculation (cf. Fig. 3 2
). Note
that Fig. 3 2
solely illustrates the specification of the start
date for this calculation. Another screen is used for the
end date. Third, the screen showing the categorization is
presented to the mobile user (cf. Fig. 3 3
). Note that this
screen is only presented if at least one degree of reliability
of {mood, arousal, stress, concentration} ≥ 0.6holds (cf.
Figs. 3 3
, 4 2
). In Fig. 3, for example, the result for
category arousal indicates no correlation for the tinnitus of
the respective patient, as the calculated degree of reliability
is less than 0.6.Fourth, a patient may expand a category
in order to get all interpretations assigned to this category
(cf. Fig. 3 4
). If patients click on interpretations, the screen
presented in Fig. 3 5
is displayed. Finally, patients may
return feedback to the selected interpretation (cf. Fig. 3 8
).
Degree of Reliability of Category Stress
# User Notifications
Figure 2: Degree of Reliability of Category Stress and User
Notifications
C. Technical Perspective
We developed two algorithms for calculating proper user
feedback. One of them determines the degree of reliability
(dor), the other algorithm assigns patients to one of the four
categories presented; e.g., if the tinnitus loudness correlates
with stress of the respective user, the user will be assigned
to the category stress. Note that both algorithms operate
on the patient data gathered with the mobile assessment
questionnaire. This data, in turn, is captured by entity
standardanswers (cf. Table II).
As shown in Table II, entity standardanswers comprises
17 attributes. In the context of the two algorithms, several
of these attributes are considered: First, attributes question2
and question4-question7are used to calculate the degree
of reliability as well as the assignment of users to categories.
Second, attribute user id represents the particular user for
whom the feedback shall be calculated. Third, attribute
created at represents the date the assessment questionnaire
was stored in the TYT database. Finally, the SQL command
depicted at the bottom of Table II is used for calculating the
patient feedback.
Prior to the feedback calculation (cf. Algorithm 2), the
degree of reliability is determined by Algorithm 1. The
decision which degree of reliability will be calculated by
this algorithm is based on input parameter correlation.
For example, if correlation has value ’Stress’, the degree
of reliability for category stress is calculated. Furthermore,
input parameter standardanswers is used. Note that pa-
rameters loudness and tocorrelatewith are important as
they constitute the two dimensions the degree of reliabil-
ity is calculated for. Following this, tocorrelatewith may
have values mood, arousal, stress, concentration. Based on
these considerations, Algorithm 1 calculates the degree of
reliability as follows (cf. Algorithm 1, Lines 17-29):
1) Sort array loudness in ascending order.
Name Type Explanation
PK id int −
FK user id int −
For detailed question explanations see Table I
question1 tinyint −
Next line represents 6 database rows
question2-7 float Rows for Question 2 -
Question 7
question8 tinyint −
soundlevel float −
save date datetime Local Storage Time on Mobile Device
notification date datetime Local Notification Time on Mobile Device
autosaved tinyint User Forgets Pressing Save Button
→Try Automatic Save
notification fixed tinyint Indicates Notification Schema
→Random (0) or Fixed (1)
created at datetime Storage Time on Remote Database
user agent text Device Attributes
SQL-Command for Date Input (startdate,enddate) of User $feedbackuser
SQLF=”SELECT question2, question4, question5, question6, question7 FROM ‘standardanswers‘ WHERE
user id = $feedbackuser and (created at BETWEEN $startdate AND $enddate) ORDER BY question2 ASC”
−= no explanation needed due to name of row
Table II: Entity standardanswers
2) Sort array tocorrelatewith according to the ordering
of loudness. To identify corresponding entries, the
primary key of entity standardanwers is used.
3) Split array loudness into two subarrays of equal
length. The first subarray comprises all loudness el-
ements of standardanswers with even index num-
ber; the second one, the elements with uneven index
number.
4) Split array tocorrelatewith into two arrays of equal
length.
5) Note that Steps 1 to 4 became necessary to ensure
that the variance among the subarrays is equal from a
statistical point of view.
6) Calculate Pearson product-moment correlation coef-
ficients (PCC) [13], [14]1: The first PCC is calcu-
lated based on the first subarray of loudness and
the corresponding subarray of tocorrelatewith. The
second PCC, in turn, is calculated based on the second
subarray of loudness and the corresponding subarray
tocorrelatewith.
7) Normalize the results by adding 1 to both PCCs; i.e.,
ensure that the result of the next calculation will be
between 0 and 1.
8) Evaluate which PCC has a higher value and divide the
lower PCC by the higher PCC to ensure normalization.
Note that the result of the division takes two PCCs into
account and hence establishes the degree of reliability
between arrays loudness and tocorrelatewith.
9) Store division result to variable dor ∈[0,1].
The scale to evaluate degree of reliability values is shown
in Fig. 4 3
. Values below 0.6indicate that not enough
data for the respective category exist. Accordingly, the
respective patient gets the feedback that not enough data
has been gathered so far (cf. Fig. 3, Category arousal). In
turn, values above 0.6indicate that enough data has been
1PCC represents a common way to calculate a correlation of two sets.
Loading more pages...