How do we identify flash droughts? A case study in Central European Croplands
Pedro Henrique Lima Alencar a
,
b,*and Eva Nora Paton a
a
Ecohydrology and Landscape Evaluation, Institute of Ecology, Technical University of Berlin, Berlin, Germany
b
Agricultural Engineering, Agricultural Sciences, Federal University of Ceará, Benfica, Fortaleza, Brazil
*Corresponding author. E-mail: [email protected]in.de
PHLA, 0000-0001-6221-8580; ENP, 0000-0002-5619-9958
ABSTRACT
Many definitions and delineation methods exist for identifying flash droughts (FDs), which are events of rapid and unusual large depletion of
root-zone soil moisture, in comparison to average moisture conditions, due to climatic compound conditions over a short period of several
weeks. Six FD identification methods were compared to analyse their functioning using data from several experimental cropland sites across
Central Europe. Co- and misidentification of the FD time series were assessed using confusion and synchronicity metrics on a local scale.
Even though a large degree of synchronicity of individual FD events was observed, some divergence in drought periods was detected,
which was related to four intrinsic differences in the underlying FD definitions: (1) type of critical variable; (2) velocity of drought intensifica-
tion; (3) pre-set threshold values for final depletion and/or (4) minimum length of the duration of FDs. To balance the strengths and
weaknesses of those methods that are not based on soil moisture, we suggest using an ensemble approach for event identification,
which is validated in this study for the temperate central European region. In doing so, the current unclearly defined sub-types of FDs
can be detected, regardless of the different combinations of compound drivers and differences in intensification dynamics. All methods
were implemented in an R package and are available as a Shiny app for the public.
Key words: climatic compound events, confusion matrix, event identification, flash drought, synchronicity metrics
HIGHLIGHTS
•The multiple methods proposed to identify flash droughts (FDs) show substantial disagreement.
•Soil moisture is the key variable to identify FDs in croplands; however, such data are scarce, and a method based on proxy variables is
necessary.
•A multi-index or multi-method should be favoured in identifying FDs, as a single proxy (to soil moisture) may cause significant
misidentification.
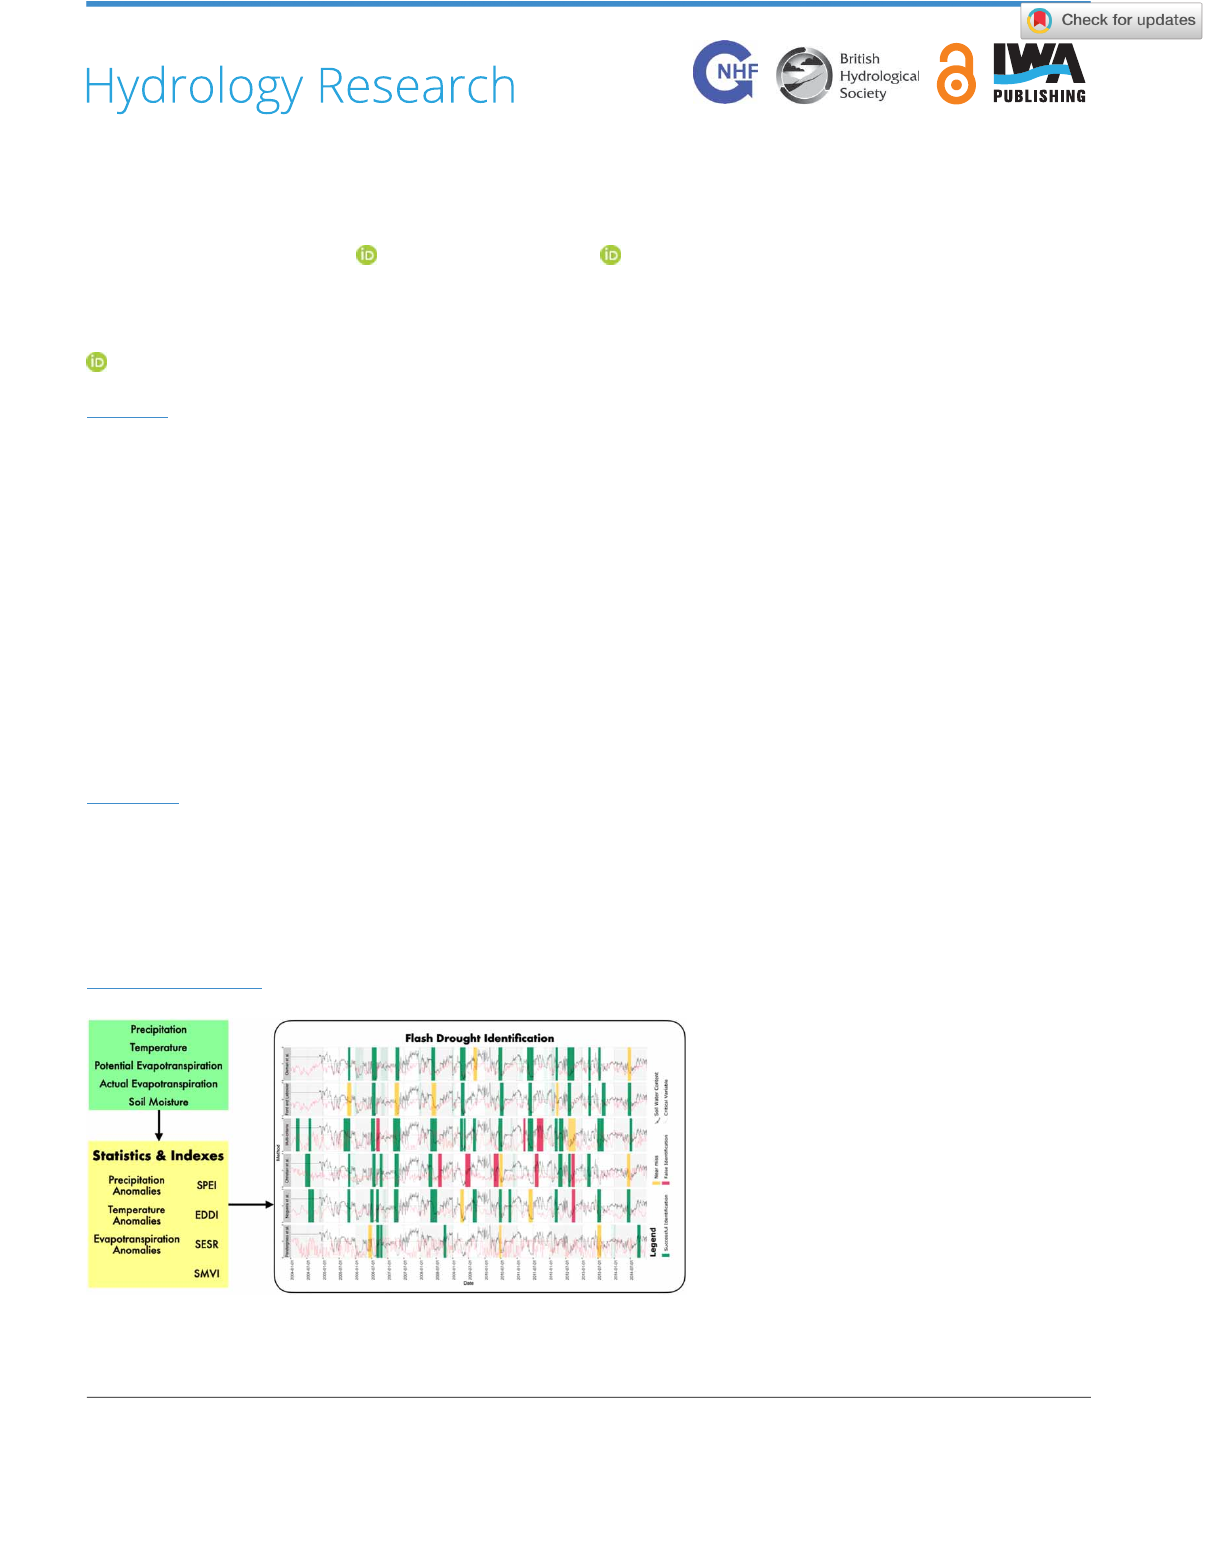
GRAPHICAL ABSTRACT
This is an Open Access article distributed under the terms of the Creative Commons Attribution Licence (CC BY 4.0), which permits copying, adaptation and
redistribution, provided the original work is properly cited (http://creativecommons.org/licenses/by/4.0/).
© 2022 The Authors Hydrology Research Vol 53 No 9, 1150 doi: 10.2166/nh.2022.003
Downloaded from http://iwaponline.com/hr/article-pdf/53/9/1150/1113768/nh0531150.pdf
by TU BERLIN user
on 15 November 2023

1. INTRODUCTION
Droughts are among the most extreme climatic weather events that threaten food security (FAO 2021). They have negative
impacts on the global food–energy–water nexus and the sustainable development goals (D’Odorico et al. 2018). Droughts are
generally characterised by unusually high levels of rainfall deficit, runoff deficit or soil moisture deficit (Palmer 1965;Mishra
& Singh 2010) and are expected to increase in many regions of the world in terms of frequency, severity and duration under
current and future climate change conditions (Lesk et al. 2016;Samaniego et al. 2018).
Flash droughts (FDs) are a special form of drought. In contrast to the descriptions of classical droughts (de Araújo &
Bronstert 2015;Oikonomou et al. 2020), FDs are characterised by rapid onset and relatively short durations (Otkin et al.
2018;Lisonbee et al. 2021). They are associated with severe and immediate soil moisture depletions, resulting in plant
water stress and mortality (Ford & Labosier 2017;Liang & Yuan 2021;Osman et al. 2021).
One of the first FD studies was by Peters et al. (2002), who were among the first to study single short drought events in late
summer, which were characterised by the concurrence of low antecedent moisture and unusually high temperature. Interest
in FDs has increased over the last few years, motivated by extreme FD occurrences in the USA, Russia and China, which
caused extreme impacts on managed vegetation, disruption to the global food supply and increased wildfires (Otkin et al.
2013;Mo & Lettenmaier 2016;Christian et al. 2019a,2019b;Liang & Yuan 2021). An FD in Australia during the spring
of 2019 is thought to have played a central role in the massive forest fires that consumed over 1.6 million hectares
(Nguyen et al. 2021).
Over the last two decades, multiple methods have been proposed to identify FD events (Lisonbee et al. 2021), yet there is no
consensus on what an FD entails and how they may be defined in terms of onset, duration, the velocity of intensification and
absolute or relative changes (Osman et al. 2021). In their recent literature review, Lisonbee et al. (2021) identified as many as
20 studies with different definitions using climate variables or indexes related to soil moisture, air temperature, precipitation,
and actual and potential evapotranspiration (ET). Eleven of these definitions included an interval of intensification or rapid
onset as part of flash flood delineation, whereas nine studies merely considered short-term drought events as FDs. A method
comparison study by Osman et al. (2021) identified four core types where the definition of a heatwave FD (Mo & Lettenmaier
2015) was based on temperature anomalies, rapid soil drying (Ford & Labosier 2017;Yuan et al. 2019), actual and/or poten-
tial ET anomalies (Christian et al. 2019a,Pendergrass et al. 2020) and multi-criteria indexes (Chen et al. 2019). For the USA,
they showed that the FD frequency, spatial extent and onset would vary significantly depending on which definition is used.
They also suggested that a root-zone soil moisture-based method effectively captures the FD onset in both humid and semi-
arid regions. Other than the study by Osman et al. (2021), which focused on the identification of spatial differences in deli-
neated FDs, there have been no systematic studies on the temporal divergence and synchronicity of delineated FDs. At the
same time, little is known about FD dynamics in Central Europe and it is not known which FD method would apply to this
region, given that the present methods have so far been used for FD identification mainly outside Europe. Additionally, little
efforts have been made towards an ensemble method for FD identification. In this study, we propose a method of this nature
tested for areas in Central Europe.
Due to the lack of a general definition, we define an FD as the process of rapid, accelerated and unusually large depletion of
root-zone soil moisture, in comparison with ‘average’moisture conditions, due to the simultaneous or concurrent occurrence
of two or more atmospheric and/or weather conditions over a short period of several weeks during the main growing season.
The objective of this study was to compare, in a local/point (climatological station) scale, the functioning of six recently
developed FD identification methods with data from four well-monitored experimental cropland sites in Central Europe,
by assessing co- and misidentification of FD time series using similarity and synchronicity metrics. We selected two soil moist-
ure-based methods (Ford & Labosier 2017;Osman et al. 2021) and four indirect methods that used single or multiple climatic
variables or indices for FD delineation (Christian et al. 2020;Noguera et al. 2020;Pendergrass et al. 2020, and a multi-criteria
method proposed by the authors and validated for Central Europe). The methods were implemented in an R package and a
Shiny app available to the public.
2. MATERIALS AND METHODS
2.1. FD identification methods
The following six FD identification methods were selected on the basis that they used station data as input and, following our
definition, included a clear definition of the rapid onset of water limitation. The first two methods are based on soil moisture
Hydrology Research Vol 53 No 9, 1151
Downloaded from http://iwaponline.com/hr/article-pdf/53/9/1150/1113768/nh0531150.pdf
by TU BERLIN user
on 15 November 2023

and the other four used indirect proxies of drought conditions, such as anomalies of rainfall, temperature and the ratio of
actual and potential ET. The methods used are described as follows:
M1: Osman et al. (2021) borrowed the concept of volatility from stock market analysis techniques for the analysis of rapid
soil moisture changes. According to them, an FD occurs when the one-pentad (5 d) running average for root-zone soil moist-
ure content falls below the four-pentad (20 d) running average for a period of at least four pentads, with soil moisture at the
end of this period dropping below the 20th percentile for that time of year (Figure 1(a)).
M2: Ford & Labosier (2017) identified FDs as periods when the pentad-average 0–40 cm volumetric water content declines,
from at least the 40th percentile to below the 20th percentile, in four pentads or less (Figure 1(b)).
M3: The multi-criteria method is a new method that uses a set of 10 anomalies and indexes derived from weekly precipitation,
temperature and potential ET data. It calculates a score for each week equivalent to the proportion of indicators that meet or
surpass the respective pre-set thresholds. Weeks with a score higher than 0.65 and an absolute change of score (Δscore) higher
than 0.25 over up to 3 weeks are classified as FDs (Figure 1(c)). The event duration is computed as the time from the beginning
of intensification until the score is below 0.65. A full description of this method is provided in the Supplementary Material.
M4: Christian et al. (2020) used the standardised evaporative stress ratio (SESR), which is derived as the z-score of the quo-
tient of actual to potential ET rate values for a specific pentad. They used four criteria which FD events were required to have:
(1) a minimum length of five SESR changes, equivalent to a length of six pentads (30d minimum length); (2) a final SESR
value below the 20th percentile of SESR values; (3) SESR changes must be at or below the 40th percentile between individual
pentads and no more than one SESR change above the 40th percentile following the previous criterion and (4) an overall
mean change in the SESR during the entire length of the FD must be below the 25th percentile in the SESR (Figure 1(d)).
M5: Noguera et al. (2020) used the standard precipitation evapotranspiration index (SPEI) on a short timescale (1 month)
and performed calculations based on a temporal frequency of 1 week (four per month). To identify the rapid onset of a
drought event, the change in the SPEI for each week, in periods of 4 weeks, was calculated and the onset of an FD was
defined as involving a change in the SPEI equal to or less than 2 SPEI units (z-values) over an intensification period of
4 weeks. Further, final SPEI values had to be equal to or less than 1.28 SPEI units (Figure 1(e)).
M6: Pendergrass et al. (2020) utilised the evaporative demand drought index (EDDI) following Hobbins et al. (2016) and
Lukas et al. (2017), which is calculated based only on the potential ET using the Penman–Monteith equation. The method
identifies an FD when a 50% increase in the EDDI over 2 weeks is sustained for at least another 2 weeks (Figure 1(f)).
Workflow and key characteristics are summarised in Figure 1 and Table 1. Readers interested in a more detailed descrip-
tion of the percentiles and thresholds are referred to the original papers.
The six methods used one or more climate variables (rainfall, temperature, soil moisture and actual and potential ET).
Further, they all share an underlying set of characteristics:
1. FDs evolve rapidly, with an intensification period lasting between 2 and 4 weeks.
2. The final conditions at the end of an FD lean towards extreme values, which are often characterised by the variable reach-
ing values under the 20th percentile or, in some, a z-score value over +1.
3. FDs are considered seasonal phenomena and are identified based on the expected values of climatic variables for each
specific time of the year subdivided either in pentads or weeks.
4. FDs depend on crossing certain thresholds and are thought to be correctly identified if, and only if, environmental con-
ditions meet a set of predefined rules.
The key differences between the methods are how the FD variables and durations are defined. Methods M1 –Osman et al. and
M2 –Ford & Labosier take a direct approach to assess plant water availability using soil water data, whereas all other methods use
proxy variables, which are likely to be less accurate, while simultaneously overcoming severe data limitations. Additionally, differ-
ences exist in the definition of the onset of the FD periods, the time resolution used (weeks and pentads), the minimum period over
which it should be sustained and the maximum duration beyond which it might be considered a ‘normal’drought (Table 1).
Additionally, the definition of event duration varies among methods. Most methods (M1 –Osman et al.,M2–Ford & Labo-
sier, M3 –multi-criteria and M6 –Pendergrass et al.) assume that the duration of an FD event comprises the intensification
phase (between 1 and 3 weeks), a period of persistence of the dry conditions (between 2 and 4 weeks) ending with the recup-
eration phase when the key variable (climatic or groundwater conditions) surpasses a threshold (Table 1). The methods of M4
–Christian et al. and M5 –Noguera et al. have different assumptions regarding duration. M4 –Christian et al. 2019a assume
that the FD event is limited to the intensification period, with the FD event lasting only as long as there is a trend towards dry
Hydrology Research Vol 53 No 9, 1152
Downloaded from http://iwaponline.com/hr/article-pdf/53/9/1150/1113768/nh0531150.pdf
by TU BERLIN user
on 15 November 2023
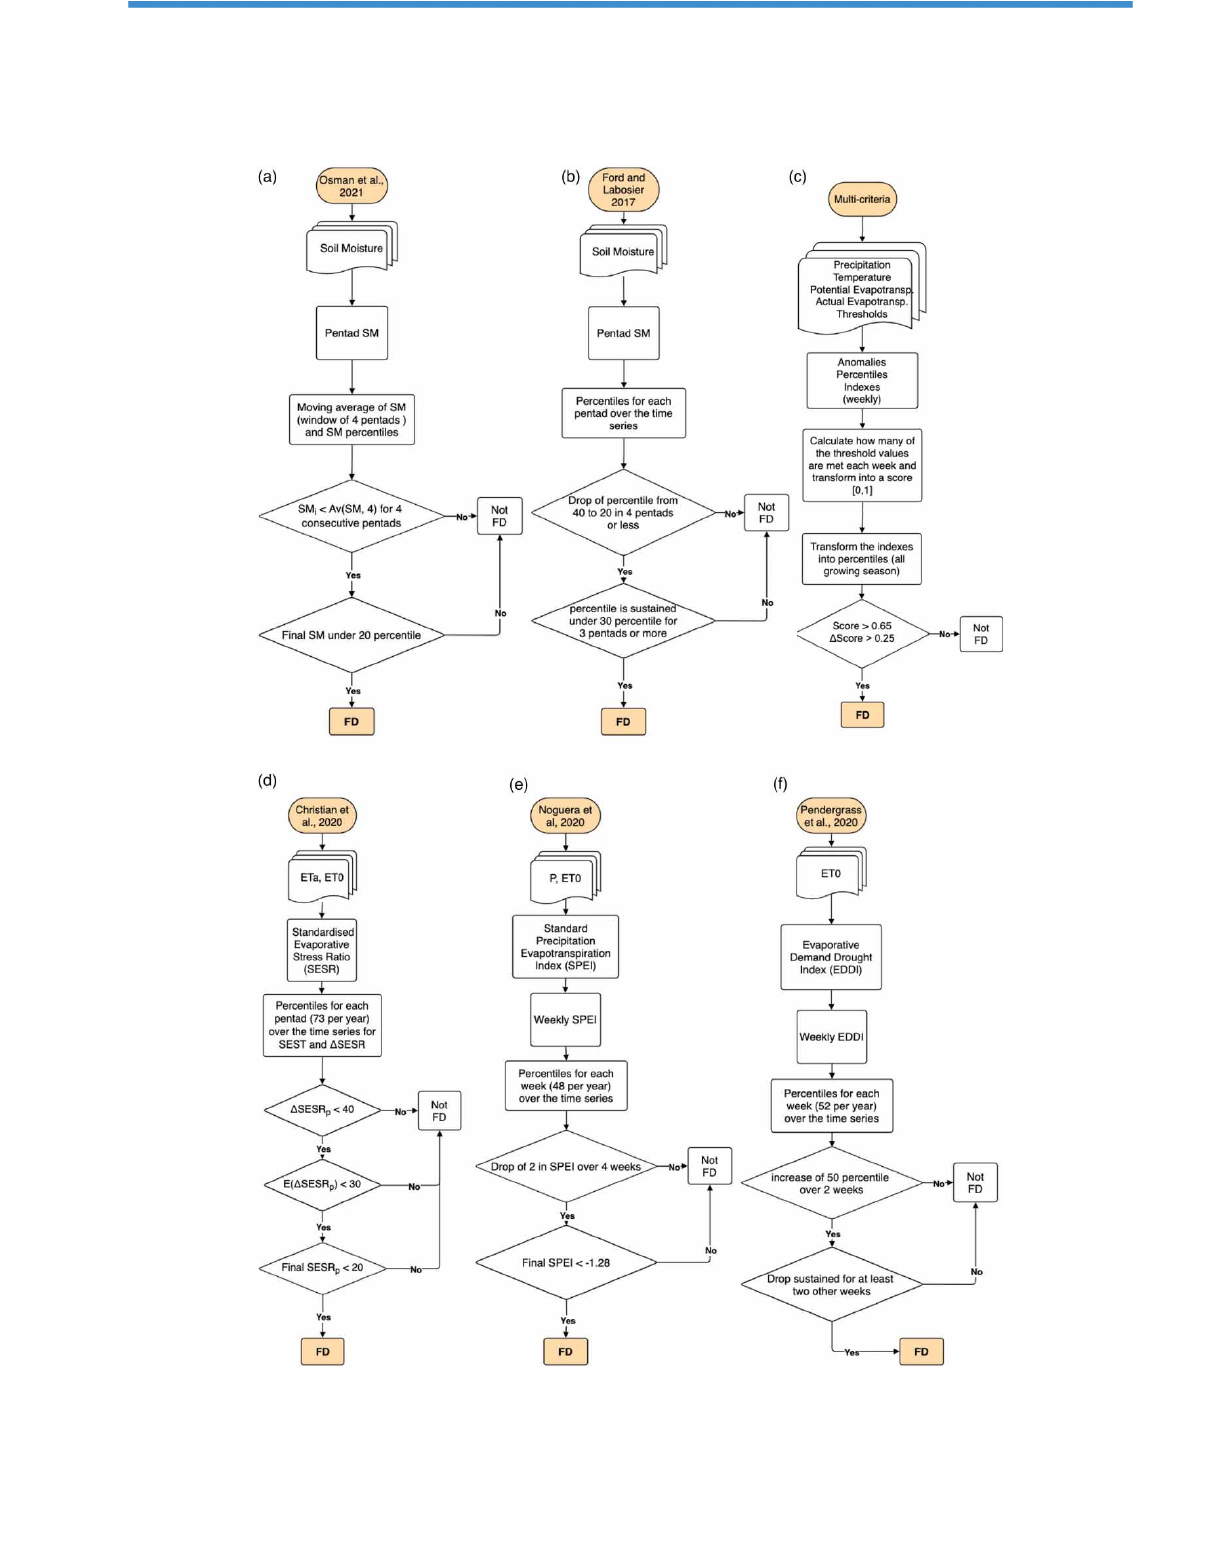
Figure 1 |Flowcharts of the six methods for FD identification: (a) M1: Osman et al. (2021); (b) M2: Ford & Labosier (2017); (c) M3: novel multi-
criteria method; (d) M4: Christian et al. (2020); (e) M5: Noguera et al. (2020); and (f) M6: Pendergrass et al. (2020). The implementation of all
methods is available in the supplements of this paper as an R package.
Hydrology Research Vol 53 No 9, 1153
Downloaded from http://iwaponline.com/hr/article-pdf/53/9/1150/1113768/nh0531150.pdf
by TU BERLIN user
on 15 November 2023

conditions and not having a threshold for the recuperation phase (Christian et al. 2019a). M5 –Noguera et al., although char-
acterizing all three phases (intensification, persistence and recuperation), decided in their work not to consider the
intensification phase as part of the FD duration. In this study, the application of the method of Noguera et al. (2020) includes
the intensification period in the computation of the total duration of FD events.
All six methods were implemented in R programming language and are organised in an R package named ‘fdClassify’
1
and
in a Shiny App named ‘FD-Viz’
2
.
2.2. Comparison metrics
Two types of metrics were used to compare the six FD methods: synchronicity metrics and the confusion matrix. The method
of Osman et al. (2021) was used as a reference method as it was considered the method that most closely followed our defi-
nition of an FD as given in Section 1 (using the rapid soil moisture decline as a key variable for FD identification). This
method was evaluated against measured soil moisture data (see Section 2.3) in the root zone and, therefore, appeared to
be particularly suited to reproduce the FD dynamics of croplands.
2.2.1. Synchronicity metrics
The concept of synchronicity based on the work of Kemter et al. (2020) was employed to compare the rate of identification of
FD events and the intervals, which were correctly identified as intervals with no FD, for a weekly resolution. Synchronicity
metrics were originally developed to analyse whether extreme floods occur concurrently with the same timing in larger basins
(Kemter et al. 2020). It is based on the two synchronicity metrics sync
1
and sync
0
, which are defined as the average proportion
of the successful identification of FD events and no FD events, respectively. Here, the Osman reference method was com-
pared separately with the other methods. The metrics can take values between zero and one; therefore, a perfect
Table 1 |Comparison of key variables, statistics and threshold criteria for the detection of FDs in all six methods
Method Variables
Original dataset
type[
4
] Statistics Onset rate Total duration
M1 Osman et al.
(2021)
Soil moisture Grid
(CONUS)
Soil moisture volatility
index (SMVI)
Running averages (RA)
4 weeks Onset duration þwhile
SM lower than 4-
pentad running
average
M2 Ford & Labosier
(2017)
Soil moisture Station
(Eastern USA)
Percentiles 4 pentads Onset duration þuntil
SM.30th p.
M3 Multi-criteria Precipitation
temperature
potential
evapotranspiration
Station (Central
Europe)
Anomalies
indexes
percentiles
4 weeks Onset duration þuntil 2
consecutive weeks
with score,0.65
M4 Christian et al.
(2019a,2019b,
2020)
Actual
evapotranspiration
potential
evapotranspiration
Grid (Eastern
USA[
5
] and SW
Russia)
Standardised evaporative
stress ratio (SESR)
6 pentads Onset duration þuntil 2
consecutive weeks
with an increasing
SESR
M5 Noguera et al.
(2020)
Precipitation
potential
evapotranspiration
Station (Spain) Standard precipitation
evapotranspiration index
(SPEI)
4 weeks After onset, until
SPEI.1.28
M6 Pendergrass et al.
(2020)
Potential
evapotranspiration
GRID (CONUS) Evaporative demand
drought index (EDDI)
2 weeks Onset duration þuntil
EDDI increases
towards wet
conditions
4
The data type used in the original application/publication of the method. Grid indicates methods that were implemented with reanalysis or remote sensing data. Station indicates
methods that were originally implemented with weather station (direct measure) data.
5
The Christian et al. method studied multiple areas in the continental USA: the Great Plains, Corn Belt, and Great Lake regions, in the states of Georgia, Kansas, Iowa, and Minnesota.
1
Link to fdClasify git repository: https://github.com/pedroalencar1/fdClassify.
2
Link to Flash Drought Visualization tool (FD-Viz): https://pedroalencar.shinyapps.io/FD-Viz/.
Hydrology Research Vol 53 No 9, 1154
Downloaded from http://iwaponline.com/hr/article-pdf/53/9/1150/1113768/nh0531150.pdf
by TU BERLIN user
on 15 November 2023
Loading more pages...