1
Scientific Data | (2023) 10:147 | https://doi.org/10.1038/s41597-023-02040-2
www.nature.com/scientificdata
EUBUCCO v0.1: European building
stock characteristics in a common
and open database for 200+ million
individual buildings
Nikola Milojevic-Dupont1,2,9 ✉ , Felix Wagner
1,2,9 ✉ , Florian Nachtigall
1,2, Jiawei Hu1,2,
Geza Boi Brüser3, Marius Zumwald2,4, Filip Biljecki
5, Niko Heeren
6, Lynn H. Kaack7,
Peter-Paul Pichler
8 & Felix Creutzig
1,2
Building stock management is becoming a global societal and political issue, inter alia because of
growing sustainability concerns. Comprehensive and openly accessible building stock data can enable
impactful research exploring the most effective policy options. In Europe, efforts from citizen and
governments generated numerous relevant datasets but these are fragmented and heterogeneous,
thus hindering their usability. Here, we present eubucco v0.1, a database of individual building
footprints for ~202 million buildings across the 27 European Union countries and Switzerland. Three
main attributes – building height, construction year and type – are included for respectively 73%,
24% and 46% of the buildings. We identify, collect and harmonize 50 open government datasets and
OpenStreetMap, and perform extensive validation analyses to assess the quality, consistency and
completeness of the data in every country. eubucco v0.1 provides the basis for high-resolution urban
sustainability studies across scales – continental, comparative or local studies – using a centralized
source and is relevant for a variety of use cases, e.g., for energy system analysis or natural hazard risk
assessments.
Background & Summary
Built infrastructure fulfills the basic need for shelter and mediates access to fundamental infrastructural services for
the population1. The economic value of global real estate in 2020 was estimated to $327 trillion, nearly four times
the global gross domestic product2. Built infrastructure accounts for the majority of societies’ physical material
stock: in particular, building construction and maintenance is responsible for half of global resource consumption3.
Buildings also account for a substantial share of the global final energy consumption and greenhouse gas emis-
sions, respectively 31% and 21% in 20194. The way we build significantly affects material and energy consumption
and associated greenhouse gas emissions and other impacts4. High-resolution building stock data can support
economic and social policy at the regional level, especially to achieve the Sustainable Development Goals5,6.
The highest resolution building stock data that is typically used is geospatial vector data. At a minimum,
they contain georeferenced two-dimensional (2D) footprints of individual buildings and can reach a realistic
3D representation of walls, roof and further details. Geospatial vector building geometries are enriched with
numerical and categorical attributes that include the building height (also known as 2.5D representation),
construction year, and usage type. Other potential attributes can be information about retrofitting, roof type,
energy standards, building materials, etc. In contrast to aggregate data, such high-resolution building stock
data allow to consider buildings individually and collectively for planning policy interventions. By correlating
1Mercator Research Institute of Global Commons and Climate Change, Berlin, 10829, Germany. 2technical
University Berlin, Berlin, 10623, Germany. 3Independent researcher, Berlin, 12053, Germany. 4etH Zürich, institute
for Environmental Decisions, Zürich, 8092, Switzerland. 5National University of Singapore, Singapore, 119077,
Singapore. 6Norwegian University of Science and Technology (NTNU), Trondheim, 7491, Norway. 7Hertie School,
Data Science Lab, Berlin, 10117, Germany. 8Potsdam Institute for Climate Impact Research (PIK), Potsdam, 14473,
Germany. 9These authors contributed equally: Nikola Milojevic-Dupont, Felix Wagner. ✉e-mail: milojevic@
mcc-berlin.net; wagner@mcc-berlin.net
DaTa DESCrIPTOr
OPEN

2
Scientific Data | (2023) 10:147 | https://doi.org/10.1038/s41597-023-02040-2
www.nature.com/scientificdata
www.nature.com/scientificdata/
building attributes with one another and accounting for spatial context, these data allow for more targeted anal-
yses and maps that relate building attributes to demographic information, help design targeted policy interven-
tions, and model their impacts down to the building level.
In regional planning, high-resolution building stock data enables to investigate different important questions.
They are necessary to assess future demand for new construction, as well as possible needs for deconstruction in
areas with shrinking populations7–9. Building stock composition and dynamics can also serve as a basis for pre-
dicting material outflow either as waste or as raw material for new building construction10–13. In turn, in energy
and climate policy, spatially resolved data on the extent and condition of the building stock is essential for mod-
eling energy demand scenarios and climate change policies aimed at reducing energy-related greenhouse gas
emissions14–16. Finally, this information can be used in risk models for natural hazards or economic damage func-
tions related to climate change, where it enables an explicit representation of the exposure of a building stock.
Europe offers unique conditions to prototype a database of building stock characteristics at the continental
level, as there are several country-wide datasets (e.g., Spain, France, Netherlands) with a joint availability of
footprints and attributes. However, there is currently no single database combining all buildings and relevant
attributes digitally available in Europe. Tools developed by the European Union (EU) like CORDA17 or EU
Building Stock Observatory18 represent first attempts at creating such database, but the first focuses on the seam-
less integration of only few datasets with highest quality standards, while the second only provides country-level
aggregated statistics. There has been a trend towards more open data releases from governments in recent years,
partly orchestrated by the European Union project INSPIRE19,20. Unfortunately, these numerous datasets are
fragmented and heterogeneous, which hinders their usability. In Europe, OpenStreetMap (OSM) or Microsoft21
are the only sources for harmonized building data for all EU countries. The former is based on the contributions
of millions of mappers22–24, yet has quality issues such as varying coverage, inconsistent description, and lack of
attributes24. The latter is derived from remote sensing data and, hence, lacks spatial accuracy and climate relevant
building attributes. Therefore, there is a need to identify available data, assess their quality, and aggregate the best
existing datasets to create a complete building database for Europe. Such a centralized database can amplify the
value of individual datasets by unlocking novel research opportunities across scales16,25–27, including compara-
tive studies such as city typologies27 and unprecedented continental-level studies.
Here, we present eubucco v0.128, a database of individual buildings covering all 27 EU countries and
Switzerland, which represent 378 regions and 40,829 cities. eubucco v0.1 contains building footprints for ~202
million buildings and three main building attributes – height, construction year and type – for respectively 73%,
24% and 46% of the buildings, see Table1 for country-level values. Our input datasets include 50 heterogeneous
open government datasets and OSM, see Fig.1. Our workflow involves three steps. First, we identified candidate
datasets. Second, we retrieved data involving negotiation, web scraping, and various application programming
interfaces (API). Third, we harmonized the data to make geometries and attributes comparable. The last step also
involved introducing a consistent administrative sub-division scheme that underpins the database structure.
Finally, we performed extensive validation to monitor data coverage and quality throughout our workflow.
eubucco v0.1 gathers timely information for high-resolution analysis of the EU building stock, which is
highly relevant for policy making on the EU, national and city level, urban planning as well as academic research.
By identifying and assessing the relevance of various datasets, we enable users to easily find and access data
across the EU. By collecting, harmonizing, cleaning and redistributing all the data through a simple download
approach, we ensure a high usability. The data is available on the dedicated website eubucco.com and referenced
on Zenodo28 (concept DOI: https://doi.org/10.5281/zenodo.6524780, v0.1-specific DOI https://doi.org/10.5281/
zenodo.7225259). The code used to generate the database is provided as a Github repository29, with tags that
correspond to a specific version, e.g., v0.1 together with the documentation of all input data to enable transpar-
ent re-use, verification, update and modification. This database is therefore reproducible, i.e., the code allows to
recreate the repository with little manual intervention.
Methods
Creating eubucco v0.1 involved three main steps: 1) identifying relevant data; 2) retrieving it from individual
websites; and 3) harmonizing the various input datasets into one common format with consistent building foot-
print geometries, attributes (height, type and construction year) and administrative boundaries (country, region
and city) to create a database structure. We performed extensive data validation procedures throughout the
workflow to guarantee completeness, minimal errors and no duplicates (see Technical Validation). The different
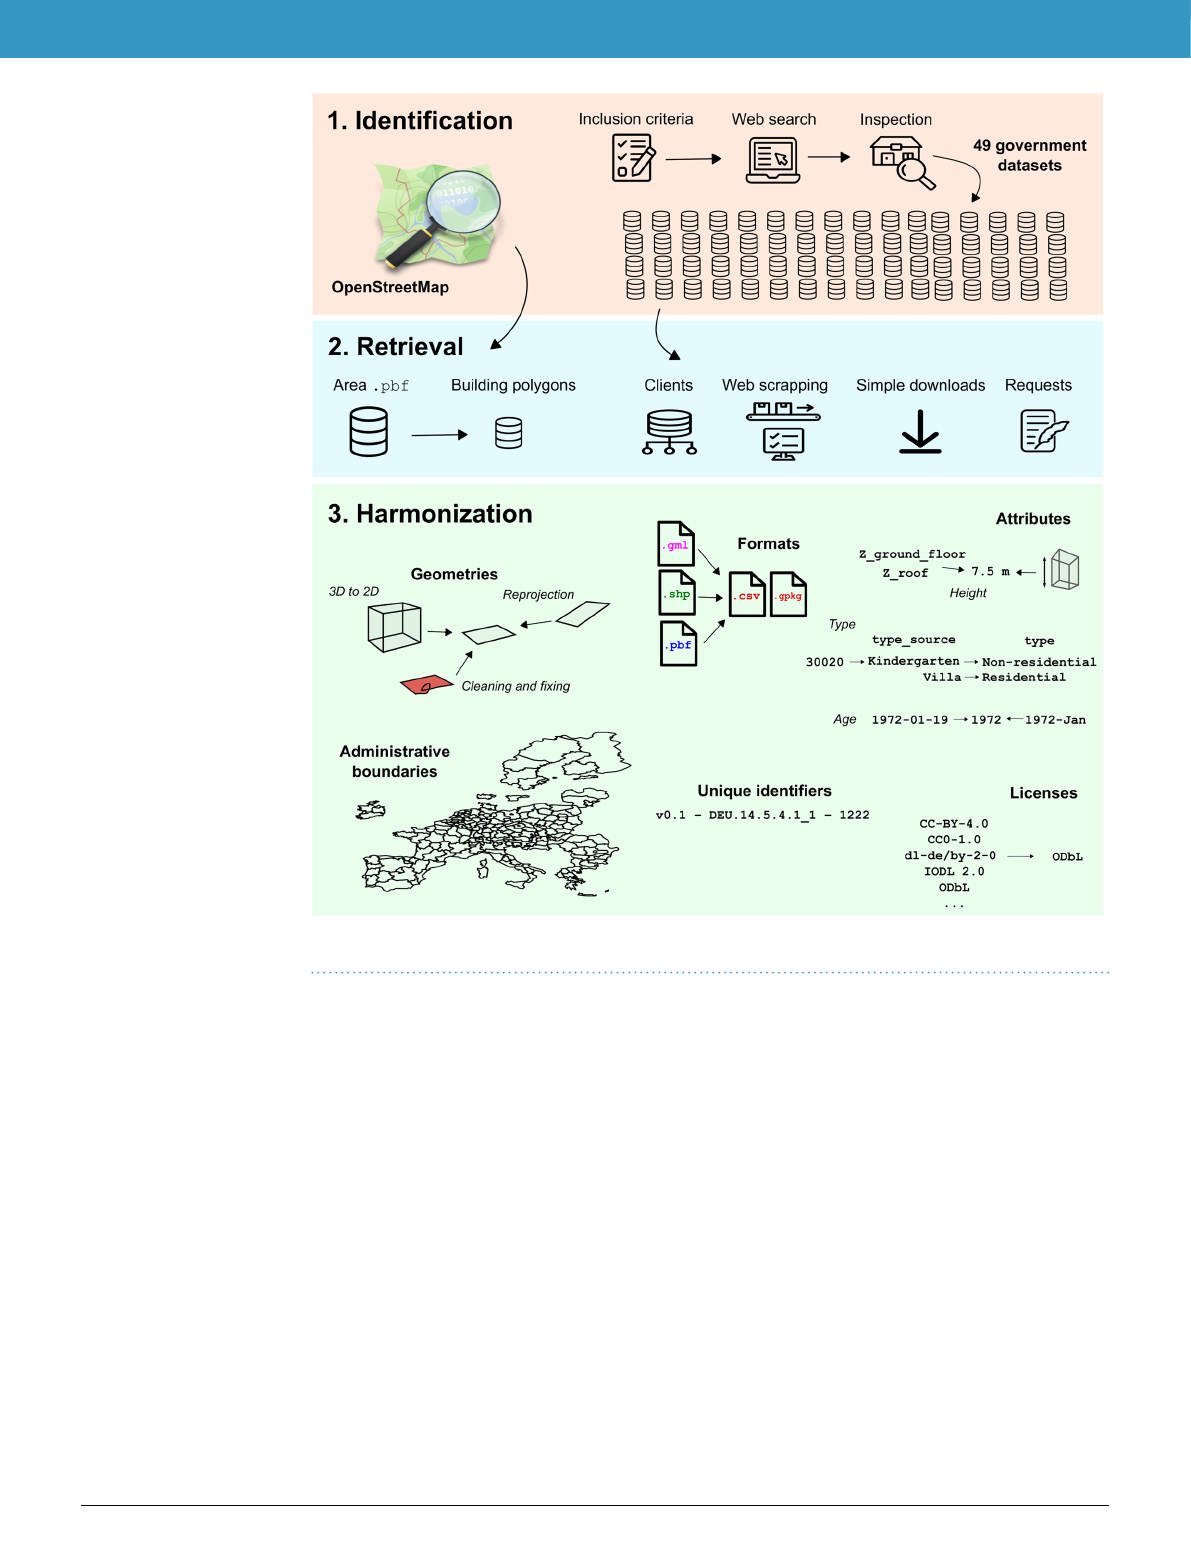
steps of the workflow are summarized on Fig.2.
Our data processing workflow29 is almost entirely written in Python in order to maximise automation and
reproducibility compared to desktop geographic information system (GIS) software. We created a Python mod-
ule eubucco with core functions for each of the processing steps. In order to facilitate updates once new data
become available, whenever possible we wrote generic functions that for most steps can be run in parallel for
each datasets via an argument parser, e.g., as a Slurm job array. We also used PostGIS and QGIS for a small num-
ber of tasks, documented on the repository, e.g., via .txt files.
Data identification. eubucco v0.1 contains 50 individual datasets, which we first had to identify and screen for
inclusion. See a detailed summary of all the input datasets used in input−dataset−metatable−v0.1.xlsx in
Data Records. Refer to the upper panel of Fig.2 for a visualization of the data identification steps within the workflow.
Inclusion criteria. The buildings in eubucco v0.1 are defined liberally as any permanent structure with a roof
and walls. As criterion for inclusion, only datasets containing geospatial vector data of the footprint – or in other
words, the ground surface – were considered. Input datasets can either be 2D (with only the footprint as geometry),

3
Scientific Data | (2023) 10:147 | https://doi.org/10.1038/s41597-023-02040-2
www.nature.com/scientificdata
www.nature.com/scientificdata/
2.5D (with footprint and height as one or several attributes, e.g., max height, height of the eaves, etc.) or 3D (with
walls and roof geometries). One-point coordinate data, for example in an address dataset, is considered as not
sufficient for inclusion and a polygon representation is required. Input datasets ideally contain attributes of inter-
est (height, construction year or type), but this was not a requirement. The dataset coverage can be at country,
region or city level. We did not set inclusion criteria related to the publication date of the dataset. In cases when
several versions of the dataset existed, we used the latest. We acknowledge that our dataset does not represent
a snapshot of the EU building stock at a given moment, but rather contains the newest data available for each
area to the best knowledge of the authors. Finally, the license under which the dataset was originally released at
least has to allow free use for scientific research, see detailed license information in input−dataset−met-
atable−v0.1.xlsx. We included datasets that did not allow for redistribution or commercial use but such
datasets were treated separately, see the Outbound licensing section for details.
Search approach. For OSM, no search was needed given that OSM is a single dataset. For government sources,
we first searched for country-level datasets. When none were found, we searched for region- and city-level data-
sets. We used the geoportal INSPIRE19, and screened entries in the spatial data theme ‘Buildings’. We queried
a standard search engine, and country-specific open data portals for ‘building dataset’ in national languages.
We also used technical keywords specific to this kind of datasets, e.g., ‘LoD1’ – the level of detail of a 3D building
dataset30. Finally, we found additional datasets by crowdsourcing on social media.
Through this approach we could identify 49 relevant datasets, but also countries and regions where gov-
ernment datasets exist but are not open or only available for a fee, often prohibitively high. In such cases,
we contacted the relevant data owner to ask whether the data could be used for academic purposes. See
excluded−datasets.xlsx for the list of relevant datasets identified that were not included with the rea-
sons for excluding them. The table includes the contact date, as the license of a given dataset may change in the
future and become open.
Country Buildings [n]Footprint area [m2]Heights [%] Ages [%] Types [%]
Germany 43,644,887 6,108,343,562 66 0 66
France 47,847,462 5,851,128,661 98 45 54
Italy 20,674,153 3,668,104,389 69 7 50
Spain 16,340,067 2,979,509,619 95 99 100
Poland 14,404,767 2,099,046,447 100 0 0
Netherlands 9,692,657 1,202,665,089 100 100 0
Belgium 8,634,500 1,096,372,592 100 0 0
Austria 4,135,733 867,271,697 7 0 16
Denmark 5,691,756 738,533,831 0 0 0
Finland 5,370,223 691,145,893 2 1 1
Czechia 4,044,659 673,376,186 8 0 92
Sweden 2,532,313 568,473,803 3 0 27
Switzerland 2,641,571 506,395,304 100 0 0
Slovakia 3,488,125 428,026,555 95 0 87
Hungary 1,546,359 337,332,876 3 0 33
Portugal 1,215,018 325,743,275 4 0 32
Romania 1,332,570 323,929,666 7 0 21
Lithuania 1,924,431 290,400,677 0 0 0
Ireland 1,610,614 243,282,004 13 0 67
Greece 864,237 187,420,816 5 0 13
Slovenia 1,162,832 182,617,285 94 0 19
Croatia 873,080 147,590,430 1 0 19
Bulgaria 448,470 145,130,155 15 0 35
Estonia 803,218 132,899,346 100 0 0
Latvia 513,316 112,759,248 6 0 17
Cyprus 467,594 74,417,048 100 0 0
Luxembourg 143,923 43,143,729 100 0 0
Malta 142,616 32,599,347 100 0 0
Total 202,191,151 30,057,659,533 73% 24% 46%
Table 1. Country-level content statistics of eubucco v0.1. Values correspond to the final counts from the
final provided as the database at the end of pipeline, and do not account for the buildings that were dropped
throughout the workflow. The values for height, construction years and types correspond to the percentage
of buildings for which the attribute is available in eubucco v0.1. Countries are ordered by descending total
building footprint area.
4
Scientific Data | (2023) 10:147 | https://doi.org/10.1038/s41597-023-02040-2
www.nature.com/scientificdata
www.nature.com/scientificdata/
Selecting between relevant datasets. Whenever possible, we favored government data over OSM as basis for the
footprints. The rational for this choice is that, when available, government data tends to have a better coverage
both in terms of footprints and attributes than OSM, even if the opposite can happen31,32. A future version of this
database should include a detailed comparison of OSM and government data. When no data for a country or
regions of a country was available, OSM was the fallback for building footprints in eubucco v0.1. In some cases,
several candidate datasets representing the same area were found on a regional open data portal with a descrip-
tion and metadata that was not conclusive; then, we analyzed data samples of each candidate to determine which
one to include. If an area is available in an individual dataset but also part of a larger dataset, different inclusion
decisions were made. If the smaller dataset did not contain additional attributes of interest (height, construction
year or type) compared to the larger one, then the larger dataset is being used. If the smaller dataset contains
any attributes but the larger area does not, then the smaller dataset is used for this area. For Prague and Brno in
Czechia, we had to make an arbitrary decision between the country-level data that contained type information
and the city-level datasets that contained heights – here we opted for height.
Data retrieval. Once identified, retrieving the data involved the download of the relevant files via various
interfaces on government portals, as well as downloading OSM data from the Geofabrik server. We retrieved in
total 190,387 individual files for the 50 datasets. Refer to the middle panel of Fig.2 for a visualization of the data
retrieval steps within the workflow.
Government data. A large heterogeneity exists in term of download services for government data-
sets: selection tools on interactive maps, few to many links on simpler or more complex web pages,
and APIs. This required domain knowledge of each specific approach and sometimes required to build
dataset-specific web scraping routines. The download approach for each dataset is documented in
input−dataset−metatable−v0.1.xlsx.
Datasets are provided either as one file, multiple files corresponding to smaller administrative areas or tiles,
and sometimes several levels of aggregation are available. If the data could be downloaded from a govern-
ment portal via few single links or queried generating download links via email, the download was conducted
manually.
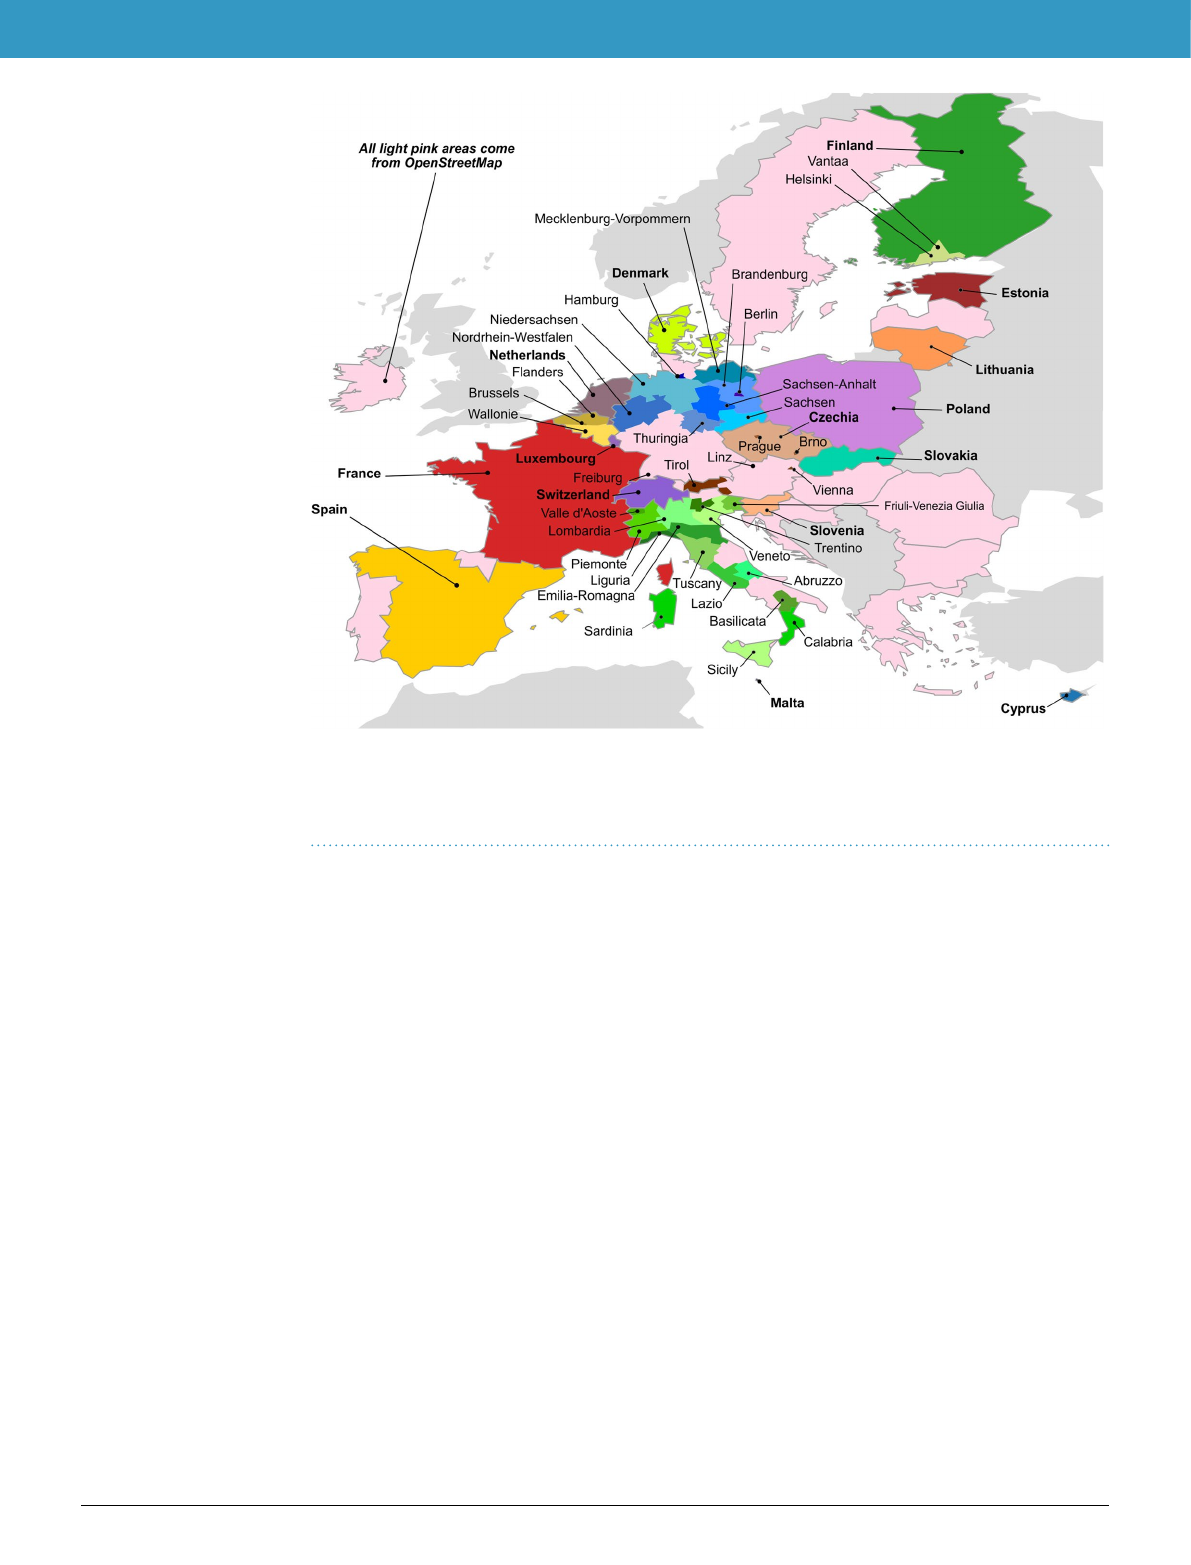
Fig. 1 The 50 input datasets parsed to generate eubucco v0.1. Bold font indicates country-level datasets, while
normal font indicates region- or city-level datasets. Datasets for a same country are designated with different
tones of the same color. All areas where OpenStreetMap was used as basis for the building footprints are colored
in light pink.
5
Scientific Data | (2023) 10:147 | https://doi.org/10.1038/s41597-023-02040-2
www.nature.com/scientificdata
www.nature.com/scientificdata/
In cases where a high number of links were present or a complex and time consuming download procedure
was required, we used Python web scraping tools to automatically download the data, see database/pre-
processing/0−downloading29. We developed specific download workflows for 10 different websites,
building up on the web scraping packages Selenium33.
In a few cases, we downloaded the data via APIs or transfer protocols, including WFS, OGC API, and FTP.
When datasets where available as ATOM feeds, we used web scrappers instead of browser-based clients. In three
cases, the datasets were only available via a selection tool on an interactive map with low limits per query, mak-
ing the manual download of the whole area virtually impossible. In such cases, we contacted the data owner to
ask for a data dump, which they did provide in the cases of Emilia-Romagna and Piemonte, while Niedersachsen
provided a URL to a list of download links.
OpenStreetMap. OSM data was downloaded as .pbf files from the Geofabrik download server34 using the
Python library Pyrosm35, either at the country level or region level for large countries such as Germany and Italy
where regional downloads are possible. The retrieval of buildings from OSM .pbf files was done via filtering
per tags (which is similar to an attribute column).
There were two main challenges while filtering: 1) in a .pbf, buildings are not separated from other pol-
ygons (e.g., land use) as specific datasets, 2) tag values that can be used for filtering are noisy and incomplete,
as OSM mappers are free to use any value of their choice including none. We followed the most common
approach, which is to request any non-null value in the building tag/column using a wildcard: build-
ing = *. Most values in this column are either yes or indicate the type of the building, e.g., house or commercial.
A small share of buildings may not have a value in this column and are lost, but adding any other tag, e.g.,
building: use = * OR amenity = * without requiring a value for the building tag, led to the inclusion
of non-building polygons, e.g., district boundary or land use polygons. These would then need to be excluded,
Fig. 2 Overview of the processing workflow of eubucco v0.1.
Loading more pages...