
3rd PLATE Conference
September 18 – 20, 2019
Berlin, Germany
Nils F. Nissen
Melanie Jaeger-Erben (eds.)
Universitätsverlag der TU Berlin
Strandbakken , Pål: Has the durability of white goods changed between
1998 and 2017? In what direction and why? In: Nissen, Nils F.; Jaeger-Er-
ben, Melanie (Eds.): PLATE – Product Lifetimes And The Environment : Pro-
ceedings, 3rd PLATE CONFERENCE, BERLIN, GERMANY, 18 – 20 Septem-
ber 2019. Berlin: Universitätsverlag der TU Berlin, 2021. pp. 729 – 735. ISBN
978-3-7983-3125-9 (online). https://doi.org/10.14279/depositonce-9253.
This article – except for quotes, fi gures and where otherwise noted – is
licensed under a CC BY 4.0 License (Creative Commons Attribution 4.0).
https://creativecommons.org/licenses/by/4.0/.

729
3rd PLATE 2019 Conference
Berlin, Germany, 18-20 September 2019
Has the Durability of White Goods Changed Between 1998 and
2017? – In What Direction and Why?1
Strandbakken, Pål
Consumption Research Norway, Oslo, Norway
Keywords: Refrigerators; Freezers; Obsolescence; Replacements; Durability; Product Lifetimes;
Product Design; Premature Obsolescence; Product Lifetime Optimisation.
Abstract: The author performed a nationwide representative survey of the durability of freezers,
refrigerators, TV sets and stereos in Norway in 1998, as part of his doctoral thesis. In 2017, the
Norwegian Consumer Council financed a replication of the survey for the cold appliances, enabling us
to conclude on the question of whether product durability goes up or down. We also consider survey
material on the age of households’ washing machines, dishwashers and tumble driers, why these
products are replaced, repair practices etc., but the comparison between 98 and 17 is restricted to
refrigerators and freezers.
Between 1998 and 2017 the number of years a household uses the refrigerator; what we here define as
the lifespan of the product, has decreased by one and a half year on average. Likewise, in the same
period, the lifespan of freezers has also decreased by a bit more than one and a half year. It seems as if
the reason for this decrease is that households today, more often than 20 years ago, replace cold
appliances that are not malfunctioning. If this is correct, the importance of technical quality/mechanical
durability is reduced, while psychological obsolescence and ‘new consumer needs’ has gained
importance. However, qualitative (technical) obsolescence remains the main reason for replacement of
cold appliances, even if we observe an unwanted change. For washing machines, where we do not
have comparable data over time, it seems as if technical quality/durability is more important than for
cold appliances. The same tendency, but somewhat weaker, is observed for dishwashers. Generally,
the consumption of washing machines, dishwashers and tumble dryers is different from the
consumption of refrigerators and freezers, as these products more often get repaired. This probably
indicates that washing machines etc. to a larger degree are seen as functional objects and less as
aesthetical objects.
Introduction
The potential contribution from increased life
span of products to more sustainable life styles
is about to be more broadly recognized
(Cooper ed. 2010). Increased product
durability is a kind of “three-for-the-price-of-
one” solution; reducing energy consumption,
reducing pollution and materials use. In
addition, it might even be a socially acceptable
take on the challenge of reduced consumption
in the richer parts of the world. 1
This presentation explores two research
questions:
1 The presentation builds on a Norwegian language only
report from 2018 by Pål Strandbakken and Randi Lavik; Har
hvitevarenes levetid endret seg fra 1998 til 2017?,
Oppdragsrapport nr. 2 – 2018, SIFO Consumption
Research Norway; Oslo Metropolitan University. The report
was commissioned by the Norwegian Consumer Council.
1. For how long do consumers keep
(use) their products? (specified for
different products, but the focus here
is on cold appliances)
2. Do these products in 2017 last for a
longer or for a shorter period than they
did in 1998?
Both questions are tricky to answer precisely,
but I try to address them by posing identical
survey questions at two different points in time,
in order to measure any changes in our
operational definition of product life spans. In

730
3rd PLATE Conference Berlin, Germany, 18-20 September 2019
Strandbakken P.
Has the durability of white goods changed between 1998 and 2017?
addition, I want to find out why consumers
replace their products, and if their reasons for
replacement have changed during the 20 year
period.
This research field comes with a lot of different
conceptualizations and definitions. I use
product life span as the number of years a
household has had its number one product;
how many years since acquisition? The
concept “number one product” is constructed
in order to deal with the fact that many
households have more than one refrigerator or
freezer. We are interested in the newest,
which presumably will be placed most visible,
in the kitchen.
One might reasonably argue that from an
environmental perspective it would be more
interesting to study use time than life span (as
we defined it above), because this would give
us more information about durability. On the
other hand will life span come with an
interesting relation to use time because it
indicates something about the availability of
second hand products. Further, and more
interesting, our object of study is real social life
spans and not potential technically defined use
time. It is a problem, however, that most
consumers will regard the questions about
increase or decrease in life spans as questions
of technical quality/durability.
To the extent that we succeed in measuring
life spans, and potential changes in them, we
should try to explain the reasons for change.
Then we have to consider much more than just
technical quality. Theoretically, we might have
a situation where the technical quality is
constant, but that (Norwegian) consumers
have become more affluent and replace (buy)
products more often than they used to, even if
it has nothing to do with technical quality. We
could, however also imagine that a more
affluent population buys more expensive,
hence presumably more durable products.
The measuring of product life spans in the
population is based on a picture taken at a
specific time at something that is a result of
what has happened in the previous ten to
twenty years, “historical” consumer decisions
taken in markets with different brands with
varying product quality, decisions taken by
individuals and households in different
economic situations.
Project design and methods
In a certain sense, we enter the material
backwards, when we claim that the key to
understanding product life spans is to
understand why consumers chose to replace
their previous product. For a product that is
new on the market, that question is
meaningless. I have never before owned a
tumble dryer - it is my first - so I am not able to
answer questions of replacement. For other
products, like refrigerators, freezers and
washing machines we might by and large
suppose that households have changed
products, excepting young people in new
households. The different reasons for
obsolescence is key to understanding how we
could influence product life spans in the future;
qualitative (wear and tear, technical
breakdowns), functional, aesthetic, changed
consumer needs or “Diderot” obsolescence.
This paper is based on two nationwide
(Norwegian) surveys. As part of the author’s
PhD (Strandbakken 2007), a consumer survey
was conducted in 1998 that studied product
durability/life spans (product’s age) and
reasons for product replacements for
refrigerators, freezers, TV-sets and stereos. In
Early 2017, the Norwegian Consumer Council
asked the author/SIFO to replicate the original
survey, in order to determine if product life had
increased or decreased in the 20-year period
after 1998, the initiative was partly a reaction to
some rather negative European reports. We
decided that due to technological change,
stereos clearly were irrelevant, and TV-sets
quite irrelevant. Hence, the specific question in
the title is about white goods. Sadly, I did not
include washing machines in the original study.
In the 2017 study we repeated the original sets
of questions from 1998 for the cold appliances.
In addition, we included similar questions (and
some new ones) for washing machines and
dishwashers, plus some material on tumble
dryers.
We have not considered if the difference
between a telephone survey (1998) and a web
survey (2017) might reduce comparability.
Life span
Our estimate for the product’s life span is
based on the question “How many years ago
(approximately) is it since the household
acquired the refrigerator/freezer that is in use
today? If more than one, answers should
731
3rd PLATE Conference Berlin, Germany, 18-20 September 2019
Strandbakken P.
Has the durability of white goods changed between 1998 and 2017?
consider the newest”. Responses to this
question give us the average age of a number
of products in Norwegian households. With a
degree of humility and some reservations. The
number is not the same as the product’s
technical durability, which is longer. It is a
number that estimates for how many years a
household has had its number one product. A
study of “use time” or technical durability would
require a different research design.
Here, we aim at studying the product’s social
life span. This means that if the owner is
redecorating his kitchen and simply “has to”
replace his avocado green cold appliances after
four years, we register the life span as four
years. This brings up a number of questions
about environmental benefits (and perhaps the
opposite) of second hand markets etc., but I will
not go into them here. The basic idea is that
with all its possible inaccuracies we will, by
posing this question at two different points in
time, be able to give a tentative answer to the
question of whether product life spans go up or
down. We also analyse any changes in the
reasons given for product replacements. How
often are replacements resulting from
malfunctioning or breakdown of the old product,
and is this share increasing or decreasing?
Product obsolescence/replacement
From the environmental perspective, two
questions about product life spans are
interesting: why was the old product replaced,
and what happened to it. We have to
understand the consumers’ reasons for
scrapping the old product if we want to influence
product life. In Strandbakken 2007 (p. 171) we
offer a typology of reasons for regarding
products as obsolete, developing/expanding
Packard’s (1960) scheme.
Obsolescence of function
Obsolescence of quality
- Aesthetic dimension
- Technical: product malfunctioning/
breakdown/damaged product
Obsolescence of desirability
- Fashion change
- Change of personal style
- Diderot effects
- Hedonism
Obsolescence due to new consumer needs
Packard’s scheme contained function, quality
and desirability (the last often renamed
“psychological” obsolescence). The typology is
basically self-explaining. Functional
obsolescence might be exemplified by the
transition from vinyl to CDs in the early nineties.
Highly relevant for smartphones etc., perhaps
less so for cold appliances and washing
machines. Quality is the dimension most often
referred to when durability is debated. Are
today’s products better or worse than
yesterday’s? Are they repairable? Questions of
planned obsolescence might be raised, but we
will not deal with that theme here. Desirability
deals with the consumers’ mental relation to
their products, as fashion or personal style. In
addition we have the so called “Diderot effect”,
based on the observation that consumers tend
to search for consistency in the product
portfolio (McCracken 1988). Hedonism refers to
the well known “feel good effect” of buying new
things. New consumer needs refers to real or
objective changes in the consumer’s life that
necessitates change. Quite simplistic, like when
you need plus size clothing if you have gained
weight, more flexible furniture if you have to
move to a two room apartment after a divorce
or when you need a larger freezer because you
have taken up moose hunting.
Our questionnaire was designed to cover all of
these product replacement justifications.
Refrigerators and freezers
1998–2017
Ownership share and average age
Refrigerators, and to a lesser extent freezers,
are part of what we might call the Norwegian
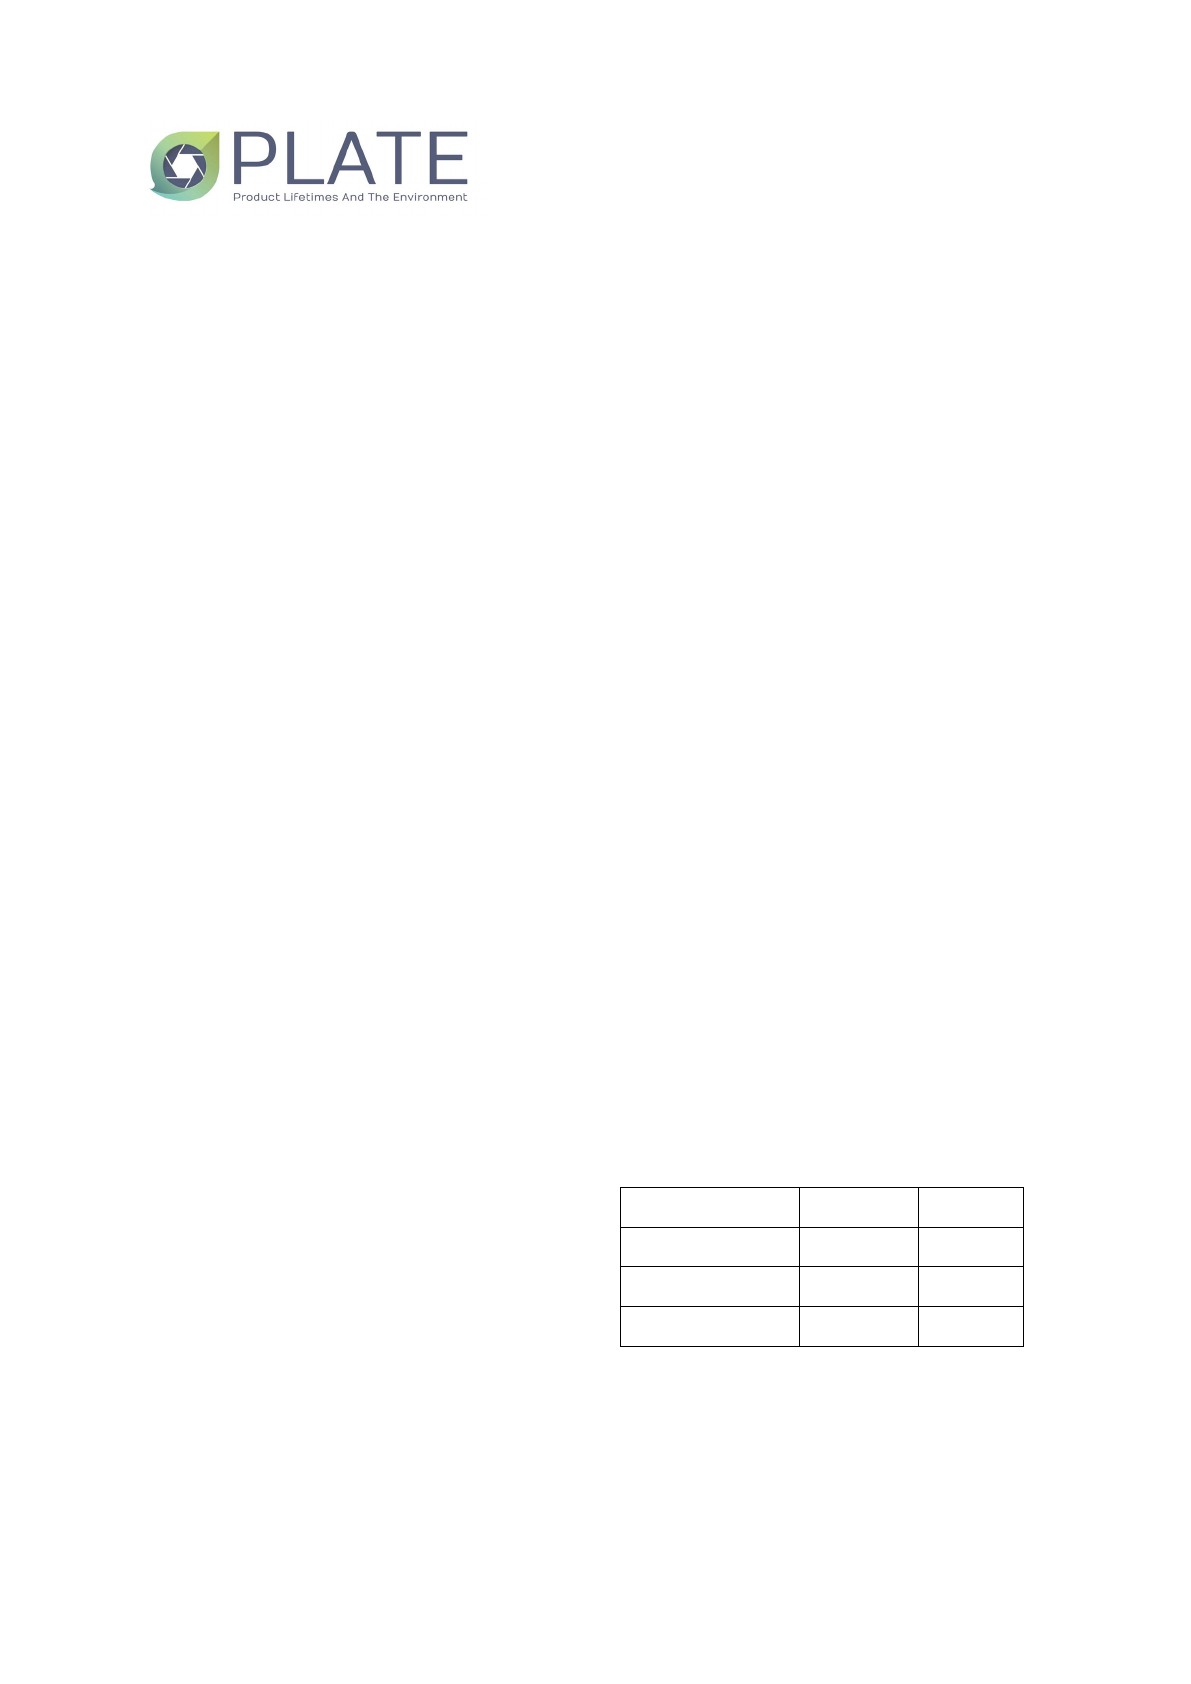
households’ standard package (table 1).
1998 2017
Refrigerator 98.3 99.4
Freezer 91.3 91.3
N 893 1000
Table 1. Percentage owning cold appliances.
I started out, assuming that due to an
unprecedented period of economic growth in
Norway from 1995 to the present, a gradually
more affluent population would have bought
better and more expensive white goods (here
cold appliances), and that this would have
732
3rd PLATE Conference Berlin, Germany, 18-20 September 2019
Strandbakken P.
Has the durability of white goods changed between 1998 and 2017?
resulted in an increasing life span of the
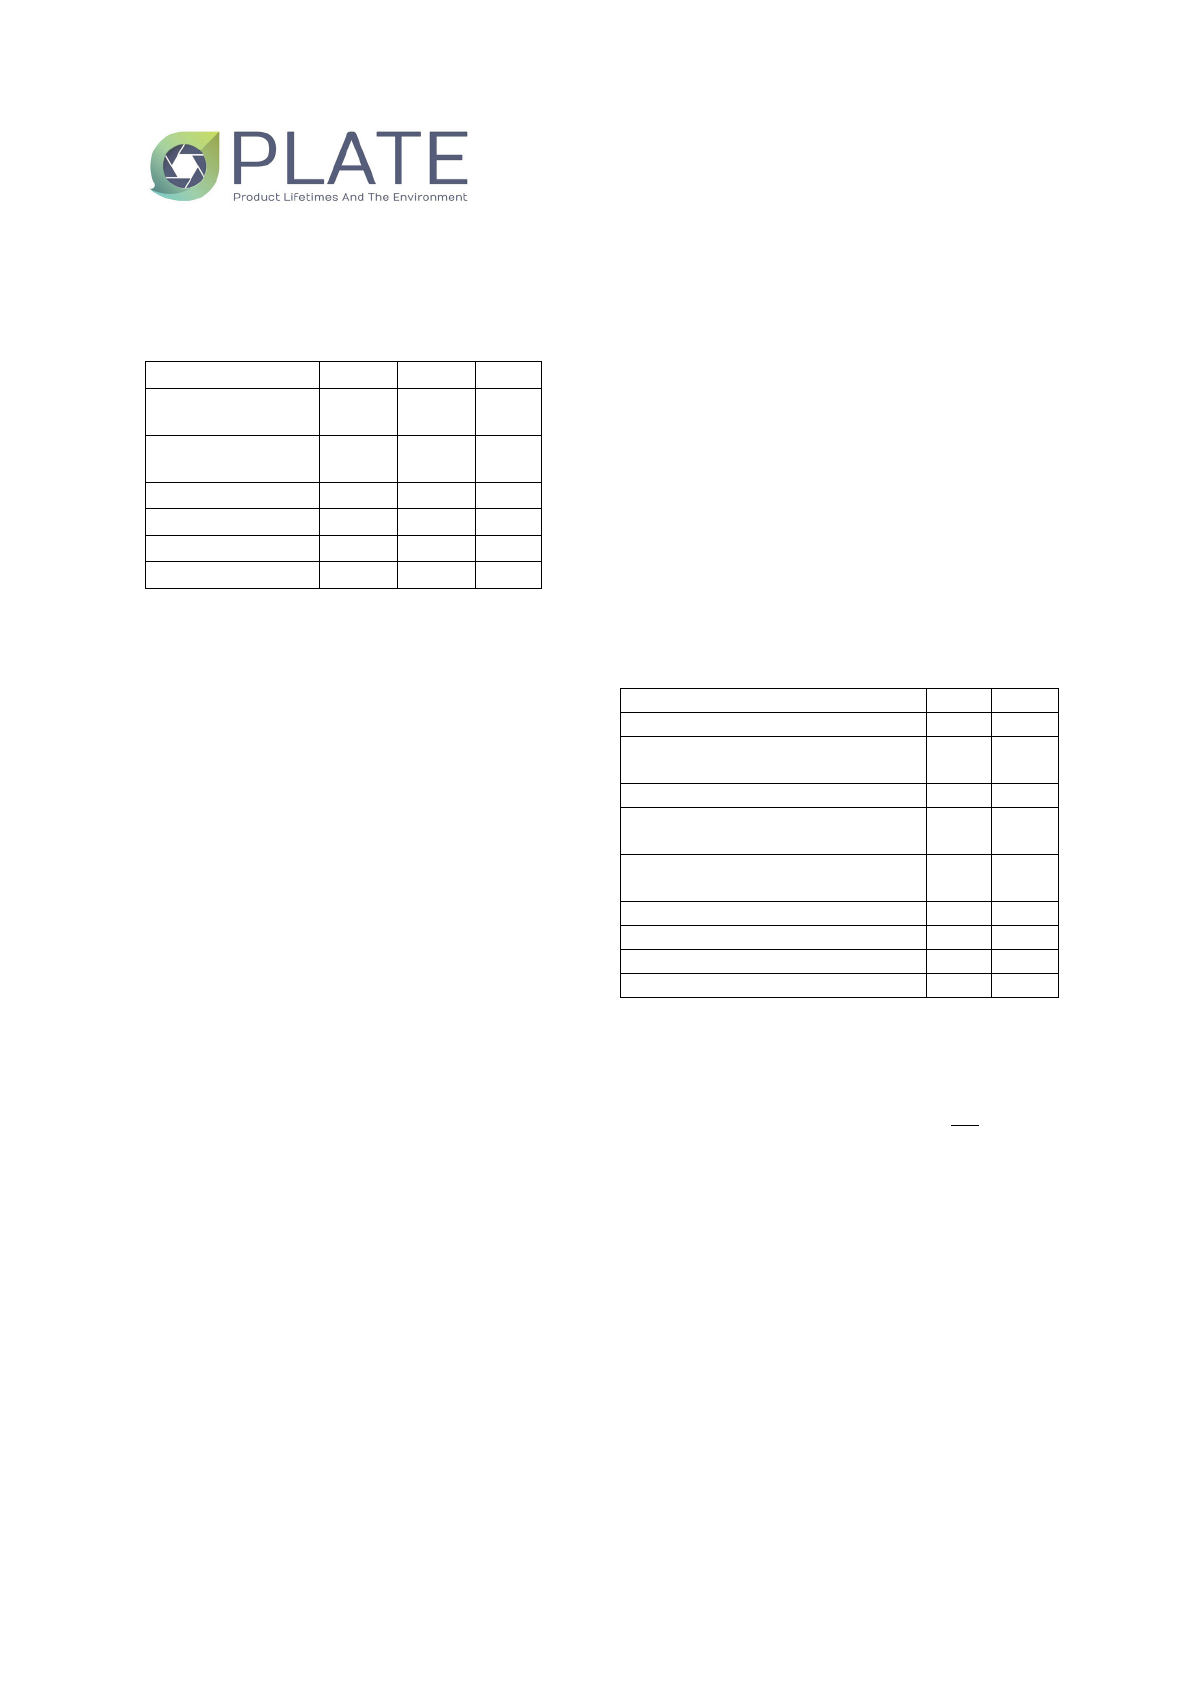
products. I was wrong. Table 2 shows that for
both product types the product live had
decreased by approximately one and a half
year.
1998 2017 Sig.
Refrigerator,
average
7.7 6.3 ***
Refrigerator,
median
6 5
N 893 932
Freezer, average 9.4 7.7 ***
Freezer, median 8 5
N
Table 2. Age of products.
The numbers 6.3 and 7.7 should be compared
to an upmarket stakeholder estimate that their
white goods are used on average for 13 years
(Strandbakken & Bøyum 2017, p. 38).
The most dramatic change between 98 and 17
is that the share that reports to have had their
product in ten years or more has fallen with
between 13 % and 16 % in all age groups
older than 29 (30-44, 45-59, 60-80). The
youngest group has not changed much, which
is natural as their experience with product
replacements is rather limited (Strandbakken &
Lavik 2018, p. 22).
Age differences between refrigerators and
freezers (in both 1998 and in 2017 freezers
were older than refrigerators) will probably be
explained by a combination of technical and
social/cultural matters. Technically, because a
top opened chest freezer is simpler than a front
opened ‘cupboard refrigerator’,
technically/socially because the freezer will be
opened less often than the fridge. Socially and
culturally because what we will call social
visibility. Today, the kitchen has increasingly
become a public room, a room where you might
entertain guests. Traditionally, refrigerators
have been placed in kitchens, while (chest)
freezers often have been placed in garages or
in basements. This means that refrigerators
have been more exposed to aesthetical aging
or psychological obsolescence (obsolescence
of desirability) than freezer. This is the
difference between front stage and back stage.
A freezer hidden away back stage could
mentally be reduced to “pure function”. The
consumer will tend to not replace it until it
breaks down, malfunctions, uses ridiculous
amounts of electricity or has an un-convenient
size. When we observe a gradual change into
kitchen placed ‘cupboard freezers’ we expect
that the difference between the products will be
reduced (which it does).
Replacement and reasons for it
What do consumers do with their old
products? From an environmental perspective,
this is an important question. In Strandbakken
2009, we observed that electricity use in some
households increased significantly when the
household bought an energy efficient
refrigerator or freezer. This because some of
the “replaced” products were moved into the
basement, to stock beer, soft drinks, frozen
pizzas etc. The energy use of the efficient
appliance then came in addition to the old
product, not instead of it.
1998 2017
It was sold 6 9
Given to second hand markets,
salvation army etc.
2 5
Given to family or friends 8 10
It is placed in the cabin or in the
basement
6 8
It was thrown or delivered to
retailer, municipal dump etc.
73 64
Other 3 3
Don’t know 2 2
Total 100 100
N 586 612
Table 3. What happened to the old refrigerator.
Among those who had replaced a product.
Percent.
In 1998, those who answered that the old
refrigerator was damaged were not asked
what they did to the old one. We assumed,
however, that respondents answering this had
thrown it (387 persons), because the filter was
‘the old one was damaged/did not work
anymore’. In addition, 12 persons who had
replaced had not answered what they did with
the old one. These we grouped together with
the ‘don’t knows’. This we might, with some
caution, compare the results from the two
years. The same procedure was used for
freezers.
In 1998, 73 % had thrown the old refrigerator,
compared to 64 % in 2017 (table 3, the
difference is significant for p< .05; kji square
test). Most consumers throw their refrigerator
because it is not working (obsolescence of
Loading more pages...