
ORIGINAL RESEARCH
published: 14 December 2020
doi: 10.3389/fmicb.2020.543260
Frontiers in Microbiology | www.frontiersin.org 1December 2020 | Volume 11 | Article 543260
Edited by:
Cassandre Sara Lazar,
Université du Québec à
Montréal, Canada
Reviewed by:
William D. Orsi,
Ludwig Maximilian University of
Munich, Germany
Andreas Teske,
University of North Carolina at Chapel
Hill, United States
*Correspondence:
Kai Mangelsdorf
†These authors share first authorship
Specialty section:
This article was submitted to
Extreme Microbiology,
a section of the journal
Frontiers in Microbiology
Received: 16 March 2020
Accepted: 20 November 2020
Published: 14 December 2020
Citation:
Liu Q, Adler K, Lipus D, Kämpf H,
Bussert R, Plessen B, Schulz H-M,
Krauze P, Horn F, Wagner D,
Mangelsdorf K and Alawi M (2020)
Microbial Signatures in Deep
CO2-Saturated Miocene Sediments of
the Active Hartoušov Mofette System
(NW Czech Republic).
Front. Microbiol. 11:543260.
doi: 10.3389/fmicb.2020.543260
Microbial Signatures in Deep
CO2-Saturated Miocene Sediments
of the Active Hartoušov Mofette
System (NW Czech Republic)
Qi Liu1,2†, Karsten Adler2,3†, Daniel Lipus1, Horst Kämpf3, Robert Bussert4, Birgit Plessen5,
Hans-Martin Schulz3, Patryk Krauze1,2, Fabian Horn 1, Dirk Wagner1,2, Kai Mangelsdorf3*
and Mashal Alawi1
1Section Geomicrobiology, GFZ German Research Centre for Geosciences, Potsdam, Germany, 2Institute of Geosciences,
University of Potsdam, Potsdam, Germany, 3Section Organic Geochemistry, GFZ German Research Centre for Geosciences,
Potsdam, Germany, 4Section Applied Geochemistry, Institute of Applied Geosciences, Technische Universität Berlin, Berlin,
Germany, 5Section Climate Dynamics and Landscape Evolution, GFZ German Research Centre for Geosciences, Potsdam,
Germany
The Hartoušov mofette system is a natural CO2degassing site in the central Cheb
Basin (Eger Rift, Central Europe). In early 2016 a 108 m deep core was obtained from
this system to investigate the impact of ascending mantle-derived CO2on indigenous
deep microbial communities and their surrounding life habitat. During drilling, a CO2blow
out occurred at a depth of 78.5 meter below surface (mbs) suggesting a CO2reservoir
associated with a deep low-permeable CO2-saturated saline aquifer at the transition
from Early Miocene terrestrial to lacustrine sediments. Past microbial communities were
investigated by hopanoids and glycerol dialkyl glycerol tetraethers (GDGTs) reflecting
the environmental conditions during the time of deposition rather than showing a signal
of the current deep biosphere. The composition and distribution of the deep microbial
community potentially stimulated by the upward migration of CO2starting during Mid
Pleistocene time was investigated by intact polar lipids (IPLs), quantitative polymerase
chain reaction (qPCR), and deoxyribonucleic acid (DNA) analysis. The deep biosphere
is characterized by microorganisms that are linked to the distribution and migration of
the ascending CO2-saturated groundwater and the availability of organic matter instead
of being linked to single lithological units of the investigated rock profile. Our findings
revealed high relative abundances of common soil and water bacteria, in particular
the facultative, anaerobic and potential iron-oxidizing Acidovorax and other members
of the family Comamonadaceae across the whole recovered core. The results also
highlighted the frequent detection of the putative sulfate-oxidizing and CO2-fixating
genus Sulfuricurvum at certain depths. A set of new IPLs are suggested to be indicative
for microorganisms associated to CO2accumulation in the mofette system.
Keywords: geo-bio interaction, CO2, mofette systems, Eger Rift, microbial lipid biomarker, microbial diversity,
deep biosphere, saline groundwater
Liu et al. Microbial Signatures of Deep Mofette-System
INTRODUCTION
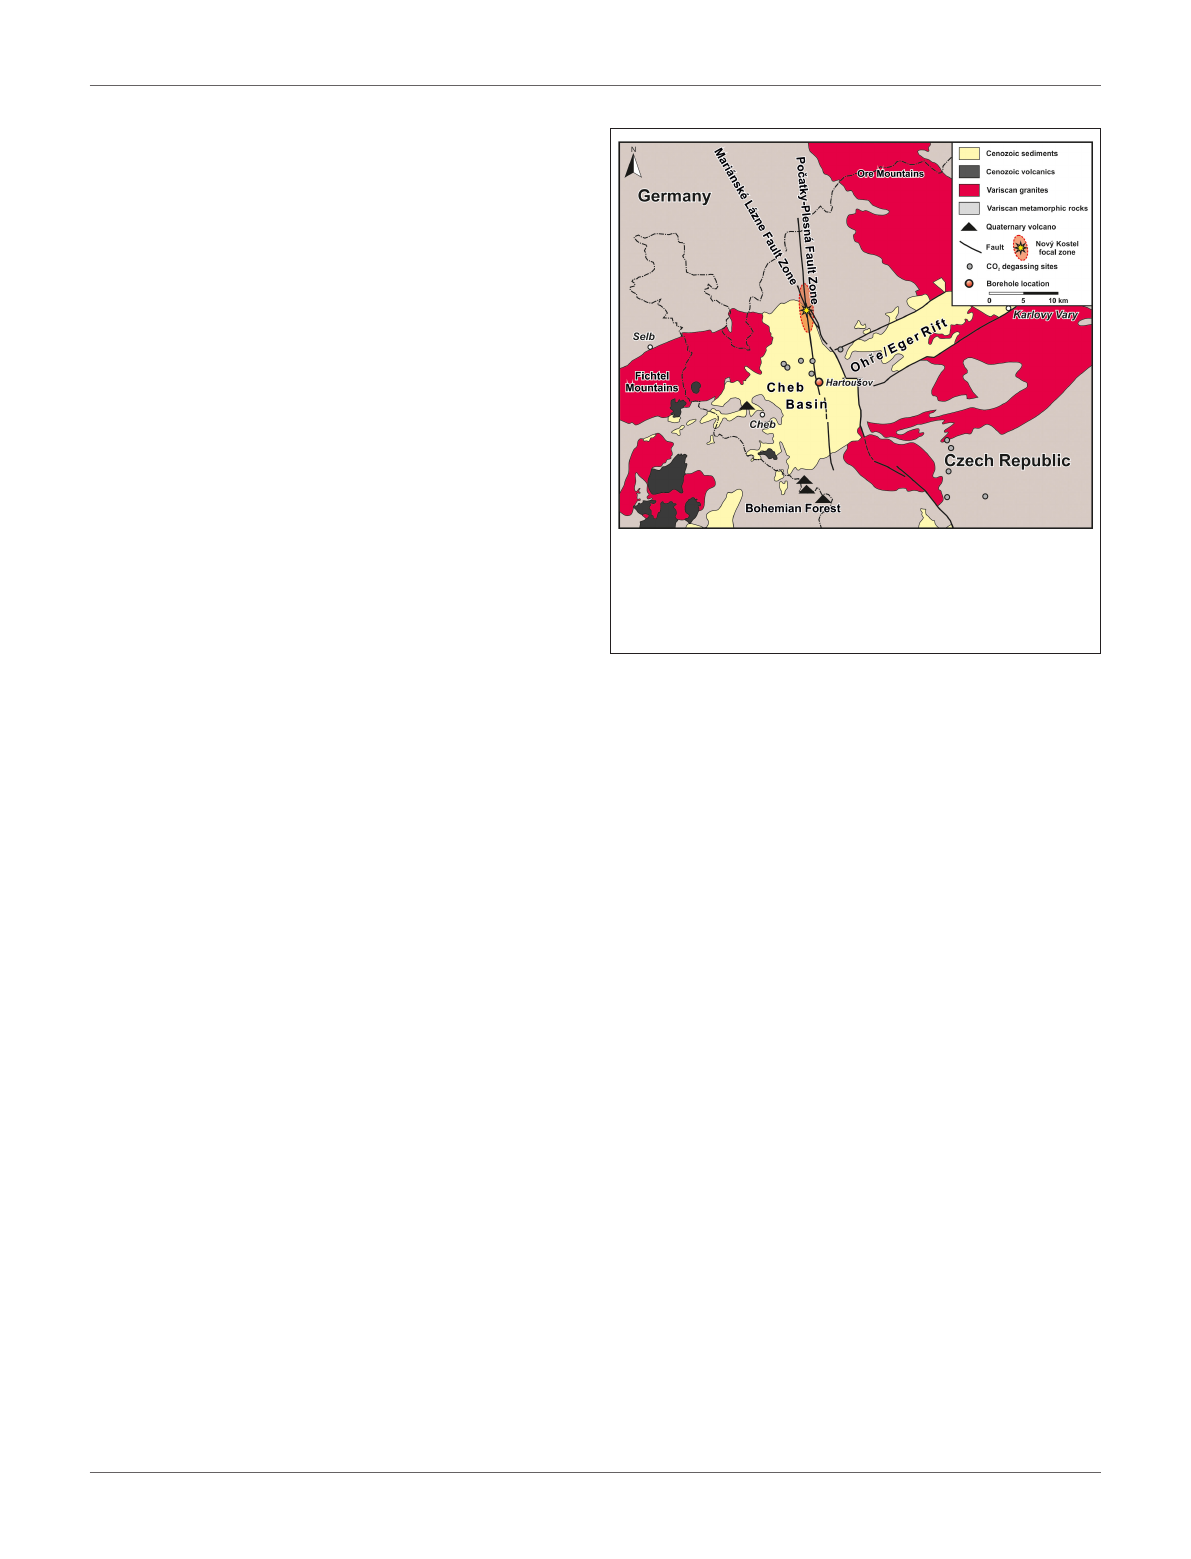
The Hartoušov mofette system is located in the center of the
Cheb Basin (Eger Rift) at the central part of the Poˇ
catky-
Plesná Fault Zone (PPZ) (Bankwitz et al., 2003a,b;Flechsig
et al., 2008, 2010; Nickschick et al., 2019;Figure 1). The region
is known for periodically occurring earthquake swarms and
widely distributed natural cold gas exhalation systems in form of
mofette sites and mineral water springs releasing CO2-rich gas
into the atmosphere (Fischer et al., 2014). The CO2originates
from active magma chambers at the crust-mantle boundary and
from lithospheric mantle depths of about 65 km (Heuer et al.,
2006; Bräuer et al., 2009). The CO2preferentially migrates to
the surface as component of supercritical fluids in the lower
crust or either dissolved in water or as a free gas phase along
deep-seated faults in the upper crust (Weinlich et al., 1999;
Weise et al., 2001; Bräuer et al., 2011; Kämpf et al., 2019).
The PPZ started to develop at the boundary from Mid to Late
Pleistocene (Bankwitz et al., 2003a,b). CO2-rich nephelinitic
magma (Seifert and Kämpf, 1994; Geissler et al., 2007; Brandl
et al., 2015) erupted in the Mid Pleistocene (Mrlina et al., 2007;
Rohrmüller et al., 2018; Krmíˇ
cek et al., 2020; Lied et al., 2020).
Age determinations of the hydrothermal activity of Karlovy Vary
spa with travertine deposits go back to 0.23 Ma (Vylita et al.,
2007). The age of the Hartoušov mofette system is unknown so
far, but in this study assigned to the onset of PPZ development
and the occurrence of volcanism. Previous investigations from
sediments of the upper 9 m at the Hartoušov mofette system
revealed that ascending CO2-containing fluids cause sediment
fluidization, hydrofracturing, and geochemical alterations e.g.,
sediment bleaching, mobilization of metals and the preservation
of organic matter (Flechsig et al., 2008; Rennert et al., 2011;
Mehlhorn et al., 2016, 2018; Rennert and Pfanz, 2016; Bussert
et al., 2017; Liu et al., 2018). At the surface, CO2exhalation
occurs in form of diffuse degassing structures (DDS, namely
dry mofettes) and localized water filled, pool-like structures
(wet mofettes) (Flechsig et al., 2008; Kämpf et al., 2013, 2019;
Nickschick et al., 2015, 2017).
Dry mofette areas display high CO2soil gas concentrations,
low soil pH, accelerated silicate weathering, leaching of base
cations, anomalous vegetation patterns, low taxonomic, and
functional biodiversity of soil biota and a limited microbial
degradation of soil organic matter (SOM) (Rennert et al., 2011;
Hohberg et al., 2015; Beulig et al., 2016; Rennert and Pfanz,
2016; Kämpf et al., 2019). In comparison to reference sites, the
microbial community differs in composition and is dominated
by anaerobic chemolithoautotrophic microorganisms, e.g.,
acidophilic, methanogenic, and sulfur-cycling organisms
(Beulig et al., 2015, 2016; Liu et al., 2018). Additionally, a
higher microbial abundance was observed even in deeper
parts of the sedimentological profile (Liu et al., 2018) and
estimates for microbial fixation of ascending geogenic
CO2reach up to 27% of the total SOM (Nowak et al.,
2015). Similar characteristics were also found at other
mofette sites, e.g., the Laacher See in Germany (Krüger
et al., 2009; Frerichs et al., 2013), the Latera caldera in Italy
FIGURE 1 | Map of the study site in NW Czech Republic showing the position
of the Hartoušov mofette system in the center of the Cheb Basin that evolved
at the intersection of the Eger Rift and Regensburg-Leipzig-Rostock Fault
Zone, here represented by the Mariánské Lázn ˇ
e and the Po ˇ
catky-Plesná Fault
Zones (modified after Liu et al., 2018).
(Oppermann et al., 2010), and the Stavešinci mofette in Slovenia
(Šibanc et al., 2014).
Hydrogeochemical investigations of waters from wet mofettes
and mineral springs in the Cheb Basin by Krauze et al. (2017)
and in the adjacent areas (Wagner et al., 2007; Schuessler et al.,
2016) unraveled different water sources, with surface water
at some locations being co-sourced by a deep saline aquifer.
The microbial communities in all of these CO2-influenced
waters were generally dominated by chemolithoautotrophic
microorganisms (iron- and sulfur-cycling organisms) and
methanogenic archaea. Similar to dry mofettes, the microbial
degradation of complex dissolved organic carbon (DOC) is also
restricted in these anaerobic environments (Krauze et al., 2017),
suggesting that upstreaming CO2is also one of the main carbon
sources for microorganisms. The connection to a deep saline
aquifer at some mofettes (e.g., Bublak, ∼1.5 km NNE of the
Hartoušov mofette) was indicated by the occurrence of specific
microorganisms from the deep subsurface biosphere and marine
paleoenvironments pointing to a widespread deep saline aquifer
as a general deep microbial habitat in this region (Krauze et al.,
2017).
In addition, other deep biosphere habitats may exist that are
associated with CO2reservoirs in geological trapping structures,
as indicated by an increase in gas flow rates after swarm
earthquakes pointing to a gas release after seismically induced
fracking of sealing layers (Sandig et al., 2014; Sauer et al.,
2014; Schuessler et al., 2016; Fischer et al., 2017). Additionally,
Kämpf and Bankwitz (2005) described dm- to m-sized cavities
in sediments of the nearby Nová Ves II open-cast mine at
50 mbs (meter below surface), which developed along fluid
Frontiers in Microbiology | www.frontiersin.org 2December 2020 | Volume 11 | Article 543260

Liu et al. Microbial Signatures of Deep Mofette-System
migration pathways. This suggests the presence of restricted gas-
filled cavities, which may function as distinct habitats for the
deep biosphere. An important indication for a CO2-related deep
biosphere was recognized by Bräuer et al. (2005) after a swarm
earthquake activity in 2000. They detected an increase in methane
concentrations at the Wettin spring (Bad Brambach, Germany)
about 20 km north of the Hartoušov mofette system, where a
significant decrease of δ13Cmethane was attributed to microbial
methane production from magmatic CO2and pre- or co-
seismically released hydrogen from the granitic basement. After a
swarm earthquake event in 2011, higher methane concentrations
were also detected at the Bublak mofette (Bräuer et al., 2018).
These previous investigations show that ascending geogenic
CO2-containing fluids locally alter the sedimentary overburden
and thus change the environmental conditions for microbial
life. Additionally, there is evidence of subsurface structures
that may host CO2-influenced deep microbial habitats, which
could function as deep microbial hotspots. However, studies
investigating the potential for CO2-related deep microbial life
in the Cheb Basin and the Eger Rift are still missing. Thus,
in early 2016 the German Research Centre for Geosciences
(GFZ) drilled a 108.5 m deep borehole as a test case for the
International Continental Scientific Drilling Program (ICDP)
project “Drilling the Eger Rift” (Dahm et al., 2013). The
borehole was positioned in the Hartoušov mofette system (HJB-
1) (50◦07′58′′N, 12◦27′46′′E) and described in detail by Bussert
et al. (2017). During drilling, CO2-rich sediments were recovered
between 71 and 81 mbs. At a depth of 78.5 mbs a CO2blow
out occurred, suggesting the presence of a subsurface CO2
accumulation. This CO2reservoir is associated to a basal low-
permeable CO2-saturated and saline aquifer (1,892 mg L−1of
free dissolved CO2) that occurs between 79 and 85 mbs at the
transition from Early Miocene terrestrial to overlying lacustrine
sediments. Hydrogeochemically, the aquifer is characterized by
a Na-Ca-HCO3-SO4-type water with a high Fe content of
up to 13.7 mg L−1and a pH of 6.4 (Bussert et al., 2017).
Due to the potential of the CO2-saturated aquifer to host a
very specialized microbial community we focussed on the core
interval between 65 and 95 mbs. Our aim was to identify the
impact of mantle-derived CO2on deep microbial communities
and to find out whether the low-permeable CO2-saturated and
saline aquifer might act as a hotspot for present deep microbial
life. The methodological approach to characterize the microbial
community included lipid biomarker analysis of past and
living microbial biomass (hopanoids, GDGTs and intact polar
lipids) as well as DNA analysis such as quantitative Polymerase
Chain Reaction (qPCR) and Illumina 16S rRNA gene amplicon
sequencing. Furthermore, the microbial signals were compared
to lithological background information and sedimentological
bulk parameters.
METHODS
Drilling, Coring, and Pump Test
A detailed description of the field work including drilling,
coring and a pump test was published by Bussert et al.
(2017). The drilling was performed with a Drillmec G-25
device installed on a Tatra 815 drilling lorry which discovered
core material in PVC liners with a length of 3m and a
diameter of 0.1 m. The drilling mud consisted of homogeneously
blended pure bentonite. In order to monitor potential drill mud
contamination of the retrieved core material, sodium fluorescein
was added to the drill mud with a concentration of 5 mg L−1
(Supplementary Figure 1D) according to Pellizzari et al. (2013).
Subsamples for further analysis were taken about every 0.5 m and
stored in gasbags flushed with nitrogen at −80◦C directly after
core recovery in the field. After the drilling campaign a 24h pump
test within the deep low-permeable CO2-saturated saline aquifer
was performed. The groundwater was filtered, the obtained water
samples geochemically analyzed and the obtained filters stored at
−20◦C, respectively.
Sample Processing and Contamination
Control
The initial lithological description of the sample material and
the drill mud contamination control were performed in the
lab. The frozen core segments were stored over night at 5◦C
to initiate thawing of the external sample layer and to avoid
fluid migration from the rim to the center of the samples. The
thawed rim (∼1 cm) was removed (inner coring), the still frozen
inner core described (e.g., Supplementary Figure 1), material
from the removed rim (outer rim) tested in triplicates for
fluorescein (Pellizzari et al., 2013) and the samples again stored
at −80◦C. To ensure that the samples are not contaminated
by external DNA the inner coring technique was repeated in a
clean bench (Thermo Scientific, Waltham, USA). The removed
material and the outside of the inner core were again tested
in triplicates for fluorescein (inner rim). Inner core samples
(sample) exceeding the background fluorescence were excluded
from further analysis (Supplementary Figure 1). The fluorescein
concentration was measured with a CLARIO star R
plate
reader (BMG LABTECH GmbH, Ortenberg, Germany). The
background fluorescence signal was obtained from samples of a
shallow drilling campaign (3 m) drilled in 2015 adjacent to our
study side without the application of drill mud and fluorescein
(Liu et al., 2018).
Bulk Carbon and Nitrogen Analyses
Total carbon (TC), total organic carbon (TOC), total nitrogen
(TN), and the bulk δ13Corg were all analyzed with the same
equipment consisting of a NC2500 Carlo Erba elemental analyser
coupled with a ConFlo_III interface on a DELTAplusXL isotope
ratio mass spectrometer (IRMS) (Thermo Fischer Scientific).
Prior to analysis the sample material was freeze-dried, powdered
and homogenized. In order to determine the TC and TN ∼25 mg
of sample material was loaded into tin capsules and the content
was calibrated against acetanilide. For investigation of TOC
and bulk δ13Corg the carbonate content was removed using in
situ decalcification. Therefore, depending on the TOC content,
3–10 mg sample material were loaded into Ag-capsules and
decalcified by drops of 3% HCl followed by 20% HCl and heated
for 3 h at 75◦C. The calibration was performed using elemental
urea and certified isotope standards (USGS24, IAEA-CH-7)
and proofed with an internal soil reference sample (Boden3,
Frontiers in Microbiology | www.frontiersin.org 3December 2020 | Volume 11 | Article 543260

Liu et al. Microbial Signatures of Deep Mofette-System
HEKATECH). All isotope compositions are given relative to the
VPDB (Vienna Pee Dee Belemnite) standard in the conventional
delta notation. The total inorganic carbon (TIC) was calculated
by subtraction of TOC from TC.
Lipid Biomarker Extraction and
Chromatographic Column Separation
The freeze-dried, powdered and homogenized sediment samples
(about 80 g) were extracted with a modified extraction method
after Bligh and Dyer (1959) using methanol:dichloromethane
(DCM):ammonium acetate buffer (pH 7.5) (2:1:0.8) as initial
extraction solvent mixture. The sample material was admixed
with the extraction solvent (4x sample mass in mL, ∼320 mL),
stirred with a flow-blending rod for 5 min and afterwards
centrifuged for 10 min with 2,500 rpm. The supernatant
was transferred to a separation funnel and the remaining
sample 2 times re-extracted in an ultrasonic bath for 10 min,
followed by centrifugation and transfer of the supernatant
into the separation funnel. To achieve phase separation, the
solvent ratio in the separation funnel was changed to 1:1:0.9
(methanol:DCM:ammonium acetate buffer). Afterwards the
organic phase containing the lipid extract was collected in
a turbovap glas and the solvent removed (TurboVap 500).
Each fifth sample was a blank. After extraction 5α-Androstane
and deuterium-labeled phosphatidylcholine (PCd54 =1,2-
dimyristoyl-d54-sn-glycero-3-phosphocholine) were added as
standards for compound quantification in the aliphatic and intact
polar lipid fractions, respectively. The obtained total extracts
were chromatographically separated into a low polar lipid (20 mL
chloroform), free fatty acid (50 mL methyl formiate with 0.025%
glacial acetic acid), glycolipid (20 mL acetone), and intact polar
lipid (IPLs, 25 mL methanol) fraction using two glass syringe
columns filled with dried pure silica (1 g silica gel 63–200 µm,
dried at 110◦C for 2 h) and Florisil (1 g magnesium silica gel 150–
250 µm) with the silica column on top of the Florisil column.
The IPL fraction was only eluted from the silica column (Zink
and Mangelsdorf, 2004). To improve IPL recovery the silica
column was eluted with 25 mL methanol:water (60:40) for a
second time. Phase separation was conducted as described above.
Finally the IPL fractions were combined and the solvent removed.
Afterwards, the IPL fraction was split into two halves: one for the
direct detection of IPLs and one for the detection of polar lipid
fatty acids (PLFAs) after saponification (Müller et al., 1993).
After removal of asphaltenes the low polar lipid fraction was
further subdivided by Medium Pressure Liquid Chromatography
(MPLC) into an aliphatic, aromatic, and Nitrogen-Sulfur-
Oxygen-containing compound (NSO) fraction (Radke et al.,
1980). The aliphatic fraction was analyzed for hopanoids
and the NSO fraction for glycerol dialkyl glycerol tetraethers
(GDGTs). GDGTs have been quantified with regard to an external
archaeol standard.
Determination of the Lipid Biomarkers
Analysis of IPLs was performed on a Thermo Scientific Ultimate
3000 RS Ultra high performance liquid chromatograph (UHPLC)
coupled to a Q Exactive Plus Orbitrap mass spectrometer
(MS) with a heated electrospray (H-ESI II) probe. Samples
were separated with a LiChrospher 100 diol column (2 ×
125 mm, 5 µm; CS-Chromatographie Service) equipped with a
pre-column filter. The eluents used for compound separation
were (A) n-hexane:isopropanol:formic acid:ammonia (25% in
water) 79:20:1.2:0.04 v/v and (B) isopropanol:water:formic
acid:ammonia (25% in water) 88:10:1.2:0.04 v/v (solvent
gradients: 1 min 100% A, linear increase of B to 65% within
20 and 40 min for reconditioning). The flow rate was set to
0.35 mL/min (modified after Rütters et al., 2001). ESI source
conditions were as follows: spray voltage −2.2 kV; capillary
temperature 300◦C; nitrogen sheath gas at 49 and auxiliary gas
at 12 arbitrary units at a temperature of 419◦C, S-Lens 65 V. The
obtained data were acquired in negative and positive ion mode
with dependent MS/MS acquisition at ranges of m/z 400–2,000.
The full scan and fragment spectra were collected at a resolution
of 280,000 and 70,000 (at m/z 200), respectively.
The aliphatic fraction and PLFAs were determined on a
Thermo Trace GC Ultra equipped with a Thermo PTV injection
system and a SGE BPX5 fused silica capillary column (50 m
length, 0.22 mm ID, 0.25 µm film thickness) coupled to a Thermo
Trace DSQ Quadrupole MS. Helium was used as carrier gas. The
temperature of the GC oven was programmed from 50◦C (hold
1 min) to 310◦C at a rate of 3◦C min−1, followed by an isothermal
phase of 30 min. The injector temperature was programmed from
50 to 300◦C at a rate of 10◦C s−1. The MS was operated in
electron impact ionization mode (EI) at 70 eV. Full scan mass
spectra for compound identification were recorded from m/z 50
to 600 at a scan rate of 1.5 scans s−1.
GDGT analysis was conducted on a Shimadzu LC10AD HPLC
instrument coupled to a Finnigan Triple Stage Quadrupole (TSQ)
7000 MS with an atmospheric pressure chemical ionization
(APCI) interface. Samples were separated at 30◦C with a Prevail
Cyano column (2.1 ×150 mm, 3 µm; Alltech) equipped with a
pre-column filter. The mobile phase consisted of (A) n-hexane
and (B) isopropanol and compound separation was achieved
using the following solvent gradients: 5 min 99% A and 1% B,
linear gradient to 1.8% B within 40 min, increase to 10% B within
1 min and holding time for 5 min to clean the column, back to
initial solvent conditions within 1 min and 16 min for column
equilibration (Schouten et al., 2007). The flow rate was set to
200 µL min−1. The APCI adjustments were: corona current
5µA giving a voltage of around 5 kV, vaporizer temperature
350◦C, capillary temperature 200◦C and nitrogen sheath gas at
60 psi (no auxiliary gas). Mass spectra were generated by selected
ion monitoring in the positive ion mode for the masses 1295.0,
1302.1, 1049.5, 1035.5, 1021.5, and 654.2 each with a width of 7
amu (to also obtain neighboring masses) representing major core
GDGTs at a scan rate of 0.33 s.
Compound specific δ13C values of the aliphatic fraction
(hopanoids) were determined with a GC-isotope ratio
monitoring (IR)-MS system consisting of an Agilent 7890
GC (USA) connected with an open split GC-C/TCIII-Interface
for compound-specific carbon and hydrogen isotope analysis
to a Delta V Plus IRMS (Thermo Fischer Scientific, Germany).
The GC-separated organic substances were oxidized to CO2in a
combustion furnace at a temperature of 940◦C on a CuO/Ni/Pt
catalyst. CO2was transferred to the mass spectrometer to
Frontiers in Microbiology | www.frontiersin.org 4December 2020 | Volume 11 | Article 543260

Liu et al. Microbial Signatures of Deep Mofette-System
determine carbon isotope ratios. Three microliter of the
aliphatic fraction were injected with a split ratio of 1:2 and an
initial temperature of 230◦C to a programmable temperature
vaporization inlet (PTV, Agilent Technology, USA). The injector
was heated to 300◦C with a heating rate of 12◦C s−1. The
separation of the aliphatic fractions was attained by a fused silica
capillary column (HP Ultra 1, 50 m ×0.2 mm ID, 0.33 µm FT,
Agilent Technology, Germany) with a temperature program
starting from 40 to 300◦C, with a heating rate of 4◦C min−1
and the maximum temperature held for 45 min. The carrier
gas was Helium with a flow rate of 1.0 mL min−1. All samples
were measured in triplicates with a usual standard deviation of
≤0.5‰. The quality of the results was checked by measuring
n-alkane standards (n-C15,n-C20, and n-C25) with known
isotopic composition (Campro Scientific, Germany). Isotopic
compositions are given in the delta notation relative to the
Vienna Pee Dee Belemnite (VPDB) standard.
DNA Extraction and Purification
Due to the extremely low amount of biomass in the core
samples, 10 g of powdered sample material was used to extract
the total genomic DNA with the DNeasy R
PowerMax R
Soil Kit
(QIAGEN, Venlo, Netherlands). Afterwards, the obtained DNA
was dissolved in 5 mL DNA-free water (Carl Roth, Karlsruhe,
Germany). For each sampling depth, three independent samples
were taken from different positions of the core horizon as
technical triplicate. The 5 mL DNA solution was concentrated
to 100 µL by an Eppendorf Concentrator Plus (Eppendorf
AG, Hamburg, Germany). The Genomic DNA Clean &
ConcentratorTM-10 (Zymo Research, Irvine, CA) was utilized to
remove humic acids and other substances that may inhibit the
polymerase chain reaction (PCR). Two DNA extractions were
done from separated sample duplicates. DNA from 1 mL DNA-
free water (Carl Roth, Karlsruhe, Germany) was extracted as a
negative control using the same DNA extraction approach.
In addition to the core material, ∼1 L of the fluid samples
from the pump test were filtered (0.2 µm) to collect insoluble
particles. The total genomic DNA trapped on the filters was
extracted by the FastDNATM SPIN Kit for Soil and the FastPrep R
Instrument (MP Biomedicals, Santa Ana, CA) with standard
protocols. The FastPrep R
Instrument homogenizing time and
the homogenizing speed were modified to 30 s and 5.5 m s−1
according to Liu et al. (2018).
Quantitative PCR
Total microbial abundance was estimated by determining
the number of bacterial 16S rRNA gene copies using
quantitative polymerase chain reaction (qPCR) targeting
the V3 region of the 16S gene with the primer pairs
341F (5′-CCTACGGGAGGCAGCAG−3′) and 534R (5′-
ATTACCGCGGCTGCTGG-3′) (Degelmann et al., 2010). The
qPCR Master Mix consisted of 10 µL SYBR R
FAST qPCR
Master Mix (2X) Universal (KAPA Biosystems, Wilmington,
Massachusetts, USA), 5.92 µL PCR water, 0.04 µL forward
primer (100 µM), 0.04 µL reverse primer (100 µM), and 4 µL
template. The qPCR was programmed as 3 min at 95◦C, 40 cycles
of 3 s at 95◦C, 20 s at 60◦C, 30 s at 72◦C, and 3 s at 80◦C for the
plate read. A cloned 16S rRNA gene fragment from Escherichia
coli was used as standard. The qPCR was conducted on a CFX96
real-time thermal cycler (Bio-Rad Laboratories Inc., USA) and
the analysis of the quantification data was performed with the
CFX ManagerTM software (Bio-Rad Laboratories Inc., USA). The
concentration range of the standard was optimized and set from
103to 10716S rRNA gene copies. The R2-value of the standard
curve line was 0.994–0.997.
Illumina MiSeq Amplicon Sequencing
The 16S rRNA gene was amplified with OptiTaqTM polymerase
(Roboklon, Berlin, Germany) which has a proofreading capability
due to the extremely low concentration of extracted total genomic
DNA. The PCR reaction solution consisted of 2.5 µL 10x Buffer
Pol C, 0.125 µL OptiTaqTM polymerase, 1 µL dNTP Mix (5 mM
each), 1 µL MgCl2(25 mM), 17.075 µL PCR water, 0.3 µL bovine
serum albumin, 0.25 µL forward primer (20 µM), 0.25 µL reverse
primer (20 µM) and 2.5 µL template. Unique combinations
of barcode-tagged 515F (5′-GTGCCAGCMGCCGCGGTAA-3′)
and 806R (5′-GGACTACHVGGGTWTCTAAT-3′) (Caporaso
et al., 2011) primers were assigned to each sample. PCR
amplifications were performed in volumes of 25 µL on
a T100TM thermal cycler (Bio-Rad Laboratories Inc., USA)
under the following conditions: 5 min at 95◦C, 35 cycles
of 30 s at 95◦C, 45 s at 56◦C, 60 s at 72◦C, and a final
extension step of 7 min at 72◦C. A cloned 16S rRNA gene
fragment from E. coli was used as positive control. Non-
template controls were included with each PCR run. The PCR
products were cleaned up with AMPure XP magnetic beads
(Beckman Coulter GmbH, Krefeld, Germany). After measuring
the DNA concentration with a CLARIO star R
plate reader (BMG
LABTECH GmbH, Ortenberg, Germany) PCR products were
pooled in equimolar amounts. The pooled DNA solution was
concentrated with Eppendorf Concentrator plus (Eppendorf AG,
Hamburg, Germany) to meet the requirement of the Illumina
MiSeq high-throughput sequencing. The final pooled DNA
concentration was 77.05 ng µL−1.
Bioinformatics and Statistical Analysis
Sequencing was performed by Eurofins Scientific SE
(Luxembourg) on an Illumina MiSeq (2 ×250 bp). Dual-
indexed reads were demultiplexed using CutAdapt (Martin,
2011) allowing for 10% errors in the primer and no errors in
the barcodes. Individual samples were processed according to
the DADA2 pipeline (Callahan et al., 2016). This includes an
initial sequence truncation (250 bp forward reads; 200 bp reverse
reads). The quality-filtered reads were used to generate an error
model that was applied for dereplication, sample inference,
and merging of the paired-end reads. All final sequences had
a standardized read-orientation and a minimum length of
200 bp. The sequence table was created and potential chimera
were filtered using a de novo approach. The resulting amplicon
sequence variants (ASVs) were imported into the QIIME2
framework (Bolyen et al., 2019) which facilitated the SILVA
taxonomy database (v132) (Quast et al., 2013) and VSEARCH
(Rognes et al., 2016) to assign taxonomic units. Singletons and
OTUs assigned to chloroplasts and mitochondria were removed
Frontiers in Microbiology | www.frontiersin.org 5December 2020 | Volume 11 | Article 543260
Loading more pages...