
The Use of Renewable Energy Technologies in the Libyan Energy System
Case Study: Brak City Region
vorgelegt von
M.Sc.
Giuma Ahmuda Sayah
geb. in Brak, Libyen
Von der Fakultät VI – Planen Bauen Umwelt
der Technischen Universität Berlin
zur Erlangung des akademischen Grades
Doktor der Ingenieurwissenschaften
– Dr.-Ing. –
genehmigte Dissertation
Promotionsausschuss:
Vorsitzender: Prof. Dr. rer. pol. Kristin Wellner
Gutachter: Prof. Dipl.-Ing. Rainer Mertes
Gutachter: Prof. Dr.-Ing. Dieter Bunte
Tag der wissenschaftlichen Aussprache: 19. April 2017
Berlin 2017
ii
Abstract
International organizations as well as nations worldwide are seeking to use renewable
energy technologies in their energy generation mix in order to decrease dependence on
fossil fuels and to promote climate protection. This study elaborates the problems facing
Libya’s energy system, and determines the potential for implementing renewable energy
technologies to solve these problems.
Libya is dependent on oil and gas as primary energy sources for electricity generation.
Governmental and corporate consideration of transitioning to renewable energy
technologies, as well as consideration of carbon dioxide emissions from this sector, has so
far been low. The development policy of the Libyan government does not meet the
development requirements as well as climate protection, where confined in develop energy
sector by installed power plants depend on fossil fuel as energy source. The current
installed capacity is insufficient to meet Libyan society’s demands, where the electricity
outages are frequent in hours and in days in some country regions.
Libya has considerable potential for feasibly and viably implementing renewable energy
technologies - especially solar and wind energy technologies. This may be concluded from
the case study of the Brak City region, which focuses on a hybrid renewable energy system
design. It determines the advantages of using these technologies, and their contributions to
sustainably solving the problems facing the Libyan energy system. The scenarios analyzed
in the case study show the cost of energy using renewable energy technologies is lower
overall than the current cost.
From results of this study can be concluded that the implementation of the renewable
energy technologies play an active role in filling the shortage gab in electricity production
as well as that they meet the development needs of Libyan society. Renewable energy
technologies can enable Libya’s economic, social, and environmental development. At the
global level, Libya has the potential to contribute with them to climate protection.
iii
Zusammenfassung
Internationale Organisationen sowie Nationen streben weltweit nach Technologien zur
Energieerzeugung mit erneuerbaren Energien. Auf diese Weise soll die Abhängigkeit von
fossilen Brennstoffen verringert und der Klimaschutz gefördert werden. Diese Studie stellt
die Probleme des libyschen Energiesystems dar und bestimmt, als Beitrag zur
Problemlösung das Potenzial der Einführung von erneuerbaren Energietechnologien.
Libyen Stromerzeugung ist abhängig von dem Primären Energieträgen Öl und Gas.
Überlegungen von Seiten der Regierung und von Unternehmen in Bezug auf die
Einführung von erneuerbaren Energietechnologien, ebenso wie Überlegungen zu den
Reduzierungen von Emissionen von Kohlendioxid in diesem Sektor, waren bisher gering.
Die Entwicklungspolitik der libyschen Regierung erfüllt nicht die Anforderungen des
Klima Schutzes. Die derzeit installierte Leistungsfähigkeit reicht nicht aus, um den
gesellschaftlichen Anforderungen der lybischen Gesellschaft gerecht zu werden -
Stromausfälle sind häufig in Stunden und in Tagen in einigen Regionen des Landes.
Libyen hat ein erhebliches Potenzial für realisierbare und mit vertretbarem Aufwand
realisierbare Technologien für erneuerbare Energien - vor allem Solar- und
Windenergietechnologien. Dies kann aus der Fallstudie des Brak City-Region geschlossen
werden, die ein hybrid-erneuerbares Energie-System-Design konzipiert. Dieses bestimmt
die Vorteile der Nutzung dieser Technologien, und ihre Beiträge zur nachhaltigen Lösung
der Probleme die im libyschen Energiesystem bestehen. Die Szenarien, die in der Fallstudie
analysiert werden, zeigen, dass die Kosten für Energietechnologien mit erneuerbaren
Energien niedriger sind als die aktuellen Kosten.
Aus den Ergebnissen dieser Studie ergab, dass die Umsetzung der Technologien für
erneuerbare Energien können zur Füllen der Mangel Gab bei der Stromerzeugung eine
aktive Rolle führen werden sowie die Entwicklungsbedürfnisse der libysch Gesellschaft
gerecht werden. Erneuerbare Energietechnologien können Libyens wirtschaftliche, soziale
und ökologische Entwicklung ermöglichen. Auf globaler Ebene hat Libyen das Potenzial
mit ihnen zum Klimaschutz beizutragen.
iv
Acknowledgements
Thanksgiving and Praise be to God the Merciful. I wish to express thanks and gratitude to
my parents.
I would like to extend my heartfelt thanks and gratitude to Prof. Dipl.-Ing. Rainer Mertes
and Prof. Dr.-Ing. Dieter Bunte for their interest and scientific guidance throughout the
writing of my doctoral thesis. Their support and encouragement is what has made this
dissertation possible.
Special thanks to my wife, Aisha, for her understanding. I would also like to express thanks
and appreciation to my country Libya, which awarded me a scholarship for 3 years to
complete my studies at leading international universities.
Berlin, 29 September 2016 Giuma Sayah
v
Table of Contents
1.
Introduction..............................................................................................
1
1.1.
Problem Statement.....................................................................................
1
1.2.
Research Objectives...................................................................................
5
1.3.
Thesis Structure..........................................................................................
5
1.4.
Research Methodology and Workflow Strategy........................................
6
1.5.
Limitations of the Study.............................................................................
9
2.
Present Status of Energy Sector in Libya………………......................
10
2.1.
Libya –Country Overview..........................................................................
10
2.1.1.
General Overview......................................................................................
10
2.1.2.
Political and Administrative System..........................................................
12
2.1.3.
Energy Sector.............................................................................................
14
2.2.
Current Situation of Energy System...........................................................
15
2.2.1.
Electricity Supply System..........................................................................
15
2.2.2.
Energy Resources and Production Technology.........................................
17
2.2.3.
Energy Consumption and Demand............................................................
18
2.3.
Present use of Renewable Energy Technologies………............................
20
2.4.
Development Challenges and Opportunities..............................................
21
2.4.1.
Challenges..................................................................................................
21
2.4.2.
Opportunities..............................................................................................
22
2.5.
Conclusion..................................................................................................
22
3.
Potential of Renewable Energy Technologies in Libya……………….
24
3.1.
Potential of Biomass Energy......................................................................
24
3.1.1.
The Resources and Conversion Techniques...............................................
24
3.1.2.
Potential in Libya.......................................................................................
25
3.2.
Potential of Geothermal Energy.................................................................
26
3.2.1.
The Resources and Technology.................................................................
26
3.2.2.
Potential in Libya.......................................................................................
28
3.3.
Potential of Hydropower Energy................................................................
29
Abstract.......................................................................................................................
ii
Zusammenfassung......................................................................................................
iii
Acknowledgments......................................................................................................
iv
Table of Contents........................................................................................................
v
List of Figures ............................................................................................................
ix
List of Tables..............................................................................................................
xiv
List of Abbreviations..................................................................................................
xv
vi
3.3.1.
The Resources and Technology.................................................................
29
3.3.2.
Potential in Libya.......................................................................................
30
3.4.
Potential of Solar Energy...........................................................................
31
3.4.1.
The Resources and Technology.................................................................
31
3.4.2.
Potential in Libya.......................................................................................
32
3.5.
Potential of Wind Energy in Libya............................................................
33
3.5.1.
The Resources and Technology.................................................................
33
3.5.2.
Potential in Libya.......................................................................................
34
3.6.
Conclusion..................................................................................................
35
4.
Case Study Methodology and Area........................................................
37
4.1.
Case Study Approach.................................................................................
37
4.1.1.
Case Study Objectives................................................................................
37
4.1.2.
Selected Software.....................................................................................
38
4.1.3.
Case Study Scenarios.................................................................................
40
4.2.
Case Study Area.........................................................................................
42
4.2.1.
Brak City Overview...................................................................................
42
4.2.2.
Current Situation of Electricity System.....................................................
43
4.2.3.
Potential of Renewable Energy in Region.................................................
44
4.3.
Design Electricity Demands of Brak City..................................................
45
4.3.1.
Methodology of Design the Demand Load................................................
45
4.3.2.
Determine the Growth Rate of Population.................................................
46
4.3.3.
Determine the Growth Rate for Electricity Consumption..........................
47
4.3.4.
Determine the Electricity Load Ratio.........................................................
49
4.3.4.1.
Monthly Load Ratio...................................................................................
49
4.3.4.2.
Daily Load Ratio........................................................................................
52
4.3.5.
Distribution the Load Based on Ratio.......................................................
54
4.4.
Project Site Selection.................................................................................
55
4.5.
Conclusion..................................................................................................
61
5.
Brak City Hybrid Renewable Energy System Components and
Assumptions of Models Inputs................................................................
62
5.1.
Primary Electrical Load of System............................................................
62
5.2.
Data Selection for the Major Components of the Hybrid Renewable
Energy System……………………………………………………………
64
5.2.1.
Photovoltaic Panel......................................................................................
64
5.2.2.
Wind Turbine.............................................................................................
67
5.2.3.
Generator....................................................................................................
72
5.2.4.
Converter....................................................................................................
73
5.2.5.
Battery........................................................................................................
74
vii
5.3.
Energy Resource........................................................................................
75
5.3.1.
Solar Resource............................................................................................
75
5.3.2.
Wind Resource...........................................................................................
77
5.3.3.
Diesel Fuel..................................................................................................
81
5.4.
System Parameters.....................................................................................
82
5.4.1.
Economic Inputs.........................................................................................
82
5.4.2.
Constraints Inputs.......................................................................................
83
5.4.3.
Ambient Temperature Inputs.....................................................................
85
5.4.4.
System Control Inputs................................................................................
86
5.4.5.
Grid Extension Inputs.................................................................................
87
5.5.
Summary of Inputs and Selected Values....................................................
88
6.
Results Analysis and Discussion of Design Brak City Hybrid
Renewable Energy System.......................................................................
90
6.1.
Scenario I: Design Solar Hybrid Energy System for Electricity Supply
to Brak City................................................................................................
90
6.1.1.
Scenario I: Concept Formulation...............................................................
90
6.1.2.
Results Analysis of Solar Stand-Alone System.........................................
91
6.1.2.1.
Optimization Results .................................................................................
91
6.1.2.2.
Simulation Results of Energy Production of the Optimal System…….....
92
6.1.2.3.
Sensitivity Results......................................................................................
93
6.1.3.
Results Analysis of Solar Grid-Connected System....................................
95
6.1.3.1.
Optimization Results..................................................................................
95
6.1.3.2.
Simulation Results of Energy Production of the Optimal System….........
95
6.1.3.3.
Sensitivity Results......................................................................................
96
6.1.4.
Breakeven Grid Extension Distance of Solar Hybrid Energy System.......
99
6.1.5.
Conclusion..................................................................................................
100
6.2.
Scenario II: Design Wind Hybrid Energy System For Electricity Supply
to Brak City................................................................................................
102
6.2.1.
Scenario II: Concept Formulation..............................................................
102
6.2.2.
Results Analysis of Wind Stand-Alone System.........................................
103
6.2.2.1.
Optimization Results..................................................................................
103
6.2.2.2.
Simulation Results of Energy Production of the Optimal System….........
104
6.2.2.3.
Sensitivity Results......................................................................................
105
6.2.3.
Results Analysis of Wind Grid-Connected System...................................
106
6.2.3.1.
Optimization Results..................................................................................
106
6.2.3.2.
Simulation Results of Energy Production of the Optimal System….........
107
6.2.3.3.
Sensitivity Results......................................................................................
107
6.2.4.
Breakeven Grid Extension Distance of Wind Hybrid Energy System.......
109
6.2.5.
Conclusion..................................................................................................
110
viii
6.3.
Scenario III: Design Solar and Wind Hybrid Energy System for
Electricity Supply to Brak City..................................................................
112
6.3.1.
Scenario III: Concept Formulation.............................................................
112
6.3.2.
Result Analysis of Solar and Wind Stand-Alone System..........................
113
6.3.2.1.
Optimization Results..................................................................................
113
6.3.2.2.
Simulation Results of Energy Production of the Optimal System.............
114
6.3.2.3.
Sensitivity Results......................................................................................
115
6.3.3.
Results Analysis of Solar and Wind Grid-Connected System...................
117
6.3.3.1.
Optimization Results..................................................................................
117
6.3.3.2.
Simulation Results of Energy Production of the Optimal System….........
117
6.3.3.3.
Sensitivity Results......................................................................................
118
6.3.4.
Breakeven Grid Extension Distance of Solar and Wind Hybrid Energy
System……………………………………………………………………
119
6.3.5.
Conclusion..................................................................................................
121
6.4.
Comparison the Cost of Energy of Scenarios……....................................
121
6.5.
Summary of Findings.................................................................................
123
7.
Vision for Implementing Renewable Energy Technologies in Libya..
125
7.1.
Outlook of Implementing the Solar and Wind Energy in Other Regions
of Libya…………………………………………………………………..
125
7.2.
Role of Using Renewable Energy Technologies in Energy System of
Libya……………………………………………………………………...
128
8.
Conclusion.................................................................................................
130
8.1.
Conclusion..................................................................................................
130
Appendixes................................................................................................................
133
Appendix 1: Administrative Districts of Libya..........................................................
133
Appendix 2: Determine Energy Demand for Brak City.............................................
134
Appendix 3: Project Locations Characteristics and Data...........................................
139
Appendix 4: Wind Turbines Technical Specifications...............................................
144
Appendix 5: HOMER Input Summary.......................................................................
146
Appendix 6: Scenarios Component Sizes and Sensitivity Variables..........................
157
Appendix 7: Districts Outlook Results.......................................................................
162
Bibliography..............................................................................................................
184
ix
List of Figures
Figure 1.1:
Research problem analysis and objective to be achieved……...…......
4
Figure 1.2:
Research methodology and workflow strategy framework……..........
8
Figure 2.1:
Geographical location of Libya……………………………………....
11
Figure 2.2:
The administrative districts system in Libya……………………........
13
Figure 2.3:
Electric power transmission and distribution losses in Libya in 2003-
2013…………………………………………………………..............
16
Figure 2.4:
Energy production sources of Libya in 2012………………………...
17
Figure 2.5:
Energy production technologies of Libya in 2012…………………...
18
Figure 2.6:
Carbon dioxide emission categories of Libya in 2012…………….....
18
Figure 2.7:
Electric energy consumption per capita of Libya for 8 years (2003-
2010)……………………………………………………….................
19
Figure 3.1:
Biomass energy feedstocks with their conversion techniques…….....
25
Figure 3.2:
Libya with a world resource map of convective hydrothermal
resources………………………………………………………….......
29
Figure 3.3:
Average wave energy flux spent and tidal direction of Libya….........
31
Figure 3.4:
Global horizontal irradiation map of Libya……………………….....
33
Figure 3.5:
Wind energy potential in Libyan districts……………………...….....
35
Figure 4.1:
Conceptual representation of the software process…………...….......
40
Figure 4.2:
Case study protocol and methodology………………………...…......
41
Figure 4.3:
Libya map with Wadi Al Shati district and Brak City location….......
43
Figure 4.4:
Calculate steps for the primary electrical load of Brak City HRES
need......................................................................................................
46
Figure 4.5:
Population growth rate of Libya from 2003-2012 that been used to
assess the growing population in Brak City in order to specify the
increasing electricity demand in coming years in the region…….......
47
Figure 4.6:
Electricity consumption per capita growth rate of Libya from 2003
and 2010 that been used to specify the increasing electricity rate
required in the design of Brak City HRES...........................................
48
Figure 4.7:
Monthly load curve of Libya’s electricity network 2012 that used in
design in order to determine the load ratio in each month for Brak
City HRES, where the load ratio extracted is based on the average
load values……………………………………………........................
51
Figure 4.8:
Monthly energy ratio used in the design of Brak city HRES, which
is determined based on average monthly load values of Libya’s
electricity network in 2012……………………………………...…....
51
Figure 4.9:
Daily load curve of Libya’s electricity network in 2008 that was
used in the design in order to determine the load ratio in each hour
of the day for Brak City HRES, where the load ratio was extracted
53
x
based on average daily load values…………...……….......................
Figure 4.10:
Daily energy ratio used in the design of Brak city HRES, which is
determined based on average daily load values of Libya’s electricity
network in 2008…………………..……………………………….….
53
Figure 4.11:
Monthly load outlook of Brak City in 2017 used in the design of
Brak City HRES that was designed based on Libya’s monthly
electricity load ratio network in 2012 with consideration of expected
monthly energy demand in the region……………..............................
54
Figure 4.12:
Daily load outlooks in each month for Brak City in 2017 used in the
design of Brak City HRES that was designed based on monthly
daily load ratios of Libya’s electricity network in 2008 with
consideration to expected daily energy demand in the region..……...
55
Figure 4.13a:
Satellite map of Wadi Al Shatii municipality and Brak City region
with detailed zones………………………………………...………....
57
Figure 4.13b:
Satellite detailed map of zone C with selected project locations.........
58
Figure 4.14:
Satellite map for the selected location (L2) of the Brak City HRES...
60
Figure 5.1a:
Primary Electrical Load for Brak City HRES......................................
62
Figure 5.1b:
Monthly load profile for the Brak City HRES (indicated as seasonal
profile in Figure 5.1a)……………………………...………
63
Figure 5.1c:
Daily load profile of each month for the Brak City HRES calculated
by the software …………...…………………………...…………......
63
Figure 5.2:
PV system input values used to design the Brak City HRES…….......
66
Figure 5.3a:
Wind turbine E-82 input values used in the design of Brak City
HRES………...…………………………………………………….....
71
Figure 5.3b:
Wind turbine E-101 inputs values used in the design of Brak City
HRES…………...………………………………………………….....
71
Figure 5.4:
Generator inputs values used in the design of Brak City
HRES…................................................................................................
73
Figure 5.5:
Converter inputs values used in the design of the Brak City HRES....
74
Figure 5.6:
Battery inputs values used in the design of the Brak City HRES…....
75
Figure 5.7:
Solar resource inputs values for the site of the Brak CityHRES…......
77
Figure 5.8:
Wind resource inputs values for the site of the Brak City HRES…....
79
Figure 5.9a:
Sensitivity study on Weibull k value versus COE...............................
80
Figure 5.9b:
Sensitivity study on autocorrelation factor value versus COE.............
80
Figure 5.9c:
Sensitivity study on diurnal pattern strength value versus COE..........
81
Figure 5.9d:
Sensitivity study on hour of peak wind speed value versus COE........
81
Figure 5.10:
Economic inputs values used in the design of the Brak City HRES....
83
Figure 5.11:
Sensitivity study on project lifetime versus COE................................
83
Figure 5.12:
Sensitivity study on minimum renewable fraction value versus COE.
84
Figure 5.13:
Constraints inputs values used in the design of the Brak City
85
xi
HRES………………………………………………………………....
Figure 5.14:
Temperature inputs values used in the design of the Brak City
HRES………………………………………………………………....
86
Figure 5.15:
System control inputs values used in the design of the Brak City
HRES………………………………………………………………....
87
Figure 5.16:
Grid extension inputs values used in the design of the Brak City
HRES………………………………………………………………....
88
Figure 6.1:
Optimization results for solar stand-alone HES for Brak city at
sensitivity variables of solar radiation 5.7 kWh/m2/d and diesel price
0.20 $/L………………………..………...…………………………...
91
Figure 6.2:
Simulation results for solar stand-alone HES for Brak City at solar
radiation of 5.7 kWh/m2/d and diesel price 0.20 $/L….……………..
92
Figure 6.3:
Sensitivity results and OST for solar stand-alone HES for Brak City
with superimposed LCOE…………………………...……….............
93
Figure 6.4:
Sensitivity result categories for solar stand-alone HES for Brak City.
94
Figure 6.5:
Optimization results for solar grid-connected HES for Brak City at
sensitivity variables of solar radiation 5.7 kWh/m2/d and diesel price
0.20 $/L…………...………………………...……………..................
95
Figure 6.6:
Simulation results for solar grid-connected HES for Brak City at
solar radiation of 5.7 kWh/m2/d and diesel price 0.20 $/L……….......
96
Figure 6.7:
Sensitivity study on diesel price versus grid COE...............................
97
Figure 6.8a:
Sensitivity result categories for solar grid-connected HES for Brak
City at diesel price 0.20 $/L.................................................................
98
Figure 6.8b:
Sensitivity result categories for solar grid-connected HES for Brak
City at diesel price 0.40 $/L.................................................................
98
Figure 6.8c:
Sensitivity result categories for solar grid-connected HES for Brak
City at diesel price 0.60 $/L.................................................................
98
Figure 6.8d:
Sensitivity result categories for solar grid-connected HES for Brak
City at diesel price 0.80 $/L.................................................................
98
Figure 6.9:
Breakeven grid extension distances for solar HES for Brak City at
sensitivity variables of solar radiation 5.7 kWh/m2/d and with
different diesel price categories ……........................…………….......
100
Figure 6.10:
Comparison of COE for solar HES categories for Brak City………...
101
Figure 6.11:
Schematic configurations for solar HES categories for Brak City.......
102
Figure 6.12:
Optimization results for wind stand-alone HES for Brak City at
sensitivity variables of wind speed 4.3 m/s and diesel price 0.20
$/L........................................................................................................
104
Figure 6.13:
Simulation results for wind stand-alone HES for Brak City at wind
speed 4.3 m/s and diesel price 0.20 $/L….………………...…….......
104
Figure 6.14:
Sensitivity results and OST for the wind stand-alone HES for Brak
City with superimposed LCOE............................................................
105
xii
Figure 6.15:
Sensitivity results categories for wind stand-alone HES for Brak
City ……….…...………………....…..................................................
106
Figure 6.16:
Optimization results for wind grid-connected HES for Brak City at
sensitivity variables of wind speed 4.3 m/s and diesel price 0.20 $/L.
106
Figure 6.17:
Simulation results for wind grid-connected HES for Brak City with
wind speed 4.3 m/s and diesel price 0.20 $/L….………………...…..
107
Figure 6.18a:
Sensitivity result categories for wind grid-connected HES for Brak
City at diesel price 0.20 $/L.................................................................
108
Figure 6.18b:
Sensitivity result categories for wind grid-connected HES for Brak
City at diesel price 0.40 $/L.................................................................
108
Figure 6.18c:
Sensitivity result categories for wind grid-connected HES for Brak
City at diesel price 0.60 $/L.................................................................
108
Figure 6.18d:
Sensitivity result categories for wind grid-connected HES for Brak
City at diesel price 0.80 $/L.................................................................
109
Figure 6.19:
Breakeven grid extension distances for wind HES for Brak City at
sensitivity variable of wind speed 4.3 m/s and with different diesel
price categories ........................………………………………………
110
Figure 6.20:
Comparison of COE for wind HES categories for Brak City………..
111
Figure 6.21:
Schematic configurations for wind HES categories for Brak City…..
112
Figure 6.22:
Optimization results for solar and wind stand-alone HES for Brak
City at sensitivity variables of solar radiation 5.7 kWh/m2/d, wind
speed 4.3 m/s and diesel price 0.20 $/L…………..…...…………......
114
Figure 6.23:
Simulation results for solar and wind stand-alone HES for Brak City
at solar radiation 5.7 kWh/m2/d, wind speed 4.3 m/s and diesel price
0.20 $/L…………...………...……………………………..................
114
Figure 6.24:
Sensitivity results and OST for solar and wind stand-alone HES for
Brak city with superimposed LCOE and diesel price 0.20 $/L……....
115
Figure 6.25a:
Sensitivity result categories for solar and wind stand-alone HES for
Brak City (10 of 36 sensitivity variables)….………….....…….....….
116
Figure 6.25b:
Sensitivity result categories for solar and wind stand-alone HES for
Brak City (26 of 36 sensitivity variables)……………………………
116
Figure 6.26:
Optimization results for solar and wind grid-connected HES for
Brak City at sensitivity variables of solar radiation 5.7 kWh/m2/d,
wind speed 4.3 m/s and diesel price 0.20 $/L….…………………….
117
Figure 6.27:
Simulation results for solar and wind grid-connected HES for Brak
City at solar radiation 5.7 kWh/m2/d, wind speed 4.3 m/s and diesel
price 0.20 $/L…………….………………..........................................
118
Figure 6.28a:
Sensitivity result categories for solar and wind grid-connected HES
for Brak City at diesel price 0.20 $/L...................................................
118
Figure 6.28b:
Sensitivity result categories for solar and wind grid-connected HES
119
xiii
for Brak City at diesel price 0.40 $/L...................................................
Figure 6.28c:
Sensitivity result categories for solar and wind grid-connected HES
for Brak City at diesel price 0.60 $/L...................................................
119
Figure 6.28d:
Sensitivity result categories for solar and wind grid-connected HES
for Brak City at diesel price 0.80 $/L...................................................
119
Figure 6.29:
Breakeven grid extension distance for solar and wind HES for Brak
City at solar radiation 5.7 kWh/m2/d, wind speed 4.3 m/s and with
different diesel price categories ...............……….………..….....……
120
Figure 6.30:
Comparison of COE for stand-alone systems of the scenarios at
different diesel prices..................………………………………….....
122
Figure 6.31:
Comparison of COE for grid-connected systems of the scenarios at
different diesel prices...............………………………...………....….
123
Figure 7.1:
Outlook of the optimal RET to use for each district of Libya at
various diesel price levels with COE related to establishing stand-
alone HRES…............……………………...………………………...
126
Figure 7.2:
Outlook of the optimal RET to use for each district of Libya at
various diesel price levels with COE related to establishing grid-
connected HRES ...………………………...………………............…
127
Figure 7.3:
Libya outlook map for optimal RET to use in each district of Libya
at diesel price 0.20 $/L, 0.40 $/L, 0.60 $/L and 0.80 $/L, related to
establishing stand-alone HRES as well as grid-connected HRES.......
128
xiv
List of Tables
Table 2.1:
Existing uses of RE technologies and their installed capacity in Libya..
20
Table 3.1:
Potential of RE technologies in Libya.......................………………......
36
Table 4.1:
Possibilities of RE in Brak City region.......………………………….....
44
Table 4.2:
Estimation of minimum load in design of Brak City HRES …………...
49
Table 4.3:
Locations assessments and selection of the project site………………...
59
Table 4.4:
Details and characteristics of the site for Brak City HRES......………...
61
Table 5.1:
Input values summary of the PV system and parameters assumption
details………………………………………………………………..….
66
Table 5.2:
Wind turbine cost and parameters assumption details……………….....
70
Table 5.3:
Sensitivity study on wind turbine hub height versus COE......................
70
Table 5.4:
Wind resource parameters assumption details……………………….....
79
Table 6.1:
Rank of COE for all system categories of the scenarios at average
renewable sources at the site of Brak City HRES with different diesel
prices........................................................................................................
122
xv
List of Abbreviations
AC
Alternating Current
A-Si
Amorphous Silicon
Apr
April
Aug
August
CdTe
Cadmium Telluride
CO2
Carbon Dioxide
CSP
Concentrating Solar Power
CIGS
Copper Indium Gallium Selenide
COE
Cost of Energy
CC
Cycle Charging
D map
Data Map
Dec
December
°C
Degree Celsius
DG
Diesel Generator
DC
Direct Current
EPRI
Electric Power Research Institute
EGS
Enhanced Geothermal Systems
Feb
February
GECOL
General Electricity Company of Libya
GNC
General National Congress
GNP
General of the National Parliament
GPC
General People Congress
GHPs
Geothermal heat pumps
GHI
Global Horizontal Irradiation
GDP
Gross Domestic Product
HVDC
High Voltage Direct Current
HAWTs
Horizontal Axis Wind Turbines
HES
Hybrid Energy System
HOMER
Hybrid Optimization of Multiple Energy Resources
HRES
Hybrid Renewable Energy System
IEA
International Energy Agency
IMF
International Monetary Fund
IRENA
International Renewable Energy Agency
Jan
January
Jul
July
Jun
June
Km
Kilometer
kW
Kilowatt
xvi
kWh
Kilowatt-hour
kWh/m2/d
Kilowatt-hour per Square Meter per Day
kWh/yr
Kilowatt-hour per Year
kWm
Kilowatt-meter
kWp
Kilowatt-peak
LCOE
Levelized Cost of Energy
Lisco
Libyan Iron and Steel Company
LF
Load Following
MMRP
Man-Made River Project
Mar
March
May
May
MW
Megawatt
MWh
Megawatt-hour
MWh/d
Megawatt-hour per Day
MENA
Middle East and North Africa
Mon.
Monthly
NASA
National Aeronautics and Space Administration
NPC
Net Present Cost
Nov
November
Oct
October
O&M
Operation and Maintenance
OST
Optimal System Type
PV
Photovoltaic
RE
Renewable Energy
REAOL
Renewable Energy Authority of Libya
REN21
Renewable Energy Policy Network for the 21st Century
RET
Renewable Energy Technology
Sep
September
Solargis
Solar Geographical Information System
SWH
Solar Water Heating
Km2
Square kilometer
TWh/yr
Terawatt-hour per year
UNEP
United Nations Environment Programme
$ or USD
United State Dollar
$/kWh
United State Dollar per Kilowatt-hour
$/L
United State Dollar per Liter
VAWTs
Vertical Axis Wind Turbines
WB
World Bank
WDI
World Development Indicator

1
1. Introduction
1.1. Problem Statement
Currently and also in the near future the most pressing environmental issue is climate
change and global warming. Nations react on this with increasing of use of renewable
energy (RE) sources to reduce conventional electricity generation. Michaelides argues that,
“The most pressing environmental issue of the early twenty-first century is the
accumulation of carbon dioxide (CO2) and the expected global warming. Global warming
has becomes an urgent political issue in many countries” (2012, p.35). Libya is dependent
on carbon primary energy for electricity generation. There is no official political or
corporate support for using indigenous RE sources in its energy system (General Electricity
Company of Libya (GECOL), 2012, p.4)1. The environmental consequence of conventional
energy production in Libya is high CO2 emissions. In 2008 62.1% of total fuel combustion
is used for energy production (World Bank (WB), 2012, p.179)2. In consequence huge
budget spending can be noticed to decrease such emissions and upgrade electricity supply
system with higher-efficiency technologies, while the up to day development does not meet
society requirements as well as climate protection requirements. Than even nowadays new
installed capacities for electricity generation fuelled by petroleum derivatives 3.
Additionally, must be mentioned the subsidies with which the Libyan government
minimizes the cost of electricity tariff for their citizens. Round about 1% of the Gross
Domestic Product (GDP) meaning 0.9 billions of United States Dollar (USD) is spend to
subsidy the electricity price (International Monetary Fund (IMF), 2013, p.2)4.
International organizations and nation states worldwide are supporting transitions from
fossil fuel energy to RE sources. Many countries have developed policies promoting
renewable energy technology (RET) to decrease emissions, and raising energy system
1 This is the recent research issued by GECOL in this area represented in Statistics Report 2012, electricity
production technology and fuel type.
2 WB publications, World Development Indicators (WDI) 2012, environment: Carbon dioxide emissions by
sector, p.179
3 GECOL, Annual Reports 2012, 2010 and 2009, electricity production technology, p.4, p.13 and p.10
respectively (reports of 2010 and 2009 are in Arabic version).
4 International Monetary Fund, Libya selected issues country report 13/151, May 2013, p.2

2
efficiency. The Renewable Energy Policy Network for the 21st Century (REN21)
concluded that, “Since 2004, the number of countries promoting renewable energy with
direct policy support has nearly tripled, from 48 to over 140, and an ever-increasing
number of developing and emerging countries are setting renewable energy targets and
enacting support policies. Policy targets have become increasingly ambitious, and their
focus is expanding beyond electricity to include heating, cooling, and transport” (2014,
p.6).
Beside this global aspect Libya is fighting with home made problems. Even the installed
electricity capacity is growing in Libya still the supply is behind demand. Libya is
experiencing with unscheduled and scheduled power outages. Outages are most common in
peak demand periods in summer, when demand for electric cooling is highest. This
situation became critical after the Libyan revolution in 2011, during which energy
infrastructure, including power plants and transmission lines, were damaged and
destroyed5. Representative international media coverage describes the current situation of
electricity supply in Libya as follows6:
“In the past few days the capital Tripoli has had power cuts lasting up to 15 hours a day
and in Benghazi in the east as much as 20 hours. Libyan Iron and Steel Company (Lisco),
which has struggled with electricity shortages for two years, is one of the only foreign
currency earners outside the oil and gas industry” (Routes, 2015)7
“Libya plans to import electricity from neighboring Egypt and Tunisia and to rent power
generators to avoid power outages” (Enerdata, 2015)8
5 The revolution was from February 2011 to October 2011.
6 In order to give evidence and argumentation to support the rationales behind conducting this study,
international press reports have been used due to lack of other literature.
7 Reuters Africa news: UPDATE 2-Power shortages shut production at Libya's biggest steel firm, Routes,
report by Ahmed Elumami, August 4, 2015, available at:
http://af.reuters.com/article/libyaNews/idAFL5N10F45Z20150804 [Accessed: 15th October 2015]
8 Recent energy news Enerdata inelegance &consulting 10 August 2015 - Libya will import electricity from
Egypt and Tunisia to avoid shortage http://www.enerdata.net/enerdatauk/press-and-publication/energy-news-
001/libya-will-import-electricty-egypt-and-tunisia-avoid-shortage_33701. html [Accessed: 15th October
2015].

3
“Engineers and technicians from General Electric Company of Libya (GECOL) have been
fighting a losing battle to maintain power supply throughout the country during the summer
peak. With almost no budget for operations and maintenance, a massive deficit in
generation capacity, and frequent grid failures caused both by accident and sabotage, large-
scale outages have become a daily occurrence. According to one Tripoli resident "If there
are just ten hours of power cuts, we are happy. Some days it is worse. Everyone who can
get one has bought a generator” (African Energy, 2015)9
A further major problem is that Libya is facing desertification and lack of freshwater
resources. For this reason, the Libyan government has prioritised planning to construct
desalination plants, especially in the coastal cities where demand is highest. Priority has
also been given to a large water development project, named Man-Made River Project
(MMRP), which transports freshwater from the Sahara Desert to these coastal cities
(TinMore Institute, 2012, p.5)10. This also increased electricity demand. Moreover, the
population is growing, new development projects including houses, building complexes,
industries and agricultural projects which are currently undertaken make the need to
increase the energy production capacity as a priority for development.
In general can be concluded that Libya is facing many problems with its electricity
production and supply system in both levels national and global. The national problems are
represented in not meeting the energy demand of the society, harm is given the
environment due to conventional electricity generating and there is no sharing to RET.
Shortage and outage of the electricity hinders the economic progress. Regarding the global
level, Libya has to stand with other communities to fight against global warming and
climate change to reduce emissions resulting from power generation and the development
of the energy sector towards sustainable development.
9 African Energy, Libya – archive news issue 306, 6 August, 2015 http://www.africa-
energy.com/libya?type=articles accessed date [16th October 2015]
10 Water security and interconnected challenges in Libya, TinMore institute research report WS121027,
November 2012, p. 5-9.

4
Accordingly, this thesis is focused on utilising the advantages that RET can deliver for the
Libyan energy supply system, and on overcoming the problems facing the energy sector on
the national and global levels. This is tied to achieve with the case study method for
designing a hybrid renewable energy system (HRES) in Brak City, and by applying the
results of this case study to other regions of Libya. The solutions gained from this study
can enable Libya to overcome its electricity capacity shortage, and to optimize the energy
supply system in Libya through sustainable use of RET. The expected effects of the use of
RET as well as the causes and effects of the main problem are shown in Figure 1.1. This
Figure represents the research problem analysis and the target to be achieved in the study
as a solution to the problem.
Figure 1.1: Research problem analysis and objective to be achieved (Source: author)
The Problem
Energy capacity does not meet demand
CO2 emission
and pollution
from energy
sector
Inefficient
energy supply
system
hinders the
economic
progress
Energy generation
by a conventional
method
Shortage in energy loads, electricity
outage for long period
Growing energy demand
Meet the
growing need
of energy
Keep a
resource
Improve efficiency of energy supply system
Share the RET in energy
generation system
Reduce the
CO2 emissions
Refresh the
national
economic
Target
Use RE technologies
Effects
Causes
The solution effects
New development
projects including
residential, agricultural
and industrial.
Construct new
desalination
plants
Population
growing
Increasing
energy needs
Problem diagram
Study objective diagram
5
1.2. Research Objectives
Main research focuses is given to design a HRES for energy supply in order to overcome
the obstacles facing the current energy system in Libya. It determines the advantages and
potential of using RE technologies in this field.
Further aims and tasks covered in the study are:
Assessing the existing energy supply system (Presented in chapter 2)
Describing Libyan government policy for use and development of RET (Presented in
chapter 2)
Identifying the challenges and opportunities (Presented in chapter 2)
Determining the potential of RE technologies in Libya (Presented in chapter 3)
Determining the viability of RE technologies in the Libyan energy system (Presented in
chapter 6)
What is the outlook in Libya related to use of these technologies at both national and
global level? (Presented in chapter 7)
Which RE technologies are most optimal to implement in Libya districts? (Presented
in chapter 7)
1.3. Thesis Structure
The thesis comprises eight chapters, each covering a defined area related to the main
subject of research. The first chapter introduces the research, including discussion of the
main objective of the study, the problem analysis methodology in order to specify the
causes and effects of the problem, as well as the research methodology and work strategy
procedure. The limitations of the study are within this chapter. Literature reviews of the
research start in chapter two, which includes a country overview and study of the current
situation of the energy system in Libya and the existing energy operating model.
Additionally, the present use of RE technologies and their contribution in energy
generating as well as challenges and opportunities for development of the energy sector in
Libya are described.
6
In chapter three the potential of RET in Libya is presented in order to assess their
feasibility and viability. In this context, an overview is presented the RE resources and
technologies. The resources and technology for each type of RET have been covered
separately with its potential for Libya.
The practical part of the thesis constitutes chapters four, five, and six. The form used is a
case study of electricity supply using HRES in the Brak City region focusing on
implementation of scenarios to use solar and wind energy technologies in the system
design. Chapter four includes assessment of the case study region, selection of the project
site, description of the energy demand of the selected region (i.e. Brak City region) and
determining primary electricity loads required in the system design. Chapter five presents
Brak City HRES model inputs in order to build and configure the required energy system,
which includes specifying the basic system components, system parameters, energy
resources used in the system as well as specifying the cost assumed for system components
and input parameter.
The results analysis and discussion of the case study are presented in chapter six, which
includes key findings of the scenarios. Each scenario is analysed separately, but have the
same methodology in order to ensure comparability.
With Chapter seven is given an outlook for the energy supply system focusing on
prospects for implementing RE technologies in Libya. Moreover, the outlook for
implementing solar and wind energy in the other regions of Libya based on the key
findings of the study on the Brak City region is presented in this chapter. Chapter eight is
the conclusion of this thesis.
1.4. Research Methodology and Workflow Strategy
For solving the research problem and its statements (section 1.1), the case study method
has been selected as the practical research method. Yin describes that if research questions
focus on "how" and "why" it is preferred to use the case study as a research method since
7
“"how" and "why" questions are more explanatory and likely to lead to the use of case
studies, histories, and experiments as the preferred research methods” (2009, p.9).
Denscombe provides further perspective on when to use the case study approach as a
research method as “the case study approach works best when the researcher wants to
investigate an issue in depth and provide an explanation that can cope with the complexity
and subtlety of real life situations” (Denscombe, 2007 p.38).
In accordance with the case study concepts described by Yin and Denscombe, the research
questions and problem addressed within focus on the "how" and the "why"; and the
research deal with real-life problem facing Libyan currently installed energy capacity,
which does not meet present and future development demands of Libyan society. The
workflow and the research strategy is illustrated in Figure 1.2, showing the research
outlines, arrangement and sequence of the literature review and practical part as well as the
working strategy in order to achieve the objectives of the thesis.
Specifically, the case study is designed and conducted here in several scenarios in order to
investigate the problem in depth. The scenarios therefore targeting the same objective and
dealing with the same tasks, but differing in the type of the RE technology used in the
design. For example where in the first scenario the solar energy technology has been used,
and the wind energy technology in the second scenario, both solar and wind energy
technologies have been used in the third scenario (see, the case study protocol and the
scenario, concept details in paragraph 5.1.3, as well as the illustration in Figure 5.1). Each
scenario is designed individually and conducted commensurate with the respective RE
technology. Each scenario has results analysis, discussion, and conclusion presented
individually.
To achieve the case study target, as well as the main objective of this thesis, simulation
software has been used in the design of Brak City HRES, and to configure the energy
systems in each scenario. The software concept and reasons behind selecting this
simulation tool in preference to other tools is discussed and presented in chapter 4. In
conclusion, comparison of the scenario results and key findings gained from this study

8
leads to determining feasible and viable solutions which can implemented to solving the
problem and to overcome the obstacles and challenges currently facing Libya’s energy
system.
Figure 1.2: Research methodology and workflow strategy framework (Source: author)
Introduction
Problem statement.
Research objectives.
Research structure and methodology of work.
Limitations of the study.
Literature reviews
Assessment of current energy system and the present use of RET in Libya.
Potential and possibilities to apply RET in Libya.
Basic theory RE technologies and their resources.
Identify the practical part form and possible scenarios that can be implemented.
Practical part: Case study
Case study approach,
scenarios and strategy.
Case study area selected.
Identifying the potential of
RET in region.
Identify the energy demand
and its prospects.
Identify basic system
components and
hypothetical of models
inputs.
Apply the case study
scenarios
Represent
the outputs
of the
scenarios.
Results analysis and discussion
Scenarios results comparison.
Discussion key Findings of scenarios.
Conclusion
9
1.5. Limitations of the Study
This study is specifically limited in scope to RE technologies application that can be
feasibly implemented in Libya’s energy supply system, which may meet the Libyan
society’s demands, and may sustainably develop this sector. Therefore, the research scope
is limited as follows:
Electricity supply, resources and generations technology in energy system of Libya.
Potential of RE resources and technologies in Libya.
The case study is limited in design of HRES in selected area (Brak City region).
The case study scenarios are limited to use of solar and wind energy technologies in
order to design the HRES in Bark City region.
The HRES is designed to satisfy a minimum energy demand in Brak City only.
The energy demand is identified in prospect of HRES project started in 2017, where the
energy load designed with consideration of growth rate of both population and energy
consumption in Brak City region only.
The basic theory of the simulation tool that has been used in the design and the
knowledge related to this tool (i.e. software tool).

10
2. Present Status of Energy Sector in Libya
2.1. Libya - Country Overview
2.1.1. General Overview
Libya or "State of Libya", as it is officially named11, is located in North Africa and
bordered by the Mediterranean Sea from the north, Chad and Niger to the south, Egypt and
Sudan to the east, and Tunisia and Algeria to the west, as shown in Figure 2.1, representing
the geographical location of the country. Libya covers an area of 1,759,540 square
kilometers (km2) and is the fourth largest country in Africa by area; additionally, it has
1,770 km of coastline along the Mediterranean Sea (Library of Congress, Federal Research
Division, 2005, p.4).
The capital of Libya is Tripoli, which is the largest city and most important commercial
and industrial center in Libya. The population of Libya is 6.3 million where most of
populous live in cities along the Mediterranean coastal areas. Tribal character and culture
drowns out the influence of the other demographics in most of the cities and regions of
Libya; some cities are known for certain tribes because these tribes have inhabited these
areas for a long time.
The climate in Libya is dry with most regions of the country being desert, especially in the
south of Libya where the temperature can reach more than 45 degree Celsius (°C) in the
summer season. In the coastal areas, the climate is characteristic of a Mediterranean
climate, like many other countries located on the Mediterranean Sea. The terrain in Libya is
mostly desert with plains and hills, and mountain chains crossing the county from east to
west. The green mountain chain is in the eastern part of the country, and the other mountain
chain which is known as the western mountain area is in the western part; in the central and
southern regions the landform is almost flat.
11 The current official name of Libya named by the General National Congress (GNC) in January 2013.

11
Figure 2.1: Geographical location of Libya (Source: Wikipedia)12
Libya’s economy is dependent mainly on oil and natural gas reserves, which contribute to
95% of export earnings and 70% of GDP (African Economic Outlook, 2012, p.4).
Furthermore, on a global scale, the Libyan economy is classified by WB as an upper
middle income economy. The small population and the strength of petroleum revenues give
Libya one of the highest per capita GDP in Africa. This demonstrates high satisfaction and
indicates that the Libyan government has many economic benefits from this sector, which
can contribute to the implementation of sustainable development that can further contribute
to economic, environment and society improvements. The other sectors, which include the
agricultural sector, commercial sector, industrial sector, contribute little to the country’s
economy (a mere 3%) and do not meet local demands, thus causing Libya to import 75% to
80% of its food demand (World Food Programme (WFP), 2011, p.12).
Unfortunately, these days the Libyan economy has been affected due to conflicts and civil
war, with the main source of income (i.e., petroleum sector) as well as oil industries being
closed and under control of rebels.
12 Wikipedia website available at: https://en.wikipedia.org/wiki/Libya
12
2.1.2. Political and Administrative System
The political system impacts development in many developing countries like Libya.
Consequently, it is important to understanding the decision-making relationship and the
government policy towards development, especially since the subject of this thesis deals
with a development project that contributes to the national economy. In fact, political
decisions and the policy of the State of Libya related to development projects have had a
significant impact, especially during the last four decades in the absence of participation of
the private sector and activities being limited to the public sector.
Libya has experienced several different political regimes and was previously ruled by
Turkey and Italy for long periods. In 1911, under Italian occupation, the country was
divided into three provinces, Cyrenaica, Tripolitania and Fezzan; it continued its rule until
independence was achieved on 24 December 1951 (WFP, 2011, p.2). Following its
independence, Libya was formed into a monarchical political system under rule of Idris Al
Senosy until 1969 when a military group overthrew the monarchy to declare the beginning
of a new government system that lasted until the 2011, led by Muammar Al Gaddafi. As
the Arab Spring arose in 2011, popular revolution broke out, receiving international
support to topple a dictator who ruled the country for 42 years. Regrettably, this revolution
did not reap the fruit it had hoped, and fighting and civil war still overwhelm some areas in
Libya13. During those years many development projects were hindered due to the unstable
political system as well as the centralization in decision-making related to the development
and investment at both local and international levels.
These days, there are two governments in Libya, a government in the east, which is seated
in Tobruk City and represents the General of the National Parliament (GNP). The
government in the west represents the General National Congress (GNC), situated in
Tripoli city. These circumstances have complicated the situation and Libyan cities have
been divided between supporters of the east government in some cities and supporters of
13 The civil war still present in some area of Libya up to date of published this thesis on December 2016.

13
the west government in other cities, especially in the absence of a constitution that defines
the regime and the structure of the government.
Administratively, the country is divided into 22 municipalities14 (known as Shabiyyat or
Baladiyat in Libya), which in turn are subdivided into zones. Figure 2.2 shows the
administration districts or municipalities of Libya according to 2007 subdivision, which
was issued by General People Congress (GPC)15 (Wikipedia, 2015). At the moment
Libyans are actively seeking to establish a constitution to unite the country and the system
of democratic governance which will lead them to better.
Figure 2.2: The administrative districts system in Libya (Source: Wikipedia)16
14 In this study all assessments and the studies conducted are based on this division because it is the last legal
and official administrative division before the civil war; nowadays there are many other administrative
divisions which are not legally recognized, so, some references mention 32 municipalities and others 35
municipalities.
15 GPC was the legislative government structure in Libya before the revolution of February and the civil war
in 2011.
16 Wikipedia website available at: https://en.wikipedia.org/wiki/Districts_of_Libya accessed on accessed 4th
January 2015.

14
2.1.3. Energy Sector
The energy sector of Libya is state-owned and under full supervision of the Council of
Ministers17, which in turn follows the Libyan government. This sector is run by several
different institutions, each of them specializing in a certain jurisdiction and specific tasks,
as detailed below:
National Oil Corporation: Specializing in the field of oil and gas from extraction to the
production, as well as all construction for the petroleum sector including ports, airports,
buildings and institutions related to this sector.
The Ministry of Electricity and Renewable Energy, which comprises the GECOL and
Renewable Energy Authority of Libya (REAOL). The GECOL was established in 1984
and is responsible for the country’s entire power sector, supplying electrical energy
needs to the total population in Libya. Also, it oversees operation and maintenance of
power grids, power plants, distribution and transmission stations and power lines as
well as maintenance and built constructions of electricity (GECOL, 2015)18 . The
REAOL was established in 2007 in order to promote RE use as well as to integrate
those technologies so as to share in the energy supply system of Libya. In fact, there is
no publications indicate to the achievements of this institute related to RE technologies,
only study indicate to the future strategy to implementations and share of the RE in
Libya and there is no any project established in reality19 (REAOL, 2009, p.9).
17 In the current division in the government system, as discussed in the previous paragraph, the energy sector
not influenced by civil war in administrative, and is still running with the equity of all Libyan society
demands for all regions of the country.
18 GECOL website in Arabic version, available at: https://www.gecol.ly/GECOL_LY/about.aspx Accessed
6th April 2015.
19 Also, the author was participant in the International Renewable Energy Conference and Exhibition that
planed to take place in 8-10.12.2013 at Dati Elimad: Tripoli – Libya. The paper submitted at 11.07.2013 and
accepted at 11.10.2013, and the conference cancelled on 24.11.2013 due to circumstances out of its control.
The conference paper title: Energy Efficiency and Renewable Energy Technologies in Buildings in Libya.
15
2.2. Current Situation of Energy System
2.2.1. Electricity Supply System
Libya, like other countries, has its own power supply system, trying to be commensurate
with its society’s demands. Currently, the electricity supply system covers most regions of
the country, where electricity access is 99% (WB, 2014, p.244). Furthermore, the
electricity network connects and covers all cities and villages in the country, even those
that are located in desert regions or away from power plants. Most of the power plants are
located along coastal areas where a majority of the population lives (Ekhlat, Salah, and
Kreama, 2007, p.4).
Electricity transfer to the regions that are located away from the power plants is conducted
through High-Voltage Direct-Current (HVDC) technology over long distances, which
increases electricity losses in national electric network. However, the process of converting
Direct Current (DC) to Alternating Current (AC), to supply to customers as well as
centralizing the distribution energy system, makes the losses in electricity even greater. In
2014, the losses of electricity in Libya’s network were 12% of the total output, as
compared to global levels in that year (WB, p.204). This is considered as one of several
problems facing the national electric network of Libya at present time.
Figure 2.3 shows the historical data for electricity losses from 2003 to 2013, where Libya
improves its energy efficiency in order to decrease the losses in electricity due to
distribution and transmission inefficiency, especially in 2006, but the losses in electricity is
increased in 2007 to reach the maximum losses rate in 2009. Still this has impact on its
energy portfolio where it is considered to have currently the highest losses in Africa,
according to the study published by WB (2014, p.165), as well as by comparison with
world losses level, as shown in the Figure below.

16
Figure 2.3:
Electric power transmission and distribution losses in Libya in 2003-2013
(Source: WB)20
On international scale, Libya’s electricity network is connected to its neighbors’ sharing
electricity with Egypt and Tunisia in order to meet the peak load demands in the border
region, as well as to export excess loads, but this was not enough to satisfy the needs in
these regions as well as to avoid the electricity outages. However, Libya has agreements to
participant with international countries in a share power supply system known as
DESERTEC. This project aims to establishing a global power system in order to share
energy between Middle East and North Africa countries (MENA) and European countries,
especially in promoting to the share of RE. Unfortunately, this project, like many other
international agreements, has not yet been implemented and has no any of implementations
at present in Libya (the project still planned to implement, but in the reality there is no any
kind of activities related that in Libya, especially with non-stability of political situation
and civil war in Libya in present time, which seems to be canceled to implement).
In summary, the electric network of Libya has vast electricity losses as an effect of the
centralization of energy distribution, especially as it relates to supplying electricity to the
20 WB website. Available at:
http://data.worldbank.org/indicator/EG.ELC.LOSS.ZS?end=2013&locations=LY-
1W&name_desc=false&start=2003 Accessed: 29th June 2016.
0
5
10
15
20
25
2003
2004
2005
2006
2007
2008
2009
2010
2011
2012
2013
Distribution losses in % of output
Year
Electric power transmission and distribution losses: 2003-2013
Libya
World

17
region located at a distance from power plants. The positive thing is that most of the people
have access to electricity.
2.2.2. Energy Sources and Production Technology
At present, most power plants use natural gas their as main source of energy, as shown in
Figure 2.4, which presents the electricity produced source by fuel categories. Electric
power generation in Libya operates through three technologies, gas technology, combined
cycle technology and steam technology, as shown in Figure 2.5, where a majority of power
plants are operated with gas technology that account for 53% of the plants (GECOL, 2012,
p.4). By studying Figure 2.4 and 2.5, which reflect the current sources and technologies for
energy production in Libya it is evident that RE resources have no share in current electric
power generation. Furthermore, there is no consideration to use RE technologies, and the
electricity is produced through non-sustainable sources.
The study issued by WB classified CO2 emissions into four categories in order to assess the
main sources of CO2 emission, including electricity and heat production, manufacturing
industries and constructions, residential and commercial buildings, and transport. In Libya,
the electrical and heat production represented the highest CO2 emissions (i.e., in the energy
sector), which accounts for 62.1% of total pollution, as shown in Figure 2.6 (2014, p.70).
Figure 2.4: Energy production sources of Libya in 2012 (Source: GECOL, 2012, p.4)
61%
21%
9%
9%
Natural Gas
Light Fuel Oil
Heavy Fuel Oil
No Fuel

18
Figure 2.5: Energy production technologies of Libya in 2012 (Source: GECOL, 2012, p.4)
Figure 2.6: Carbon dioxide emission categories of Libya in 2012 (Source: WB, 2014, p.70)
2.2.3. Energy Consumption and Demand
The energy demand in Libya has rapidly increased with population growth, as well as
development projects demands. Furthermore, electricity consumption in Libya is generally
high, whereas the country is considered to be the largest consumer of power in Africa (WB,
2014, p.12). This because of several factors, such as cultural norms and social life
practices, but the most significant reason is the subsidized electricity tariff, as indicated in
the study published by IMF, which concluded that “Subsidies have led to high energy
consumption compared to Libya’s GDP” (2013, p.8). Like other sectors in Libya, the
energy sector is subsidized, where the electricity tariff is considered to be the second least
expensive in the world, where it ranges from 0.015 $/kWh for residential consumers to
53%
37%
10%
Gas
Combined
Cycle
Steam
62.1%
9.4%
5.6%
22.9%
Electricity and heat
production
Manufacturing
industries and
construction
Residential buildings
and commercial and
Transport

19
0.052 $/kWh for public services and commercial consumers, while the generating cost is
equal to 0.20 $/kWh (IMF, 2013, p.7). Therefore, the gaps between the generating cost and
tariff price represents a high subsidy. On the other hand the here intended HRES
development is targeted to signification lower generation cost (see chapter 6).
Figure 2.7 represents the electric power consumption in Libya from 2003 to 2010, where
the energy consumption growth rate increased annually. This Figure is provided to extract
the growth rate from those years, which has been used to specify the increasing demand for
electricity in coming years in Brak City (see, the case study, presented in paragraph 4.3.3).
In summary, the increased demand for energy has led increases in peak loads and black
outs in some cities for several hours, and even several days. This is considered as one of
the biggest challenges facing the energy sector in Libya at present, where a deficit in
energy capacity is driving the Libyan government to take an active role to stem the
problem and minimize the shortage in energy production commensurate with present and
future society demands.
Figure 2.7:
Electric energy consumption per capita of Libya for 8 years (2003-2010)
(Source: GECOL and WB)21
21 Data source for years 2003, 2004, 2005 are from WB database online website available at:
http://data.worldbank.org/indicator/EG.USE.ELEC.KH.PC/countries?display=graph [Accessed:17th June
2014]. Other data is from GECOL reports for 2006 to 2010, page, 3, 6, 2, 4, and 3 respectively.
0
1000
2000
3000
4000
5000
2003
2004
2005
2006
2007
2008
2009
2010
Consumption Per Capita (KWh)
Year
Libya's Electricity Consumption Per Capita: 2003-2010

20
2.3. Present Use of Renewable Energy Technologies in Libya
RE applications have been used in Libya since 1980, when photovoltaic (PV) system were
introduced to provide electricity to microwave repeater stations near Zella City located at a
distance from standard electricity access (Saleh, 2006, p.156). Following this, many PV
technology stand-alone systems have been installed in different places around the country,
especially in the field of communications in repeater stations that are far away from the
connected power. Furthermore, it was used for the purpose of rural electrification, water
pumping and cathodic protection, but the application of these PV stand-alone systems were
only of very small capacity. The applications of this technology on a large-scale system
basis has not been considered and have holds no practical purpose in the country at the
moment.
Wind energy has also been installed in Libya, with capacity of 25 Megawatt (MW) in
Derna City, which is known as the Derna wind farm. This project was not completed and
does not operate or contribute to the electricity system (Saleh, 2006, p.160). The other RE
technologies, such as biomass energy, hydropower energy and geothermal energy, have no
application in Libya, whether on a small- or large-scale.
As a result, solar energy alone has been used in Libya and no consideration has been given
to the use of other RE resources. The application of solar energy was in the form of a PV
stand-alone system on a small-scale, and not on a large-scale of the application. One of the
tasks conducted in the study was to focus on the use of those technologies on a large-scale
basis, as illustrated in the case study in the next chapters. Table 2.1 summarizes the existing
RET applications in Libya and their installed capacity at present time.
Table 2.1:
Existing uses of RE technologies and their installed capacity in Libya22
22 Because of lack of bibliography, where is no data and publications present the RE technologies activities
and the installations in Libya for the last 10 years. Thus, the study available is from 2006 in this area.
RE technologies
Existing applications
Installed capacity
Biomass energy
No applications
Not installed

21
2.4. Development Challenges and Opportunities
2.4.1. Challenges
Libya lacks good electricity infrastructure and the existing electricity system does not meet
the electricity demands for all sectors, industrial, agricultural, commercial or residential.
The current problem for the energy sector is represented in the insufficiency of energy
capacity, which has led to blackouts in most of country’s regions, especially during the
summer when electricity usage is higher triggering more frequent blackouts. To counter
this problem and develop sustainable development of the energy system that is
commensurate with Libya’s demands at both local and international levels there are many
challenges that need to be overcome. These challenges can be summarized as follows:
One of the greatest challenges is the increased demand on electricity, due to population
growth and the growth of demand for electricity to meet the subsequent developmental
projects, including construction, agricultural and industrial projects, etc.
The losses of electricity due to electricity transmission over long distances.
The damages to the energy infrastructure during the period of the revolution23, which
has made some power plants incapable to withstand the electrical load, especially in the
hot weather of summer, which has caused interruption to the electricity supply that can
last for several days in some cities and villages.
23 Again, the revolution period was from February 2011 to October 2011.
Geothermal energy
No applications
Not installed
Hydropower energy
No applications
Not installed
Solar energy
PV system stand-alone
application in the field of
communication, water
pumping, ruler electrification
1525 kilowatt peak (kWp)
(Saleh, 2006, p.158)
Wind energy
Horizontal Axis Wind Turbines
(HAWTs) technology
Projected to provide 25
MW, but is not operational
yet. (Saleh, 2006, p.160)
22
Power generation in non-renewable manners and total dependence on the use of oil and
gas, which create emissions causing environmental effect.
Libya suffers from a lack of adequate water sources, whether groundwater or rainwater,
especially as it relates to drinking water. This serves as a driver for GECOL to install
the new energy capacities required for desalination plants. Consequently, the demand
on energy has increased. In 2010, a total of 86,048 Megawatt-hour (MWh) was used to
desalinate water in desalination plants (GECOL, 2010, p.15).
2.4.2. Opportunities
Presently, possible development opportunities for the energy sector in Libya are as follows:
Upgrade the energy infrastructure and optimize the energy distribution system,
especially in terms of electricity transmission in order to decrease the losses due to the
transmission process of electricity.
Use alternative sources of energy, apply RE technologies and share this technology to
be participant in the energy production. Therefore, the use of such technologies can
change the current situation for the better and lend to less negative environmental
impacts which are being caused by the present energy sources used to generate energy;
RE technology will guide the development of this sector toward sustainability.
Share and partner with the private sector and optimize the investment law, and not limit
energy activities exclusively to the public sector, as it currently is in Libya. Global
experiences indicate that the joint participation of the private and public sectors has led
to active development.
2.5. Conclusion
The literary reviews conducted on the energy sector in Libya in this chapter concluded that
the energy generation method used in the current energy system is not environmentally
friendly, whereas it depends on fossil fuel as its main source of power. Using those
conventional sources has contributed to Libya having the highest CO2 emission in the
region. Alternative energy sources, such as RE technologies, have not been considered and
23
there is no share to use any of these types of technologies in the current energy system;
also, those technologies have not been considered for use in terms of large-scale
application. The only existing application of those technologies represented in the PV
stand-alone system at small capacity, which has been used in communication repeater
stations.
Furthermore, the existing energy production capacity is insufficient to withstand the
increasing peak loads, which continue to cause blackouts in most of the regions of the
country, generally for several hours a day and sometimes for several days. The existing
electricity system does not meet Libyan society’s demand; there is a shortage at present in
the energy capacity, and that shortage is likely to grow in the future.
Thus, this thesis takes an investigatory on the role of RE technologies and their application
on the large-scale in order to contribute in share to overall power production and to
optimize the current energy system of Libya toward sustainable development.
24
3. Potential of Renewable Energy Technologies in Libya
3.1. Potential of Biomass Energy
3.1.1. The Resources and Conversion Techniques
Biomass energy, or bioenergy, has several sources of energy compared to the other types
of RET such as wind energy and solar energy, which are based on one source (i.e., the sun
and wind respectively). This variety in sources of energy makes biomass energy one of the
most frequently used in world, which equates to 1.8% of total global energy produced in
2014 (REN21, 2015a, p.31).
The resources for this kind of energy can defined by considering the meaning of
´biomass´, where Michaelides defines it as that which “encompasses all organic plant
matter as well as organic waste derived from plants, humans, animals, and aquatic or
marine life” (2012, p.288). Another definition clarifies that “Biomass energy is a general
term that refers to the energy that can be derived from plant and animal materials, through
a variety of conversion and end-use processes” (Hall, Barnard and Moss, 1982, p.1).
It may be concluded from these definitions that the biomass resources can be classified into
three categories; plant, animal waste and human waste. These days a variety of feedstock is
related to those categories considered as resources for biomass energy, such as wood,
organic material, crops etc. Consequently, the conversion of these resources to useful
energy may be conducted by many techniques that have been developed in this area.
Wrixon summarizes the methods and conversion techniques of biomass energy resources
into five categories, direct combustion, pyrolysis, gasification, fermentation and digestion
(1980, p.144). These techniques are simplified in Figure 3.1, which represents the
conversion methods for each source for biomass energy, as well as the outputs of the
energy and its end-use. The aim of presenting this figure is to illustrate the process needed
to convert the resource to energy whether in the form of electricity or heating energy.

25
Figure 3.1:
Biomass energy feedstocks with their conversion techniques (Source: adapted
from Wrixon, 1980, p.144)
3.1.2. Potential in Libya
Biomass energy had been used in Libya since 1978; the study shows that 5% of the total
energy was generated from the use of from biomass, which indicates that this kind of
energy has been a part of energy use for several decades (Hall, Barnard and Moss, 1982,
Timber, logging
waste, sawdust,
straw etc.
Timber, waste,
straw, starch crops
including cereal,
Seaweed and algae,
green crop residues
Organic waste,
animal waste and
wood waste.
Sugar crops, starch
crops, wood crops
Animal wastes,
green plant matter.
Direct
combustion
Pyrolysis
Gasification
Fermentation
Degistation
Heating energy
combustion
efficiency.
Charcoal, tars, and
methanol etc.
Gas mixture.
Ethanol- yield varies
with feed-stock and
process
Biogas (methane)
Biomass
resources/feedstock
Conversion method
Output
26
p.18). It was used as energy for cooking and heating, before the oil revolution emerged.
Today there is no consideration for the use of this kind of energy in any area of social life,
whether for individual use or general use; likewise it has no share in energy production
within the country as previously mentioned (in chapter 2).
Another study issued by United Nations Environment Programme (UNEP) on the MENA
region specifies the possibility of the biomass energy use in the area, showing that Libya
has the potential to produce approximately 1.72% of its energy from biomass energy
technologies, such as solid biomass technologies, which includes 0.2% from wood waste
and 1.52% from municipal waste (2007, p.18). Additionally, another study estimated the
possibility that 2% terawatt-hour per year (TWh/yr) could be produced from solid waste
(Saleh, 2006, p.155).
From those studies it may be concluded that there is potential for biomass energy in Libya
and that it is confined to municipal waste source, while other sources, such as wood and
agricultural crops, have no possibility for use. This is related to the unavailability of
sources for energy production, such as agricultural crops and woods; furthermore the
current agriculture production of food does not meet from the primary population
requirements and Libya needs to import about 90% of its food, especially wheat, barley
and other agricultural crops. Furthermore, because Libya is mostly desert, it has less green
land and forest, the less wood to provide as a sustainable source. In conclusion, there is
potential to produce energy by biomass from waste where sources are available. Therefore
biomass energy cannot really contribute to solve Libyans energy problems and will not
included here in developing a HRES.
3.2. Potential of Geothermal Energy
3.2.1. The Resources and Technology
Geothermal energy has been used in different applications in human civilization since
ancient times, and in 1904 the first large-scale application of this technology was set up in
27
Larderello, Italy, where natural steam was used to generate electricity (Berman, 1975, p.3).
Geothermal energy is defined as “ literally the heat of the earth” (Kruger, 2006, p.64).
Like biomass energy, geothermal energy has several sources, each having a specific
technology to convert the sources to a useful form of energy. Bremen expressed that as “the
means by which the geothermal resources are utilized will depend first on the nature of the
resource, that is, whether the fluids obtained from the ground are dry steam or a mixture of
steam and water” (1975, p.230). Another study classified geothermal energy resources into
three categories: hydrothermal convention systems, hot igneous resources and conduction-
dominated resources (Kutz, 2007, p.102). In the same context Kreith and Kreider argues
that “geothermal energy can use the heat in the interior of the earth for electric power
generation, heating of buildings, or as a source of thermal energy for heat pumps” (2011,
p.33). Yet another study stated, “Geothermal energy is derived from the thermal energy
stored within the rock fabric, several kilometers below the earth’s surface” (Doherty and
Harrison, 1995, p.5).
From the aforementioned studies, it may be summarized that geothermal energy sources
include dry steam, heat from the ground, water springs, and hot and dry rocks. Currently,
the technologies that is used to convert these resources into useful energy comprises
geothermal heat pumps (GHPs), direct use applications and enhanced geothermal systems
(EGS). In regards to the hot fluid resources Kruger similarity the technology used to
convert the fossil fuel is the same that is used to convert the hot liquid of geothermal
energy, where he argues that “the technology for the conversion of geothermal fluids into
electric energy is the same as that for fossil fuels; the main difference is in the properties of
the working fluids” (2006, p.165).
Presently, Asian countries, such as Indonesia, Japan and Thailand, utilize geothermal
energy most, where the resources are active, and wherein steam water is considered most
common source of geothermal energy. On a global scale, this technology is considered to
have a small share in total energy produced by RET, which accounts for 0.4% of total use
in 2014 (IRENA, 2015a, p.31). In addition, it is considered to have as expensive levelized
28
cost of energy (LCOE) as compared to other RET, though it is still one of the forms of
renewable and clean energy.
3.2.2. Potential in Libya
The potential for geothermal energy in Libya is theoretically viable, as the resource is
available, where approximately 44 TW of heat power is transferred from the interior to the
surface of the Earth” (Michaelides, 2012, p.257). Therefore, while it is theoretically
possible, with consideration to the main resources of geothermal energy, such as hot or
steam water, dry rock or heat rock and hot igneous resource, these sources are not available
in Libya. The study conducted in that field shows the possibility of 2% geothermal energy
in Libya from ground heat, related to the use of heat technology in buildings complexes or
to heat water (i.e., GHPs technology) (Saleh, 2006, p.129). There are few hot water springs
which are used in health services in Libya and which have not been considered as a source
for RE.
In the same context, a study evaluated that the convective hydrothermal resources, whether
steam or water-dominated, with temperatures ranging from 40 °C to over 60 °C in Libya
(International Energy Agency (IEA), 2011, p.10). From this study it was concluded that the
majority of land has hydrothermal resources that are at less than 50 °C, and a little portion
ranging between 60 °C to 50 °C, which is considered to be less favorable resources as
shown in Figure 3.2.
As a result, geothermal energy resources in Libya are not available, but there is the
possibility to use this kind of energy from the interior heat of the earth theoretically. This
entails the possible use of geothermal energy technology that depends on interior heat
from the earth, such as GHPs, since the source is available. Other resources, such as hot or
dry rocks, spring water and dry steam, have no potential for implementation in Libya
because the lack of availability of such resources. Therefore also geothermal energy is
excluded here for the intended HRES design.

29
Figure 3.2:
Libya with a world resource map of convective hydrothermal resources
(Source: © OECD/IEA, 2011, p.10)24
3.3. Potential of Hydropower Energy
3.3.1. The Resources and Technology
The concept of using the movement of water as a source of energy has been known since
ancient times (Michaelides, 2012, p.314). A simple definition of hydropower energy, or
hydroenergy, is: “Hydroenergy is the energy in moving (falling) water” (Kruger, 2006,
p.140). Like solar and wind energy, this kind of RE has only one resource, water, and
depends on the movement of water to produce power.
Tidal energy and wave energy are forms of hydropower energy which depend on the
movement of water to produce useful energy forms, mainly electricity. Therefore, the
source is water and the convert technologies are different from one to other. Hydropower
energy technologies include hydroelectric dams (known also as conventional hydroelectric)
and run-of-the-river hydroelectricity, in general. Tidal energy technologies and applications
have included tidal stream generator, tidal barrage, dynamic tidal power and tidal lagoon,
24 The source noted in the evaluation Figure to "Convective hydrothermal reservoirs are shown as light grey
areas, including heat flow and tectonic plates boundaries."

30
while the wave energy technologies are hydraulic ram, elastomeric hose pump, pump-to-
shore, hydroelectric turbine, air turbine and linear electrical generator.
In summary, hydropower energy depends mainly on water as its energy source, whereas
the common technologies and applications of this type of RE are dams, tidal and wave
technologies. Currently, hydropower energy is considered to be the most cost effective
form of energy, with LCOE for this energy reaching as low as 0.03 $/kWh in some places
in the world (International Renewable Energy Agency (IRENA), 2015a, p.73). On the other
hand, this type of RE represents 16.6 % of the current total RET production, which
considered the most one procedure (REN21, 2015, p.31).
3.3.2. Potential in Libya
Hydropower energy, like other types of the RET, does not have a share in the power energy
system of Libya; whether by small-scale application or large-scale. Libya has a long coastal
strip along the Mediterranean Sea, which could be considered a resource for hydropower
energy. This resource provides Libya an opportunity to apply hydropower energy
technologies, including dams, tidal energy and wave energy along its Mediterranean coast.
Otherwise, other resources, such as rivers or lakes, are not as readily available due to the
lack of rainfall, to provide an adequate base storage of water in the form of dams. At
present time there are 16 dams that have been constructed and are operational in Libya;
they are operated for irrigation purposes, as well as to supply fresh water to some regions
and there is no consideration to use them for generating electricity (Aqueil, Tindall and
Moran, 2012, p.4).
In term of the potential for tidal and wave energy, the study conducted in that area shows
the average wave energy flux estimated in Libya is from 3.5 to 11 kilowatt meter (kWm)25,
which indicates the great potential for applying wave energy technology (Martinelli,
Pezzutto and Ruol, 2013, p.4499). Furthermore, there is potential to implement tidal
energy; based on the study of the direction and movement of the tide toward beach
25 The wave energy is measured in kilowatt-meter (kWm).

31
(Karathanasi, Soukissian and Sifnioti, 2015, p.4)26. Figure 3.3 represents the potential of
tidal and wave energy that was concluded from this study.
In summary, the resources needed for hydropower energy are available in Libya, along its
Mediterranean coastline. It is considered to be the only resource for this technology and it
can be concluded that there is a good possibility to apply such technology, whether tidal
and wave energy, or in dam applications, for example in combination with desalination
plants. But in general hydropower energy is limited to local solutions (coast line).
Figure 3.3:
Average wave energy flux spent and tidal direction of Libya (Source:
author’s design adapted from Martinelli, Pezzutto and Ruol, 2013, p.4499)
3.4. Potential of Solar Energy
3.4.1. The Resources and Technology
Solar energy has been used for thousands of years, for all sorts of different purposes in the
life. Williams argues that, “sunlight matching the earth can provide our needs for energy
26 The study evaluated the direction of the tidal from 1970 to 2000.
32
without pollution” (1974, p.1). Other simple perspectives state that “solar energy is defined
as that radiant energy transmitted by the sun and intercepted by Earth” (Kutz, 2007, p.13).
Consequently, this type of RE depends on sunlight as its main source of energy, but like
other RET, several types of technologies may be used in order to convert sunlight into
useful energy.
Today there are several technologies that have been developed to take advantage of solar
energy, including PV system, Concentrating Solar Power (CSP) and Solar Water Heating
(SWH). The most widely used in the world are PV systems, which are used in a variety of
applications whether in small systems like in residential uses or in large-scale uses like in
solar farms, which provide for more efficient use of energy. Currently, world-use
comprises 0.9% of the total RET output, with average typical LCOE costing 0.20 $/kWh in
utility-scale of application (IRENA, 2015a, p.31). This is comparable to the energy
generating costs typical for Libya (see paragraph 2.2.3).
3.4.2. Potential in Libya
Not surprisingly is solar energy use in Libya strong, and there is the possibility to
implement such technology and their respective applications. The study issued by Solar
Geographical Information System (Solargis) determined that Global Horizontal Irradiation
(GHI) varies from 1950 kWh/m2/yr. in the coastal region to 2550 kWh/m2/yr. in the south
of Libya, as shown in Figure 3.4. The sunshine averages 6.5 hours a day, and considering
the large area of the country and the simplicity of the landform, it can be concluded that the
factors give Libya a promising opportunity to apply and take advantage of the use of this
technology. In more detail this will be analyzed in the case study (see chapter 6 and 7).
As discussed previously, this type of RET has been used in Libya in small application, and
has not been implemented in large systems. The studies indicates there is a possibility for
140 TWh/yr. that can be produced from the use of solar energy, which is enough to fill the
shortage in Libya’s energy portfolio at the present time (Saleh, 2006, p.155; and also
Martinelli, 2010, p.60).

33
In summary, the potential is high and implementation of solar energy can lead to taking a
role toward sustainable energy and contribute to filling the gap in energy capacity shortage
that Libya faces at present time, and more to be analyzed here in detail.
Figure 3.4: Global horizontal irradiation map of Libya (Source: GHI Solar Map © Solargis)27
3.5. Potential of Wind Energy
3.5.1. The Resources and Technology
Since the earliest ages, wind energy been to sail ships and power windmills to grind grain
or pump water from wells (Michaelides, 2012, p.233). Like solar energy, this type of RE
has only one resource, which is wind. Nowadays, wind energy technology has developed
and there are several applications in use, though wind turbine technology is considered the
most common. Current wind turbines are subcategorized as “modern wind turbines are
classified into two configurations: horizontal-axis wind turbines (HAWTs) and vertical-
27 The solar GIS logo and the titles are retained on the map as requested from the source copyright property
for GeoModel Solar. Solargis website: maps available under Creative Commons Attribution-Share Alike
3.0 Unported License. Available at: http://solargis.info/doc/_pics/freemaps/1000px/ghi/SolarGIS-Solar-
map-Libya-en.png [Accessed:12th May 2015].
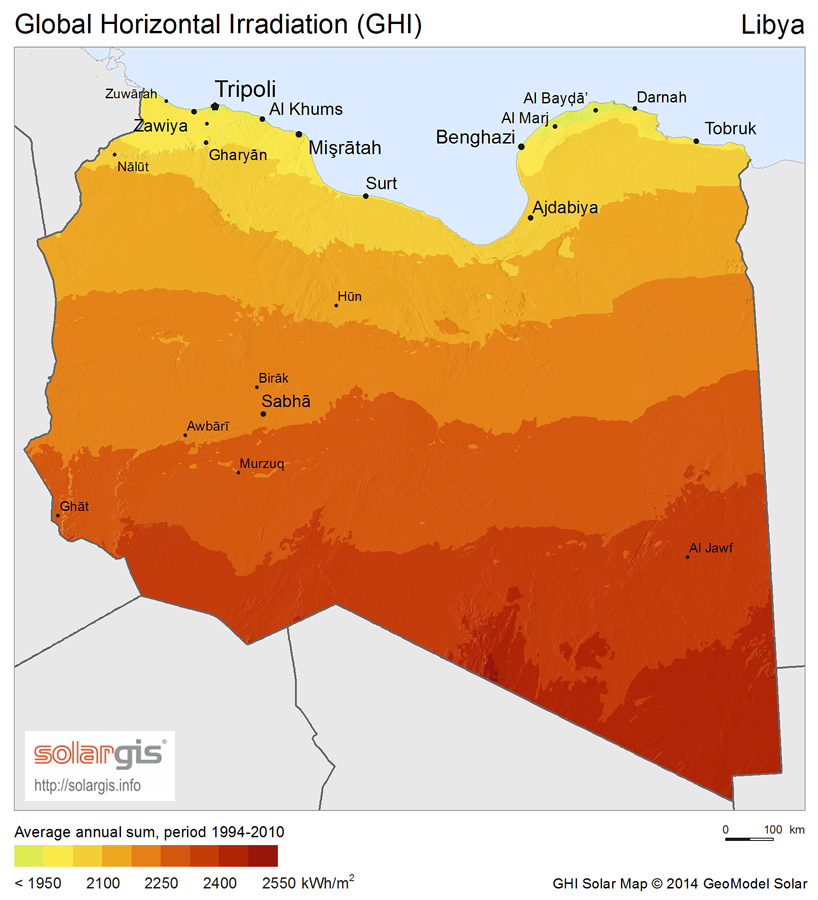

34
axis wind turbines (VAWTs) depending on rotor operation principals” (Jha, 2011, p.2).
These are considered to be the most common technology used at present related to wind
energy.
Wind energy technology has two kinds of the applications, onshore systems and offshore
systems, which are mostly implemented in large-scale applications (i.e., wind farms). Also,
this type of RET has low LCOE, which typically range between 0.045 and 0.14 $/kWh in
onshore wind system and from 0.12 to 0.20 $/kWh in offshore wind system in world-scale
usage (IRENA, 2015a, p.74) and much lower than current energy production costs.
Therefore wind energy owns the potential to avoid energy price subsidies. The present
global production measures 3.1% of total RET output, which is considered small compared
to other RE technologies.
3.5.2. Potential in Libya
Wind energy has considerable potential in Libya, and there is sufficient potentiality to
implement such technology. Moreover, this technology can be use in both onshore and
offshore systems since the Mediterranean Sea provides consistent enough high wind speeds
to support wind offshore energy. Also, there is good potentiality to apply this technology in
onshore system in all regions of the country. Here, see chapter 5 and 6 only onshore
solutions will be analyzed more detailed.
The study shows that average wind speed in Libya is 5 m/s (Kristofferson and Bokalders,
1996, p.273). A subsequent study evaluated the most attractive location to implement wind
energy technology is along the coastal area, in Derna City and Sirt City region in particular,
where wind speeds varying from 6 m/s and 7.5 m/s respectively (Saleh, 2006, p.159).
In this study the average wind speed for all districts of Libya are represented in Figure 3.528
based on data from the surface meteorology and solar energy website provided by National
28 The data obtained online, which are presented the average wind speed of districts for 22 years (1993 -
2005) as provided and supported by NASA. The website of the data is available at:
https://eosweb.larc.nasa.gov/cgibin/sse/homer.cgi?email=skip@larc.nasa.gov [Accessed: 22nd March 2014].

35
Aeronautics and Space Administration (NASA). This data was obtained based on the
latitude and longitude of the district, and determined the average wind speed at height of 10
m, as provided by NASA (see the detailed data in Appendix 1). Because of that, and
despite the different of data from these sources (i.e. Kristofferson and Bokalders, Saleh and
NASA), the data presented in Figure 3.5 has been used in the study, that show the wind
energy potential in each districts of Libya, as well as the region used in the case study
presented in the next chapters.
Figure 3.5: Wind energy potential in Libyan districts
3.6. Conclusion
The study conducted in this chapter shows that Libya has considerable potential for RE
technologies. The implementation of those technologies can lead to greater outputs from
Nr.
Name of
Districts
Average
Wind
speed
(m/s)
1
Butnan
3.9
2
Derna
4.2
3
Jabal al Akhdar
4
4
Marj
5.2
5
Benghazi
5.2
6
Al Wahat
4.0
7
Kufra
4.6
8
Sirte
4.4
9
Misrata
4.2
10
Murqub
4.2
11
Tripoli
4.2
12
Jafara
4.2
13
Zawiya
4.2
14
Nuqat al Khams
4.1
15
Jabal al Gharbi
4.1
16
Nalut
4.1
17
Jufra
4.1
18
Wadi al Shatii
4.2
19
Sabha
4.3
20
Wadi al Hayaa
4.5
21
Ghat
4.4
22
Murzuq
4.5

36
the existing energy system and develop the energy sector in a more sustainable manner.
The key findings for the potentiality of RE technologies are summarized in Table 3.1. As a
result, it can be concluded that in first line solar and wind energy technology offer the
greatest possibilities because of the strength of these resources in Libya.
Table 3.1 Potential of RE technologies in Libya
Type of RE
Potential of resources
Potential of technology implementation
Biomass energy
Waste whether human and solid
Any technology related to waste includes,
gasification, combustion and pyrolysis
technology
Geothermal energy
Heat from the earth (interior heat
of the earth)
GHPs, which depend on interior heat of the
earth
Hydropower energy
Mediterranean Sea is considered
the main resource of hydropower
energy in Libya, with coastal
length of approximately to 1800
km
Dams technology, tidal technology and
wave technology
Solar energy
The average annual GHI in Libya
ranges from 1950 to 2550
kWh/m2, considered a strong
resource for solar energy
technology
PV
CSP
SHW
Wind energy
The average annual wind speed in
Libya ranges from 3.9 to 5.2 m/s,
considered good for wind
technology
HAWTs
VAWTs
37
4. Case Study Methodology and Area
4.1. Case Study Approach
4.1.1. Case Study Objectives
For reasons given in section 4.2 case study focused on design HRES for Brak City to meet
electricity demands in the region and decrease the losses in electricity as well as satisfy the
shortage in electricity that causes for outages that facing the existing electricity supply
system. Libya has no RE technologies in use to generate electricity and there is not any
kind of RE contribution in electricity production in the current system. Therefore, the study
covered Brak City and set out first to explore the possibilities of RET that can be used in
this region. Secondly, the insights gained in the study of implementing RE technologies in
Libya will be scaled to provide recommendations on both local and international levels.
Furthermore, the basic objective of this study is to discern the optimal HRES to satisfy the
energy demands of the study region with consideration to the increasing demand of
electricity, as well as population growth. More clearly, the optimal HRES in the study
entails determining the minimum cost of energy (COE) and most cost-effective system as
well as optimal system type (OST) configuration of each system design to meet electricity
demand in region. To make this determination simulation software has been used in order
to specify the system configuration, components and COE in each design; this software is
illustrated in the next paragraph. With this being the main goal, the delineated objectives
covered in the study were as following:
Finding out the potential of RE technologies in the study region (Presented in this
paragraph 4.2.3).
Determining if this optimal HRES is cost-effective, environmentally-friendly and meets
the electricity demand in region than the currently used fossil fuel based generation of
electricity (Presented in paragraphs 6.1.5, 6.2.5 and 6.3.5).
Conducting a feasibility study on the optimal HRES with different components and
applications, for example, in the case for using solar energy technology in which
38
components and conditions for the system can be optimal (Presented in paragraphs 6.1,
6.2 and 6.3).
Making a comparison between a stand-alone system with a grid extension as it relates
to cost (Presented in paragraphs 6.1.4, 6.2.4 and 6.3.4).
Conducting a comparison of COE gained from the scenarios (Presented in paragraphs
6.4).
Determining which RET is optimal to use in the region: solar, wind or both in one
system (Presented in paragraphs 6.5).
This chapter gives also the regional overview, case study methodology as well as the
estimation of the electric load demand for Brak City HRES. It continues with a short
description of the selected HRES designed software.
4.1.2. Selected Software
There are many software models and tools that have been developed to assess RE and
energy efficiency technologies in a variety of applications. In the study the Hybrid
Optimization of Multiple Energy Resources (HOMER), developed by NREL, was used to
design Brak City HRES (Lambert, Gilman and Lilienthal, 2006, p.379). HOMER was
chosen for the study because it has a variety of components allowing for a number of
combinations to configure the design of a hybrid energy system (HES) in both off-grid and
grid-connected power systems. In addition, the software has several applications of
technologies and technical parameters that make allow it to design energy systems more
accurately as other modeling tools. Furthermore, its resource database, available from
NASA, provide measurements based on site coordinates and climate data such as solar
radiation, wind speed and air temperature which are required in design.
Moreover, HOMER simulates energy consumption and production for each hour of the
year and matches the RE production that is possible based on the available renewable
sources in the site.

39
Software is categorized in three processes: simulation, optimization and sensitivity
analysis. In the simulation process, HOMER simulates and calculates for selected system
configuration (sensitivities) in each time step of the year in order to determine technical
feasibility as well as their net present cost (NPC). NPC are the total life cycle costs of the
HRES for investment, operation, maintenance, replacement and included salvage values.
Regarding the optimization process, HOMER simulates the entire energy system design
with different system configurations in order to determine the optimal system that satisfies
the technical constraints at the NPC. In the sensitivity analysis process, HOMER considers
optimizations based on the variables that are assumed in the design and measures the effect
of these variables on system configurations, as well as the changes that occur due to inputs
of these variables. Figure 4.1 shows the concept of the software processes and the their
relationship, while the license for using this software is presented in Appendix 530 .
Lambert, Gilman and Lilienthal explained the relationship between HOMER processes
based on this Figure as “the optimization oval encloses the simulation oval to represent the
fact that a single optimization consists of multiple simulations. Similarly, the sensitivity
analysis oval encompasses the optimization oval because a single sensitivity analysis
consists of multiple optimizations” (2006, p.380).
It’s a pity that beside this advantages must be mentioned that HOMER software system is
not able to calculate and determine the real cost optimal system. The size of all HRES
components must be pre-selected. HOMER is than calculating only for all possible
combinations of these pre-selected components, the energy generation costs. Identified is
than only the cost optimal solution of these component sizes and not in which way
derivations of these pre-selected component sizes lead to further cost reductions.
30 The license is for legal use as well as property right from HOMER Energy.

40
Figure 4.1: Conceptual representation of the software process (Source: HOMER energy)31
4.1.3. Case Study Scenarios
This case study was considered within three scenarios; each scenario deals with a certain
type of RET with different components and combinations. The first scenario focused on
design HES with solar energy technology based on the solar resource in the project site.
For the second scenario, the wind energy technology in the design was used based on wind
resource in the project site. In third scenario, both solar and wind technologies are used in
the design of system. All scenarios examine the feasibility of build and created stand-alone
system and grid-connected system, as well as compare the stand-alone system to grid
extension. Thus, each scenario will be considered in three categories of design in order to
determine lower COE to allow for a clear comparison between those categories in COE,
electricity losses, electricity shortage and RE share percentage in the project. Therefore, the
scenarios are different in the RE type that is used as well as configuration system, but are
similar in methodology of design. For this reason, the same equipment is used in all
scenarios related to systems configuration and their components, such as diesel generator
(DG), battery, inverter and grid utilities; they are consistent in sizes and cost in order to
make the study more accuracy (for more details see chapter 5). Yin develops roles of case
study processes which are known as case study protocol to support the idea that “the
protocol is a major way of increasing the reliability of case study research and is intended
to guide the investigator in carrying out the data collection from a single case (again, even
if the single case is one of several in a multiple-case study)” (2009, p.79). Consequently,
31 HOMER energy website, online available at: http://www.homerenergy.com/software.html
Accessed:12thApril 214.

41
the case study has been conducted using specific protocol in order to simplify the workflow
methodology and clarify the stages as well as the scenarios concept as shown in Figure 4.2
below.
Figure 4.2: Case study protocol and methodology (Source: author)
Case study details
Concept and objectives.
Methodology and software used.
Scenarios.
Case study area analysis
Selected study area.
Assessment the potential of RET in region.
Identify the energy demand and its prospects.
Select project site and assessment.
Specify the basic system components and hypotheses of model inputs
Identify system components and their sizes.
Evaluate and estimate the components cost.
Specify energy resource and system parameters.
Apply the scenarios and data simulations
Design HRES for electricity supply with preselected component sizes only
Scenario I: Using solar
technology
Solar stand-alone
system.
Solar grid-connected
system.
Grid extension.
Scenario II: Using wind
technology
Wind stand-alone
system.
Wind grid-
connected system.
Grid extension.
Scenario III: Using solar
and wind technology
Solar and wind stand-
alone system.
Solar and wind grid-
connected system.
Grid extension.
Scenarios results assessment and comparison
Summary of findings
Key findings of scenarios.
Extracting the criteria that can be applied and used in other regions of Libya.
Scenario results analysis
and discussion
Results analysis.
Conclusion.
Scenario results analysis
and discussion
Results analysis.
Conclusion.
Scenario results analysis
and discussion
Results analysis.
Conclusion.
Define and design
Prepare , collect ion and analysis
Analysis and
conclude

42
4.2. Case Study Area
4.2.1. Brak City Overview
The Wadi Al Shatii or Ash Shati is a municipality consisting of a chain of villages, which
is home to a population of 82,505. These villages are located beside the main road within
the region, where Brak is the biggest town in both population and area, and serves as the
administrative city in the municipality, hence earning the designation as Brak City. For
this reason the study area is referred to as Brak City instead of Wadi Al Shati municipality.
Brak City is located in the south west of Libya, as shown in the map in Figure 4.3 below,
bordered on the north by the municipalities Nalut and Jabal Al Gharbi, in the south by the
municipalities of Sabha, Wadi Al Hayaat and Ghat, while the Illizi Province of Algeria is
to the west and the municipality of Jufrah is to the east. The area of the municipality is
97,160 km2 (Wikipedia, 2013)32, and once was within the province of Fezzan during the
Italian referee (1911-1964). The region consists of semi-desert with desert and is very hot
in summer and cold in winter; temperatures reach 45°C in the summer and 3°C in winter;
on very rare occasions there is snowfall.
The Brak City area is characterized by an abundance of fresh groundwater, which
encouraged the Libyan government to develop grand agricultural projects for the
production of wheat and barley in the region in order to satisfy the needs. In addition, the
area is home to the largest industrial project to supply Libya's coastal areas and cities with
fresh water for drinking, known as MMRP, in order to alleviate the shortage in those
regions. As the area is rich in iron ore and magnesium, the Libyan government has
considered making it one of the major industrial zones in Libya in the future, but this is still
in planning phases and has yet developed to this day.
32 Wikipedia website, online available at: https://en.wikipedia.org/wiki/Wadi_al_Shatii_District#cite_ref-1
Accessed: 7th December, 2013.

43
All these elements were factors for considering and selecting Brak City to conduct a case
study on the design of an electricity supply system for using RE technologies as a way to
create a potential project that meets future needs of region.
Figure 4.3: Libya map with Wadi Al Shati district and Brak city location (Source: author's
design adapted from Wikipedia: https://en.wikipedia.org/wiki/Brak,_Libya)
4.2.2. Current Situation of Electricity System
Another consideration is a fundamental and important reason represented in the constant
power outages during the summer period and the region's dependence on power plants of
west Tripoli. In other words, the lack of a local power plant in the region creates a
perpetual dependency on the electricity coming from the main stations in the west of
Tripoli. Furthermore, the shortage in Libya’s electricity capacity in present time makes this
situation more critical since the blackouts can remain for days.
The current electricity system of Brak City is dependent on imported electricity
from Tripoli west station through high voltage electricity lines, which transmit the current
to the main electric station of the region. Besides that, the diesel turbines generator is
used to generate the electricity to satisfy the region demands by supplying electricity
to sub-

44
stations in the region where it is further disseminated to customers. This means Brak City
depends on conventional electricity turbines, as well the electricity produced from the
central station that coming from coastal area, which entails a currency transfer that is long
in distance. But this is not only the sole problem facing the current electricity system in
area and not the only this reason behind establishing the RE system in Brak City; there are
many problems with the current electrical system and impediments to its development,
which can be indicated as follows:
High losses in electricity due to long distance transmission, as well as losses due to
converting the electricity from high voltage to alternating current several times from
main station to sub-station to end use.
Shortage in the demands due to peak loads, especially in summer when the climate is
warm and temperatures high.
The current generating system is environmentally unfriendly, wherein electricity is
generation by traditional methods using fuel, which creates high pollution (i.e., the use
of diesel turbines to generate the electricity).
To know the advantage of use RET instead the conventional system in region to
overcome the current system problems as well meeting the future demands of
electricity.
4.2.3. Potential of Renewable Energy in Region
From the discussion presented in chapter 3, that illustrated the potential of RE resources
and technologies as well as the possibilities to implemented in Libya in general. This
section concentrated on discovering the RE technologies potential and possible use in Brak
City region as illustrated in Table 4.1.
Table 4.1: Possibilities of RE in Brak City region
Type of RE
Possibilities in region and discussion
Finding
Biomass energy
There are no forests in the region since the climate is
typical desert, in addition to the lack of annual rainfall.
While there are several agricultural projects to produce
There is no possibility to
use biomass because the
energy resource is

45
grains, such as corn, wheat and barley, to cover part of
the needs of the region and Libya in general. Thus, this
type of RE cannot be used because the resource is
unavailable and lacks potential.
unavailable.
Geothermal energy
There are no hot water springs in the area nor any
volcanic activity, which is considered the main source
of energy; also, studies on geothermal in the region do
not exist. However, as indicated by international
studies, scientifically the heat in the ground and
increases with depth and the region's environment
offers a possibility for making use of this type of RE,
still there is a main obstacle facing this source is cost.
The energy resource is
available but the
possibility to use this
type of RE is very low
because of cost. Thus,
this kind is not
considered for use in the
area.
Hydropower energy
There is no possibility to use this kind of RE because
the region is located in the Sahara area, where there
are no rivers or water lakes, which are considered as
the main source to hydropower.
There is no possibility to
use hydropower because
the energy resource is
unavailable.
Solar energy
The potential for solar energy is considered to be high
in the area, where the average annual solar radiation
varying from 2175 kWh/m2 to 2250 kWh/m2 in the
region as shown previously in chapter 3 (see Figure
3.4). Therefore, applying this kind of RE in the region
is very possible and offers high potentials.
There are a high potential
for using this type where
solar resources are
available with high
capacity.
Wind energy
The average wind speed in the region is 4.2 m/s, which
is considered mid-level. Therefore, the wind energy in
the area is available as a source and type of RE.
There is possibility to use
this type of RE, where
wind resource is
available.
4.3. Design Electricity Demands for Brak City
4.3.1. Methodology of Design the Demand Load
Figure 4.4 shows the calculation methodology and steps that were applied in order to
determine the electricity demand load required to design the Brak City HRES.

46
Figure 4.4:
Calculate steps for the primary electrical load of Brak City HRES need
(Source: author)
4.3.2. Determine the Growth Rate of Population
The population growth rate was calculated in order to assess the increasing population in
the region and find out the system electrical load capacity for the next years as devised in
the future plan of the project.
According to findings33, the average population growth rate in Libya for 10 years (2003-
2012) was calculated and illustrated in more detail in Appendix 2 paragraph 1. The result
of this calculation is represented in Figure 4.5, showing that population growth increased
through those years in general, while the growth rate decreases as a percentage. As a result
the value 1.4%, which represents the average growth rate in these 10 years, has been used
to determine the future of electricity loads commensurate with the population increase.
33 No values available for Brak City region.
Determine the growth rate
of population
Determine the growth rate
for electricity consumption
per capita
Assessment the electricity load demand according to increasing rate
of both population and electricity consumption
Distributing the load based on ratio of each:
Monthly energy load ratio
24-hour energy load ratio
Determine 8760-hour load needed to design of Brak
City HRES.
Step I
Step II
Step III
Step IV

47
Figure 4.5:
Population growth rate of Libya from 2003-2012 that been used to assess the
growing population in Brak City in order to specify the increasing electricity
demand in coming years in the region (Source: WB)34
4.3.3. Determine the Growth Rate for Electricity Consumption
The electricity consumption per capita in Libya is increasing annually compared to
neighboring countries where it is the highest consumption per capita in electricity within
MENA countries. As discussed previously in Chapter 2, where the study on electricity
consumption per capita for 8 years was represented (see Figure 2.7, electricity consumption
in Libya from 2003-2010) in order to assess the prospect of energy demand in Libya. In
this context, the growth rate in electricity consumption per capita was considered in the
design of Brak City HRES, where the average growth rate for those 8 years was calculated.
The reason this value was calculated was to determine the yearly electricity consumption
per capita in the next years with consideration to the growth rate of consumption in order to
specify the system power capacity, or output capacity.
The result is represented in Figure 4.6, which shows that the growth rate rises up and down
with varying of years, where the average growth rate is 6.3% as detailed in Appendix 2,
34 WB website, online available at:
http://data.worldbank.org/indicator/SP.POP.GROW/countries/LY?display=graph Accessed: 28th November,
2012.
0.00
0.50
1.00
1.50
2.00
2003
2004
2005
2006
2007
2008
2009
2010
2011
2012
Growth Rate (%)
Year
Libya's Population Growth Rate: 2003-2012

48
paragraph 2. In the study, a growth rate value of 2% was used in the design of Brak City
HRES because Brak City is located in a rural region and energy consumption can be less
there than in urban regions. Also other argument for the selection of this rate value is that
the typical growth rate in developing countries ranges from 2% to 4% (Berrie, 1992, p.7),
which can exemplify the reduced consumption in Libya when there are no subsidies for the
energy sector, and COE becomes expensive compared to the current situation.
Figure 4.6:
Electricity consumption per capita growth rate of Libya from 2003 to 2010 that
been used to specify the increasing electricity rate required in the design of
Brak City HRES (Source: author)
Table 4.2 shows the result of estimating the electricity load system and the expected loads
and estimated a minimum load Brak City HRES that has been used in a software
simulation process, while the calculation details for expected loads in 2017 year are
discussed in Appendix 2 (paragraph 3, 4 and 5). The estimated load is determined with
consideration of the growth rate of both population and electricity consumption of Libya
only (represented in Figure 4.5 and Figure 5.5). The other considerations such as losses
ratio as well as expected growth rate in electricity shortage not included in the study,
because the load designed to satisfy the minimum requirements of Brak City HRES.
0.0
2.0
4.0
6.0
8.0
10.0
12.0
14.0
2003
2004
2005
2006
2007
2008
2009
2010
Growth Rate (%)
Year
Libya's Electricity Consumption Per Capita Growth Rate:
2003-2010

49
Table 4.2: Estimation of minimum load in design of Brak City HRES35
Descriptions
Values
The expected populations for Brak city in 2017, the first operational
year (beginning of the project) of the Brak city HRES.
88,444 in population
The expected annual average of electricity consumption per capita
at the start of the project in 2017 (see Appendix2, paragraph 3)36
5,355 kWh/ann./capita
The annual energy demand to meet the electricity needs of Brak
city in 2017 required by the system (the load for the system design).
473,617,620 kWh/year
The average monthly energy demand of Brak city HRES that needs
to satisfy the monthly electricity demand for Brak City.
39,468,135 kWh/monthly
The average daily energy demand of Brak City HRES.
1,297,583 kWh/day
The average hourly load demand of Brak City HRES.
54,066 kW
4.3.4. Determine the Electricity Load Ratio
4.3.4.1. Monthly Load Ratio
Several studies were conducted on monthly electricity loads in Libya by GECOL in order
to define the peak load as well as loads consumption in each month (GECOL report in
2007, 2008, 2009, 2010 and 2012). By studying these reports and comparing the electrical
load curves in those years, when the study was conducted, concluded that the load curve
and load demands are semi equal in these years. For example, by comparing between load
demand curves in January of 2007 with the load demand curve in 2008 find that the loads
look to be in the same frequency and only different in electricity consumption amount,
which is increased yearly by increasing the demands on electricity.
35 The load values represented in this table are in kW because the software (i.e. HOMER) supports only the
load in unit of kW, which means it must load values entered in this unit.
36 This is in the step II (see Figure 4.4) assessment load, which is still based on the consumption value of
2010 take from Figure 2.7. This 2010 consumption is influenced by subsidies and because of shortages and
blackouts it is know as being not enough. Therefore these 5,355 kWh per annum and capita is not the “real”
demand. It is seen here as a minimum requirement only, as requirements level people of Libya used.
Therefore the intention to design a HRES is to scene a minimal demand level only.
50
Therefore, in this study the monthly load curve of 2012 has been used, which corresponds
to the last study issued by GECOL with consideration to the load increase demand on
electricity as well as population growth. The monthly load curve in Figure 4.7 represents
the electricity consumption for the Libyan network for all consumer sectors, including the
industrial sector, commercial sector, agricultural sector, public utilities and residential
sector. In this context, the calculations in the study for monthly load curve and the load
frequency in each month were taken based on the average load curve for all these sectors
(i.e. all network loads).
It can be seen from the average load curve that the load in the beginning of January started
to decrease and continuously decrease until April when the lowest load was registered in
the year. Thereafter, the load increased at the end of April and continued rising until
August when there is peak load, which shows that the highest electricity consumption were
in August and July respectively. At the end of August, the load starts to decline in
September and October, being further cut down in November and continue to rise again in
December.
But can the energy load ratio vary in the coming years? And can the energy demand
intensity of each month change from the current situation? Also one cannot take the values
of these monthly energy loads because they represent the monthly energy loads for the year
2012, which cannot be similar in the coming years because energy demands are increasing
annually. Because of that, the solution was in determining the monthly energy ratio based
on the value of the average energy load recorded in that year (i.e. 2012) in order to extract
energy ratio of each month to distribution the energy as ratios as illustrated in detailed
calculations in Appendix 2 (Table paragraph 4). Accordingly, these energy ratios were used
in the study to find energy demand expected in the coming years and that are required in
the design for Brak City HRES as represented in Figure 4.8.

51
Figure 4.7:
Monthly load curve of Libya’s electricity network 2012 that used in design in
order to determine the load ratio in each month for Brak City HRES, where the
load ratio extracted is based on the average load values. (Source: GECOL,
2012, p.4)
Figure 4.8:
Monthly energy ratio used in the design of Brak City HRES, which is
determined based on average monthly load values of Libya’s electricity
network in 2012 (Source: author)
0
1,000
2,000
3,000
4,000
5,000
6,000
7,000
Jan
Feb
Mar
Apr
May
Jun
Jul
Aug
Sep
Oct
Nov
Dec
Load (MW)
Month
Monthly Load Curve of Libya
Max.
Load
Ave.
Load
Min.
Load
0.00
2.00
4.00
6.00
8.00
10.00
12.00
Jan
Feb
Mar
Apr
May
Jun
Jul
Aug
Sep
Oct
Nov
Dec
Energe Ratio (%)
Month
Monthly Distribution Energy Percentage Curve
52
4.3.4.2. Daily Load Ratio
The daily loads are important elements to build any energy system so as to identify the load
frequency during a 24-hour period. In Libya, there are very few studies published about the
hourly measured load and from which can be assess the daily load frequency and hourly
peak load (to know the loads variation from hour to hour due to different demanded day-
time activities). The study issued by GECOL in 2008 on the daily load curve shows that, in
general, there are high differences in a 24-hour load curve in that specific year.
Therefore, in the study the average daily load curve for Libya's 2008 electricity network
used in the design of Brak City HRES is represented in Figure 4.9, where the calculations
of load ratio were based on the values of average curve. Thus, the method used to
determine the daily energy ratio that is based on the average load value registered in that
day is the same as the method used to determine the monthly energy ratio as illustrated in
detail in Appendix 2, paragraph 5. Consequently, these energy ratios were used in the study
to find daily loads expected in the subsequent years and as required in the design of Brak
City HRES. The results of this calculation are represented in Figure 4.10, where as shown
the loads begin to decline gradually due to decrease of electricity consumption between one
o'clock and five o'clock 1:00 and 5:00, the period for the lowest load during day.
Thereafter, the loads start to climb at 6:00 when the demand for electricity increases until
21:00, when the maximum load occurs in the day and then declines during the remaining
hours of the day.
Therefore, these are the daily energy ratios used in the study, but these loads are constant
daily for each day in the month, which means that the load ratio in the first day of month is
similar to last day in the month in value. For example, the 24-hour load value on the 1st of
January is the same load value in the 24-hour period on the 31st of January, as with other
months of the year.

53
Figure 4.9:
Daily load curve of Libya’s electricity network in 2008 that was used in the
design in order to determine the load ratio in each hour of the day for Brak
City HRES, where the load ratio was extracted based on average daily load
values (Source: GECOL 2008, p.6)
Figure 4.10:
Daily energy ratio used in the design of Brak City HRES, which is determined
based on average daily load values of Libya’s electricity network in 2008
(Source: author)
0
500
1,000
1,500
2,000
2,500
3,000
3,500
4,000
4,500
5,000
1
2
3
4
5
6
7
8
9
10
11
12
13
14
15
16
17
18
19
20
21
22
23
24
Load (MW)
Hour
Daily Load Curve of Libya
Max.
Load
Ave.
Load
Min.
Load
0.00
1.00
2.00
3.00
4.00
5.00
6.00
1
2
3
4
5
6
7
8
9
10
11
12
13
14
15
16
17
18
19
20
21
22
23
24
Energy Ratio (%)
Hour
Daily Distribution Energy Percentage Curve

54
4.3.5. Distributing the Load Based on Ratio
Furthermore, in this study the daily load is assumed to be equal for all month days, which
means that the load in 1st day of January is the same load value in last day of January, as it
is in other months, while the monthly load is different in January than it is in December.
This assumption is necessary because no data about seasonal profiles a day-to-day
variations are available. Figure 4.11 represents the near assumed monthly loads
requirements, while Figure 4.12 depicts the daily load curve for each month according to
hourly energy ratios.
Figure 4.11:
Monthly load outlook of Brak City in 2017 used in the design of Brak City
HRES that was designed based on Libya’s monthly electricity load ratio
network in 2012 with consideration of expected monthly energy demand in
the region (Source: author)
0
10,000
20,000
30,000
40,000
50,000
60,000
Jan
Feb
Mar
Apr
May
Jun
Jul
Aug
Sep
Oct
Nov
Dec
Load (KW)
Month
Monthly Load Curve for Brak City

55
Figure 4.12:
Daily load outlooks in each month for Brak City in 2017 used in the design of
Brak City HRES that was designed based on daily load ratios of Libya’s
electricity network in 2008 with consideration to expected daily energy
demand in the region (Source: author)
4.4. Project Site Selection
Site selection for establishing the RE system must be based on various fundamental factors,
such as natural resource, climate, type of RET, accessibility to public utilities and
surrounding area of potential sites. These elements are complementary to each other, for
example, RE sources may be available at a site, but the nature of the climate shift between
implementation of these technologies. In particular, a desert climate where dust is
prevalent, like in the Brak City region, can be a hindrance. Therefore, in the study these
elements have been considered in order to specify a suitable place to construct the Brak
City HRES.
To achieve that, the project site was selected based on selections criteria, which are related
to region requirements needed to select a suitable project location appropriate for current
and future demands of the region. At first, the Brak City area was portioned into three
zones to explore all areas and make carefully decisions related to the selection of an
appropriate site on which to build the Brak City HRES, as shown in Figure 4.13a. For this
reason, zone A is located away from building complexes, the national electricity network
0
10
20
30
40
50
60
70
80
90
1
2
3
4
5
6
7
8
9
10
11
12
13
14
15
16
17
18
19
20
21
22
23
24
Load (MW)
Hour
Daily Load Curve for Brak City
Jan
Feb
Mar
Apr
May
Jun
Jul
Aug
Sep
Oct
Nov
Dec

56
as well as difficult landforms, thus is not beneficial to establish the project in this zone.
With respect to zone B, it is also semi-useful because the landform mostly consists of sand
and sand dunes which makes construction of an RE system difficult, if not almost
impossible, and uneconomically sound because of the impact the sand and dust will have
on RE technologies, whether solar or wind energy. Zone C is more suitable for building the
Brak City HRES because it consists of villages and residential areas, as well as local and
national electricity grid and roads located inside this zone, that are developing
economically and socially in comparison to other regions. Consequently, zone C was
selected for the construction of the Brak City HRES project because it is more suitable than
the other zones.
To conducting the study with widely feasibility, seven locations were selected to establish
the project upon, which cover zone C as shown in Figure 4.13b. Thus, the selections
criteria were applied to assess a suitable project location.
The selections criteria and a discussion of their assessment are represented in Table 4.3,
where location 2 (i.e., L2 on the map) was identified as the final selected location because
it satisfied the criteria more suitably compared to the other locations. The assessment score
was between 1 and 5, whereas 1 was considered as the most satisfactory and 5 was the least
satisfactory. In regards to solar radiation and wind speed data, they are approximately equal
in the locations, as defined by a RE website developed by NASA (2013)37, where the
measurement was based on 22 years of historical data between 1983-2005 (the RE
resources of the locations are represented in Appendix 3)
37 NASA Surface Meteorology and Solar Energy website, online. Available at:
https://eosweb.larc.nasa.gov/sse/RETScreen/ [Accessed: 05th August 2013].

57
Map keys
The administrative division border of the Wadi Al Shatii
municipality according to Libya government division in 2007.
The zones border for the Wadi Al Shatii municipality made by the
author in order to discover the RE technologies that were possible in
the region in detail.
Figure 4.13a:
Satellite map of Wadi Al Shatii municipality and Brak City region with
detailed zones (Source: Google)38
38 Google website, online. Available at:

58
Map keys
High voltage transmission lines
The main electricity station of Wadi Al Shati municipality
Selected locations to construct the Brak city HRES
Location of the villages and residential complexes of Wadi Al
Shatii municipality.
Figure 4.13b: Satellite detailed map of zone C with selected project locations
https://www.google.de/maps/search/Wadi+Al+Shati+municipality/ [Accessed: 26th February 2015].

59
Table 4.3: Locations assessments and selection of the project site
Selections
criteria /
indicators
Discussion
Locations assessment.
Location
winner
L1
L2
L3
L4
L5
L6
L7
Access to
electricity lines
grid.
To what extent after
power lines, both local
and national, where the
cost will be less, and
the distance less
between the station and
the electricity
distribution lines.
3
2
3
3
4
4
3
L2
Access to energy
station in region.
To what extent after
power lines, both local
and national, where the
cost will be less, and
the distance less
between the station and
the electricity
distribution lines.
3
1
3
3
4
4
4
L2
Surrounding area
activities.
What are the other
actors that can provide
electricity in case there
is a surplus in
production, and are
intended to other
sectors such as
agriculture and
industry.
3
1
3
4
3
4
4
L2
Population
density
Where is the most
densely populated areas
in the region.
4
1
3
4
4
3
3
L2
Solar radiation.
Annual average solar
radiation in the
location, as irradiation
is high the productivity
will increase.
1
5.7
1
5.7
1
5.7
1
5.7
1
5.86
1
5.86
1
5.86
All
Wind speed.
Annual wind speed in
the location that refers
to production capacity,
whereas high speed
yields productivity
increases.
1
4.3
1
4.3
1
4.3
1
4.3
1
4.3
1
4.3
1
4.3
All
Landform.
Landform type consists
of mounts, sand dune or
rocks, which are
important in terms of
construction and
installation of the
system components.
2
2
3
3
4
4
3
L1 & L2

60
Temperature.
Ambient temperature in
the location, where the
high temperature will
have an effect on
production efficiency,
especially in solar
energy.
1
22.3
1
22.3
1
22.3
1
22.3
1
22.2
1
22.2
1
22.2
All
In summary, location 2 has been choose to establish the Brak City HRES, which is shown
in Figure 4.14 represented by the satellite map of the selected location. The other
parameters, which are considered in the design of Brak City HRES, such as the natural
resource data, site coordinates and climate required to simulate HOMER are shown in
Table 4.4.
Figure 4.14:
Satellite map for the selected location (L2) of the Brak City HRES39
(Source: Google map)40
39 Note that all details on the map of Figures 4.14 and 14.15 are not to scale, where the project locations,
villages locations and the national electricity line network are presented on the map in approximation to their
real location, as estimated by Google Earth.

61
Table 4.4: Details and characteristics of the site for the Brak City HRES
4.5. Conclusion
The study conducted in this chapter and upon the selected case study area shows that there
is considerable potential for solar and wind energy in the region. The other RE
technologies, such as biomass energy, geothermal energy and hydropower energy, are not
readily available in the region, despite that geothermal energy can be implemented
theoretically in technologies based on the interior heat of the earth, such as GHPs
technology. Also, like other districts of Libya, RET has not been used in the region and
presents an energy system that depends entirely on fossil fuel to generate electricity.
Consequently, solar energy represented in PV technology and wind energy represented in
HAWTs technology will be used in the design for Brak City HRES. Brak City was selected
as a case study area in order to design HRES specifically for this region and to discover the
advantages and roles for using RET in this region, as well as to consider and scale the key
findings of this study for other regions of Libya. As discussed earlier in this chapter, there
were many reasons for selecting Brak City for HRES design (see paragraph 4.2.1.).
40 Satellite map for Brak City HRES taken by Google Earth, online. Available at:
https://www.google.de/maps/search/Wadi+Al+Shati+municipality/@27.708171,14.3140971,12z/ [Accessed:
3rd March 2015].
Item
Description
Place of project
North of Brak City (30 km from town center)
Measurement date
05.08.2013
Coordinates of the place
Latitude 27°41'13" North, Longitude 14°16'22" East.
Landform
Land almost flat
Annual average daily radiation
5.7 kWh/m2/d
Annual average daily wind speed
4.3 m/s

62
5. Brak City Hybrid Renewable Energy System Components and Assumptions of
Models Inputs
5.1. Primary Electrical Load of System
Figure 5.1a gives an impression which general system data input is necessary. The load
demands for the Brak City HRES have been entered, as previously designed and
determined (in paragraph 4.3). The load type specified as AC load. The designed loads are
set identical for all days of a month (as illustrated in paragraph 4.3.6). The reason for the
decision to indicate the all as weekdays and set the random variability to zero, is the as
mentioned in paragraph 4.3.6, the missing of a database from which seriously such
difference between weekday and weekend day respectively such variation percentages can
be estimated.
After entering these values, the system is calculating load curves and monthly load curve
(see Figures 5.1b and 5.1c). It can be seen that these calculated load profiles are identical
with the in chapter 4 (see Figure 4.11 and 4.12) developed load profiles.
Figure 5.1a: Primary electrical load for Brak City HRES

63
Figure 5.1b:
Monthly load profile for the Brak City HRES (indicated as sessional
profile in Figure 5.1a)
Figure 5.1c:
Daily load profile of each month for the Brak City HRES calculated by the
software
64
5.2. Data Selection for the Major Components of the Hybrid Renewable Energy
System
5.2.1. Photovoltaic Panel
The price of PV modules and their installation cost is expensive compared to conventional
electricity devices such as diesel generators. Especially additional components such as a
tracking system, monitoring and controlling system which must be adjusted to the kind of
PV panels and their efficiency, make the installation of PV solar panel expensive (IRENA,
2012d, p.19-20). Based on that, the selection of the appropriate technologies of the PV
module is a key element managing the cost of the solar energy system.
The study issued by IRENA on installed PV system shows an impressive decline of their
installation costs. From 2010 to 2015, it varied from 3600-5000 $/kW (in 2010) to 2500-
3400 $/kW (in 2015) for amorphous silicon (a-Si) thin film, while the installed cost for
cadmium telluride CdTe and copper indium gallium selenide (CIGS) was between 3600-
5000 $/kW (in 2010) and from 2500-3500 $/kW (in 2015) (IRENA, 2012d, p.41). On other
hand the study shows that the PV panel efficiency increased and developed: from 8-11% in
2010 to 11-12% in 2015 for a-Si thin film, and from 11-12% in 2010 to 13-17% in 2015 for
CdTe thin film and CIGS thin film. As a result, the cost decline by 30% during those 5
years and efficiency increased (IRENA, 2012d, p.41).
Libya does not have an industry association or solar technology market, or any kind of
related activities in this area; for that reason the PV module costs were taken based on these
studies with consideration of the project site character, region climate and suitable
technologies. Therefore, in the study, the CdTe thin film PV panel module was specified to
use with capital cost of 3000 $/kW, which represented the average installed cost estimated
by IRENA (2012d, p.41). The cost includes the PV subsystem, which including shipping,
mounting hardware, wiring, tracking system, transportation to the project site and
installation requirements. If the current trends continue for cost reduction the replacement
cost after 20 years will be 720.3 $/kW, but there can be no guarantee cost reductions will

65
be continuous or that solar panels will maintain a life of 20 years. Based on these
assumptions, the replacement cost assumed to capital cost decreased by 30% which equal
to 2100 $/kW. The operation and maintenance (O&M) cost for PV panel is very little and
not required for the panels, despite that 60 $/kW is assumed as the cost yearly for cleaning,
changing the required wiring and checking system connections.
The detailed overview of PV system cost and the parameters considered in the study are
illustrated in Table 5.1, while Figure 5.2 shows all these parameter inputs by HOMER. The
tracking system applied is indicated along the horizontal axis with daily adjustment and
tilted to the south, at an angle equal to the latitude of the site, with the intention of choosing
this kind of tracking so as to capture the sun as efficiently as possible, which will give more
energy output as well as to avoid the accumulation of sands and dusts in the case of using
fixed track system. The derating factor is assumed to be 90%; this factor reduces the PV
panel production by 10% taking into consideration the effect of temperature and dust on the
PV panel (HOMER energy, 2014)41. Consideration to the effect of temperature on cell PV
panels has been taken into account too, to measure the real production of the PV panel.
Related to the PV sizes system, Kreith and Kreider indicated that “PV systems are usually
sized based on the average values of energy and power needed, available solar radiation,
and component efficiencies” (2011, p.400). In the study, the PV sizes assumed based on
this concept, and considered based on power needed in the system, are assumed and
adjusted to the energy demand after the HOMER simulation and several tests in order to
meet the required load.
41 HOMER energy website, online Knowledge database support portal. Available at:
http://usersupport.homerenergy.com/customer/en/portal/[Accessed: 19th May 2014].

66
Figure 5.2: PV system input values used to design the Brak City HRES
Table 5.1: Input values summary of the PV system and parameters assumption details
Parameters
Value
Assumption discussion/ references
Capital cost
3000 $/kW
The cost assumed in average cost of estimated installed cost for
utility-scale PV system, where it is assumed based on the study
conducted on the international market assumption for utility-scale
PV system in 2015 (IRENA, 2012d p.41).
Replacement cost
2100 $/kW
The replacement cost in the study assumed as reduction of 30% of
capital cost for PV system, which considered the decline in price by
30%.
O&M cost
60 $/kW/yr.
The cost assumed based on the O&M cost estimation in the desert
such as in the Brak City HRES location (Electric Power Research
Institute (EPRI), 2010, p.9).
Life time
20 years
The majority of the manufacturers provides the lifetime of PV panel
as 25 years. In the study assumed in 20 years because can affect
through area climate where project located in the desert area.
Derating factor
90%
This value is assumed to consider the effect of temperature on the
PV array, typically around 90% (HOMER energy, 2014).
Ground reflection
40%
This is a typical value for the desert area such as in the Brak City
region, estimated as 20% in grass-covered areas and varied between

67
0.07-0.10 in ocean areas (Coakley, 2003, p.21).
Tracking system
Horizontal
axis daily
adjusted
This kind of tracking system has been assumed in the study to
capture the sun as much as possible during day time, as well to
avoid the accumulation of dust which can occur in cases where
fixed tracking systems are used.
Temperature
coefficient of
power
-0.5 %/C
This value depends on the type of PV model; it commonly varies
from -0.20 to -0.60 (%/C) and the assumption was based in that
range (HOMER energy, 2014).
Nominal
operation cell
temperature
(NOCT)
45C
These values vary from 45°C to 48°C typically, as specified
depending on technical data of the PV module, so the assumption
was in this range (HOMER energy, 2014).
Efficiency at Std.
test condition
15%
Also, the efficiency is different depending on the kind of panel and
its technical data; it varies from 11-17% in current PV module
types. Therefore the assumption was in average value of CdTe thin
film PV panel module (in 2015) that has been specified to use in the
design as illustrated above.
Size to consider
60,000 kW
80,000 kW
100,000 kW
120,000 kW
140,000 kW
180,000 kW
220,000kW
260,000kW
The PV sizes adjusted based on energy load required in the system,
as discussed above.
5.2.2. Wind Turbine
Wind turbine is essential in determining the cost of HRES too, considering it is very
cheaper technology compared to solar panel installation costs. For this reason, industry
companies and international associations pay attention when choosing suitable wind
turbine technology that is commensurate with the location characteristics and region
demands. Nowadays, various markets of wind turbine industries offer the technology at
different prices and qualities. The study conducted by IRENA classifies the typical
installation cost of wind turbine into three international markets: China and India, Europe
and North America (IRENA, 2012e, p.42). Also there is a big and growing industries
market in the wind turbine sector, which are introducing many kinds of wind turbines with
68
different classifications and technologies, such as output capacity and purpose of use; in
general, all of them are equal in terms of producing energy which makes the selection of
wind turbine technology more difficult.
Thus in this case study, the installation cost, based on the Europe market, for wind turbine
was taken into consideration for the design. Costs vary from 1850 to 2100 $/kW for
onshore wind farm, and the O&M cost varies from 0.013 to 0.025 $/kWh (IRENA, 2012e,
p.43-44). The reason for choosing the Europe market price instead of others is due to the
high quality of wind turbines as well as the big size of this sector in Europe, which offers
wider options for selecting wind turbines. Furthermore, the wind turbines used in the
design of Brak City HRES are European (German made) hence the relevant market price
has been chosen. Other parameters must be taken into account, including wind farm
capacity, wind speed and land property as well as investment policy, which can increase
the cost. As an example, in terms of project land, in most cases, such land is rented in most
of European countries, whereas in Libya, such land is state owned and there is no cost for
renting it; conversely, Libya has no industries in the wind turbine field, which means it
must be imported thus making the cost higher.
The wind turbine installation cost share is 65% to 84% of total cost for an onshore system,
with construction cost, grid connection and miscellaneous costs making up the balance
(IRENA, 2012e, p.19). Modern wind turbines have two or three blades, and the most
widely used at present is that with three blades with horizontal axes (i.e., HAWTs). This
was concluded from the study issued by Michaelides which states that “typically, the
modern turbines have two or three-blades and their design and operation have been
optimized to produce maximum energy from the prevailing local wind conditions” (2012,
p.235). The other study shows that “The most popular configuration for power-generating
wind turbines is the upwind three-bladed Horizontal Axis Wind Turbine (HAWT)” (Kutz,
2007, p.120). Consequently, in the design of the Brak City HRES the HAWT type with
three blades has been selected.
Additionally, in the study two wind turbines ENERCON E-101 and E-82 E2 have been
69
used in the design in order to identify the suitable wind turbine to use, where the cost and
technical parameter values of selected wind turbines are represented in Table 5.2. The
reasons for choosing this kind of wind turbines instead of other kinds are presented as
follows:
Based on the average wind speed in the project location (4.3 m/s), which can produce
energy in excess of 82 kW.
To know the advantages and disadvantage of using two types of wind turbine, and
which one optimal to use.
Using wind turbines with high output capacity, such as E-101, require less land use;
since the Brak City HRES is considered as a large-scale system, it could be more
logical to use large wind turbines instead of small ones which need more land, as a best
practice lesson learned from developed countries in this field (IRENA, 2012e, p.34).
The HOMER input values for wind turbines that were used in the design as shown in
Figure 5.3a, and 5.3b, while technical data and wind turbine detail for each one is
represented in Appendix 4. Also, a sensitivity study in wind turbine hub height for each
wind turbine type was included in the study in order to specify the suitable hub height for
each wind turbine. This sensitivity study based on hub height for wind turbine E-82 and
wind turbine E-101 as well as the system components sizes that have been used in the
design of Brak City HRES. The result of this simulation presented in Table 5.3, where the
system simulated in several times using one wind turbine hub height as recommended from
manufacturer in each time (see technical data for wind turbines in Appendix 4). As shown
that the COE is influenced due to wind turbine hub height values in wind turbine E-82,
while does not influenced in wind turbine E-101. In result the hub height 138 m for wind
turbine E-82 was chosen in design, because gives less value of COE, and the 99 m hub
height for wind turbine E-101, where the COE does not changed by hub height for E-101
even in high values.

70
Table 5.2: Wind turbine cost and parameters assumption details
Parameters
Values
Assumption discussion / references
Wind turbine E-82
Wind turbine E-101
Rated power
2000 kW, AC
3050 kW, AC
The maximum power output by wind
turbine as recommended from the
manufacturer (ENERCON, 2015, p.12
& p.22).
Capital cost
1,642,500 USD
3,650,000 USD
By assuming the cost as 1825 $/kW,
where this value represents the average
installation cost in the Europe market
as discussed above.
Replacement cost
1,511,100 USD
3,358,000 USD
By assuming the cost declined by 8%
of capital cost, where typical price
declined by 7-10% as mentioned in the
study issued by IRENA, thus the cost is
assumed in that range (2012e, p.35).
O&M cost
31207.5 USD
69350 USD
The O&M cost assumed by 0.019
($/kwh/yr), where this value represents
the average cost in the Europe market
as discussed above.
Hub height
138 m
99 m
These values selected based sensitivity
study as well as tested and simulate the
design in several times and comparing
the result with COE in each one as
discussed in previous.
Lifetime
20 years
20 years
Majority of manufacturers attribute
wind turbine lifetime as 20 years. The
study assumes this as accurate.
Size to consider
50, 75, 100, 125,
150 and 175
quantity
50, 75, 100, 125,
150 and 175
quantity
The wind turbines sizes adjusted based
on energy load required in the system.
Table 5.3: Sensitivity study on wind turbine hub height versus COE
Wind turbine E-82
Wind turbine E-101
Hub height (m)
COE ($/kWh)
Hub height (m)
COE ($/kWh)
87
0.163
99
0.163
85
0.162
135
0.163
98
0.161
149
0.163
108
0.161
-
138
0.159
-

71
Figure 5.3a: Wind turbine E-82 input values used in the design of Brak City HRES
Figure 5.3b: Wind turbine E-101 inputs values used in the design of Brak City HRES

72
5.2.3. Generator
There are big industries and manufacturers that provide different kinds of electrical
generators with different technologies; this makes it difficult to choose the proper
technology. HOMER simplifies this by listing different types of fuel, which enables the
designer to classify the kind of generator according to fuel type. In Libya, most electricity
production is done by diesel generators such as in Brak City region; this was the rationale
behind the decision to choose the use of DG in the design instead of other types of fuel,
such as gasoline or gas. Figure 5.4 shows the generator inputs and some data that HOMER
requires to simulate the system components, whereby the DG, specified as AC type,
produced and minimum load ratio by 30%. The minimum load ratio used to avoid the run
the generator at low load value, where has effect on corrosion and a shortening of lifetime
or at least increased maintenance cost for DG, where running the generator below than
25% can occur that, for this reason assumed greater than this value (HOMER, 2016)42.
The capital cost is assumed to be 800 $/kW including all the installation costs and
requirements of the system, while the replacement cost is assumed to be 600 $/kW. The
O&M cost is assumed as 0.03 $/kW/hour. The estimation of the cost and O&M of the
generator was based on trend market, while load ratio and lifetime were derived from the
HOMER online portal (2014; 2016), which supports the several capacities of the DG and
their expected lifetime.
42 HOMER energy, online support portal. Available at:
http://usersupport.homerenergy.com/customer/en/portal/articles/2188635-generator-minimum-load-ratio
Accessed 15th September 2016.

73
Figure 5.4: Generator inputs values used in the design of Brak city HRES
5.2.4. Converter
A converter, or inverter, is the device that converts electricity from DC to AC, which is one
of the major components in HRES. The inverter typically accounts for 5% of the total
installation cost in the system, where the cost range is between 0.27 $/W to 1.08 $/W,
which differs depending on the system size. In a large-scale energy system, the inverter
cost varies between 0.23 $/W and 0.57 $/W, while the cost ranges from 0.31 $/W to 1.03
$/W in small-scale system applications (IRENA, 2012d, p.20).
Therefore, in the study the cost converter was assumed in range of typical cost, where the
capital cost is 700 $/kW, and the replacement cost was assumed by 550 $/kW. The O&M
cost of an inverter is rare to require despite being assumed as 3 $/kW/yr.; these costs are
taken according to international pricing estimates with consideration specific to the project
site, such as transport to the location, shipping and installation requirements. The inverter
efficiency and rectifier efficiency is assumed to be 90% and 85% respectively for all sizes
considered in the system, and the inverter allowed operating simultaneously with the AC

74
generator, as shown in Figure 5.5, which represented the converter inputs values that are
need by HOMER to simulate the system components data and their parameters. Typically,
the converter lifetime is 15 years, wherein the study assumed it as that (IRENA, 2011,
p.55).
Figure 5.5: Converter inputs values used in the design of the Brak City HRES
5.2.5. Battery
The battery is responsible for storage of electricity, especially in a stand-alone system. In
fact, the storage of electricity in a hybrid system is expensive because the system depends
on the battery when there is not enough electricity produced from the system. The Surette
6CS25P have been chosen in the design of the Brak City HRES because they have a high
storage capacity and can be store a large amount of electricity. It is a lead-acid type of
battery, which is commonly used in RE systems, especially in PV systems as indicated by
Foster, Ghassemi, and Cota “the most common types of batteries used with PV systems are
lead-acid” (2010, p.145). Figure 5.6 shows the battery inputs that have been used and the
battery’s parameters.

75
The capital cost of the battery was $1200 and the replacement cost assumed to be $1000,
while the O&M cost required to upkeep the battery is assumed to be 5 $/yr., where the
price was based on the international market with consideration to shipping, transportation
and installation requirements for the project location (the battery characteristics are detailed
in Appendix 4, paragraph 6).
Figure 5.6: Battery inputs values used in the design of the Brak City HRES
5.3. Energy Resource
5.3.1. Solar Resource
The solar resource inputs are fundamental to calculate the PV array power output for each
hour of the year. The essential performance of solar resource is based on solar radiation,
which depends on location coordinates (i.e., longitude and latitude) and varies from one
place to another. Williams explained, “to evaluate the economics and performance of
systems for the utilization of solar energy in a particular location a knowledge of available
76
solar radiation at that place is essential” (1974, p.3). The other study indicates the
importance of solar radiation, as “detailed information about solar radiation availability at
any location is essential for the design and economic evaluation of a solar energy system”
(Kreith and Kreider, 2011, p.283).
The study input the daily solar average radiation and clearness average index for each
month, which are measured previously (in chapter 4 paragraph 4.4, and with the solar
source data of the selected location attached in Appendix 3) according to the latitude and
longitude of the project location. Furthermore, the time zone was considered in the study to
enable HOMER to simulate accuracy data based on local times for sunrise and sunset at the
site in order to determine daily radiation.
As shown in Figure 5.7, there is high potential for solar horizontal radiation in the region,
especially in July, June and August respectively when the average daily radiation is very
high compared to January, February, November and December, when averages are very
low. For the remaining months averages are close to the annual average value. In the
design of HRES for Brak City is a sensitivity study included. In first line is the scattering of
the clearness factor responsible for changes of the daily radiation. Unfortunately is the
scattering of this clearness factors not known. Estimated are here that this clearness factor
may be approximately 15% higher or lower than observed in average. This led on the one
hand to 0.85*5.7= 4.85 kwh/m2/d, which is nearly equal to the annual radiation average of
Murqub district, therefore these Murqub district radiation values consideration here (see
Appendix 1). On the other hand with 15% higher clearness approximately radiation values
of Kufra district will be reached. This 6.37 kwh/m2/d annual average of Kufra district value
is therefore also clearness for this sensitivity analysis.

77
Figure 5.7: Solar resource inputs values for the site of the Brak City HRES
5.3.2. Wind Resource
The wind resource has been used in order to determine the wind turbine production
capacity, which was determined by inputting the average wind speed for each month,
which are measured as previously mentioned according to project site coordinates (again,
in chapter 4, paragraph 4.4, with and the wind source data of the selected location attached
in Appendix 3).
The wind speed potential in the site, represented in Figure 5.8, shows the wind speed
varying from 3.9 m/s to 4.9 m/s due to difference of season, whereas the high wind speed
values are in May, April, June, March and July respectively, while it is semi equal in
remaining months. The annual average wind speed values were scaled into three values to
conduct a sensitivity analysis similar as done for solar resource and as simplification for the
real but unknown scattering of annual wind speed values, the wind conditions of other
region of Libya considered here:
78
Annual average wind speed of 4.3 m/s, which represents the real annual average value
of year months in Brak City region.
Annual average wind speed of 3.9 m/s, which represents the annual average wind speed
in Butnan district, where considered the minimum wind speed of Libya districts (see
Appendix 1).
Annual average wind speed of 5.2 m/s, which represents the annual average wind speed
in Marj and Benghazi districts, where considered the minimum wind speed of Libya
districts (see Appendix 1).
The rationale for conducting a sensitivity study on wind speed with different values is to
measure wind power production in the case that wind speed is lower or higher than the
annual average value, and to determine if can meet the load demands in this scenario. The
assumption parameters related to wind source are shown in Table 5.4 with discussion.
Furthermore, sensitivity study conducted on advanced parameters of wind turbine with
comparing the results with COE in order to specify the suitable value to use in the design.
This sensitivity study based on Weibull k value, 1-hr autocorrelation factor, diurnal pattern
strength and hour of peak wind speed value as well as the system components sizes that
have been used in the design of Brak City HRES. Likewise, other sensitivity study, here the
system simulated in each one by using one value in the design. The results of this study for
these parameters are represented in Figure 5.9a, Figure 5.9b, Figure 5.9c and Figure 5.9d
respectively. As shown from these Figures the COE influenced by changing value of
Weibull k, especially in case of using 2.5 in the design which given the lowest COE. The
value of 2.5 Weibull k was selected to used in the design, because the frequency of this
value unknown for wind data in Libya and there is no study indicated to that. Regarding the
1-hr autocorrelation factor, the system does not influenced by using 0.80, 0.85 and 0.90 and
gives the same COE in these values, while influenced in case of use 0.95, where the COE
increased as 0.010 more. May be this indicating to that the system components efficient to
operate with autocorrelation factor value between 0.80 to 0.90. In this context, the 1-hr
autocorrelation factor value assumed as 0.85 in the study, which represented the average of
these values. For the diurnal pattern strength and hour of peak wind speed value the COE

79
does not change and not influenced through changing the parameters values as shown,
where in the design assumed as 0.20 for diurnal pattern strength and 15 hour of peak wind
speed.
Figure 5.8: Wind resource inputs values for the site of the Brak City HRES
Table 5.4: Wind resource parameters assumption details
Parameters
Values
Discussion of assumption
Time step
60 minutes
Assumed as standard
Altitude
491 m
Determined based on the site coordinates, where measured
by NASA (see Appendix 3, location 2).
Anemometer height
10 m
The height above ground at which the wind speed data is
measured by NASA (see Appendix 3, location 2).
Weibull k
2.5
Typical values ranges from 1.5 to 2.5 (HOMER energy,
2015)43. In this study was selected based on a sensitivity
study conducted on Weibull k value versus COE as shown
in Figure 5.9a.
43 HOMER energy, knowledge support portal of the software Accessed: 23rd November 2015.

80
1-hr autocorrelation factor
0.85
This value typically ranges from 0.80 to 0.90, (HOMER
energy, 2015). In this study was selected based on a
sensitivity study conducted on 1-hr autocorrelation factor
value versus COE as shown in Figure 5.9b.
diurnal pattern strength
0.2
This value varies between 0-0.4 typically (HOMER
energy, 2015). In this study was selected based on a
sensitivity study conducted on diurnal pattern strength
value versus COE as shown in Figure 5.9c.
hour of peak wind speed
15
Typical range is 14-16 hours (HOMER energy, 2015). In
this study was selected based on a sensitivity study
conducted on diurnal pattern strength value versus COE as
shown in Figure 5.9d.
Figure 5.9a: Sensitivity study on Weibull k value versus COE
Figure 5.9b: Sensitivity study on autocorrelation factor value versus COE
0.13
0.135
0.14
0.145
0.15
0.155
1.5
2
2.5
COE ($/kWh)
Weibull k Value
Weibull k versus COE
0.134
0.136
0.138
0.14
0.142
0.144
0.146
0.148
0.15
0.8
0.85
0.9
0.95
COE ($/kWh)
Autocorrelation Factor
Autocorrelation Factor versus COE

81
Figure 5.9c: Sensitivity study on diurnal pattern strength value versus COE
Figure 5.9d: Sensitivity study on hour of peak wind speed value versus COE
5.3.3. Diesel Fuel
The diesel fuel price in Libya is subsidized by the Libyan government by 60% of real cost
at the equivalence of 7.6% of GDP representing a total of 13.8% of GDP subsidies in 2012,
which indicated a high subsidy in fuel price (IMF, 2012, p.4). Presently, diesel price is
equal to 0.10 $/L in the current oil market of Libya; this is very low in comparison to
international average diesel prices, as well as real cost of production. Therefore, the diesel
price in the study was taken as real price without subsidies and with consideration to
transport cost because the project region is located far away from diesel suppliers. On the
other hand, in the study a sensitivity study was conducted on the diesel price in order to
0
0.02
0.04
0.06
0.08
0.1
0.12
0.14
0.16
0.1
0.2
0.3
0.4
COE ($/kWh)
Diurnal Pattern Strength
Diurnal Pattern Strength versus COE
0
0.02
0.04
0.06
0.08
0.1
0.12
0.14
0.16
14
15
16
COE ($/kWh)
Hour of Peak Wind speed
Hour of Peak Wind Speed versus COE
82
examine the COE in terms of increases in diesel prices, where the price was assumed to be
0.20 $/L, 0.40 $/L, 0.60 $/L and 0.80 $/L in the study to find out, if dramatic diesel price
increases would support RE systems.
5.4. System Parameters
5.4.1. Economic Inputs
Economic inputs values were used in HOMER to calculate the NPC, which are different
based on macroeconomic and investment policy calculations. Therefore, in this study the
macroeconomic condition and concessional financing, as well as investment policy in
Libya, have been considered in order to specify the annual real interest rate and were
assumed at 6%. Based on the technical definition, “real interest rate is equal to the nominal
interest rate minus the inflation rate” (HOMER, 2014). On other hand, project lifetime
must be taken into account so as to determine the NPC through the project lifetime, which
used as 25 years in the study as shown in Figure 5.10. The select of project lifetime was
based on a sensitivity study that conducted in order to specify the project lifetime by
compared with COE by simulating the design in several times by using the project lifetime
in each once. This sensitivity study based on some components lifetime that have been
used in the design of Brak City HRES, such as converter, PV panel and wind turbine of,
whether solar system, wind system, solar and wind system as shown in Figure 5.11. As
shown that, whenever project lifetime increased, the COE decreased, for this reason the
maximum project lifetime was selected in the design (i.e 25 years).
Considerations to other elements, such as system fixed capital cost, system fixed O&M
cost and capacity shortage penalty were not take into account in the study because they are
calculated by HOMER according to real components costs, which means converting real
capital cost for each component throughout its lifetime using the real discount rate.

83
Figure 5.10: Economic inputs values used in the design of the Brak City HRES
Figure 5.11: Sensitivity study on project lifetime versus COE
5.4.2. Constraint Inputs
Producing 100% energy via RE resources is difficult and even impossible, especially in a
utility-scale system with large capacity such as in the Brak City HRES. Also, literature
studies show that it is difficult to balance the energy production in a HES with certain
productivity of loads, and some cases are not economically viable to serve the load
required (HOMER, 2014). More pronounced is the example of the case of cloudy days
when PV production will be less than the load demands, similarly is the case of atypical
days with low wind speed during which wind energy production will decline. The system
will have to use the electricity that is produced by other components, such as DG, to satisfy
0.14
0.145
0.15
0.155
0.16
0.165
0.17
0.175
15
20
25
COE ($/kWh)
Year
Project Lifetime versus COE
Solar System
Wind System
Solar and
Wind System

84
the needs in these cases. Consequently, to avoid these situations HOMER provides
constrain inputs, which are used to calculate the feasible conditions of the system and the
economic performance for each hour of operation to meet the demands.
Therefore, in the study the sensitivity study conducted on minimum renewable fraction in
order to specify the suitable value to be used in the design. This sensitivity study based on
minimum renewable fraction supported by HOMER as well as the system components
sizes that have been used in the design of Brak City HRES, whether solar system, wind
system, solar and wind system. As shown in Figure 5.12 the COE influenced due to
changing value of minimum renewable fraction when is greater than 20% in solar system
and when is greater than 30% in wind system, while the COE does not influenced in case
of design solar and wind system even at 50%, the COE stay at same value. In this context,
the result of this sensitivity study concluded to that a minimum renewable fraction by 20%
have been used in the design, because it’s the appropriate value for all design scenarios,
which gives the lowest COE in all design scenarios, whether design solar energy system,
wind energy system, solar and wind energy system. The maximum annual capacity
shortage assumed by 0% to identify the real shortage percentage in each scenario according
to energy resource situations. In addition to this, HOMER calculates renewable output
percent in each scenario based on the system configuration components and resource
capacities for each case. So, in this context the percent of renewable output for solar and
wind have been taken as default values by HOMER as illustrated in Figure 5.13.
Figure 5.12: Sensitivity study on minimum renewable fraction value versus COE
0
0.05
0.1
0.15
0.2
0.25
0
10
20
30
40
50
COE ($/kWh)
Minimum Renewable Fraction (%)
Minimum Renewable Fraction versus COE
Solar
System
Wind
System
Solar and
Wind
System

85
Figure 5.13: Constraints inputs values used in the design of the Brak City HRES
5.4.3. Ambient Temperature Inputs
Ambient temperature is very important to calculate and determine the effect of temperature
on the PV panel and to calculate the production of the PV array in each time-step. The
average temperature of each month is used in the study, which is determined according to
the project site coordinates. The temperature is high in May, June, July, August and
September indicating that the effect on the PV panel is high during these months, while it is
neutral during the rest of the months of the year except in January, February and December
(winter season) when it is relatively low. That means that as the temperature is higher the
PV panel productivity will slightly decrease, which indicates to that the production of the
PV panel is affected by ambient temperature. Thus, in the study the annual average
temperature of 22.4°C is used in the design to measure the real power production of the PV
panel as shown in Figure 5.14, which is determined based on the site coordinates (see
Appendix 3, location 2).

86
Figure 5.14: Temperature inputs values used in the design of the Brak City HRES
5.4.4. System Control Inputs
HOMER has two different types of dispatch strategies, load following strategy (LF) and
cycle charging strategy (CC), which are used to control the system of battery charging. In
the study, both strategies have been used, as shown in Figure 5.15, to let HOMER simulate
and calculate the best strategy in each scenario based on system configurations, as well as
to make the simulation process more widely usable, and not to force all systems to operate
on one strategy. The difference between these strategies is that in the LF strategy the
generator is operating to provide only the power necessary to meet the load demands at the
time, while in the CC strategy the generator operates as much power as possible to charge
the batteries in addition to meeting the load (HOMER, 2015). Concerning the generator
control system, the system allows for multiple generator operation, with multiple
generators running simultaneously and with generator running at less than peak load to
make HOMER determine the possibilities in each system.

87
Figure 5.15: System control inputs values used in the design of the Brak City HRES
5.4.5. Grid Extension Inputs
The grid extension inputs in HOMER were used to calculate the minimum distance that
make a stand-alone system cheaper than grid extension, which means comparing the cost
between a stand-alone system and one that is grid extension; this was defined as breakeven
in HOMER.
Thus, the capital cost for one kilometer (km) is assumed at a rate of 15000 $/km and the
O&M at 160 $/km as shown in Figure 5.16, where the price assumed is based on the
construction market price in Libya. Regarding to the grid power price, in the study was
selected based on a sensitivity study conducted on electricity price produced in the grid
versus diesel price in order to determine the grid price at each diesel price level, where
0.130 $/L, 0.203 $/L, 0.277 $/L and 0.351 $/L have been used in the design as clarified
later in paragraph 6.1.3.3 (Figure 6.7).

88
Figure 5.16: Grid extension inputs values used in the design of the Brak City HRES
5.5. Summary of Inputs and Selected values
The values in the study were selected and assumed with consideration to international
studies that have been conducted in this area in order to specify the cost, components sizes
and parameter values, whereas the assumptions are summarize as follows:
The component sizes including PV panel, wind turbine, inverter, battery and DG are
adjusted to the required load of system that has been previously designed (in paragraph
4.3.). The sizes were tested several times by simulation data in HOMER and the results
were adjusted in order to specify the optimal sizes appropriate to each component as
well as the load required by the system.
The component sizes, parameters and cost for all scenarios are similar and identical in
order to make the feasibility study and comparison of the scenarios results more
consistent and feasible.
The cost system components were estimated based on international studies as well as
industry market price in this field, with consideration to the shipping cost,
transportation and instillation cost at the project site.
The cost of infrastructure such as needed buildings, roads, and diesel storage as well as
site exploitation not considered in inputs data for design of Brak City HRES as well as
not supported by HOMER processes in design. Also, the cost of electricity transmission
89
and connectivity grid infrastructure whether in stand-alone system or grid-connected
system to the electricity station for Brak City region not considered in the study.
The parameter values were assumed at average or within typical range values in most
cases, which were provided by HOMER and global studies. In addition to, a sensitivity
study conducted on some components parameters in order to specified the suitable
value to be used in the design (as in paragraphs 5.3.2, 5.4.1 and 5.4.2).
The sensitivity variable values considered future outlooks, such as diesel price to
consider the effect of changes to these variables on the energy system in the case of
increasing costs.
90
6. Results Analysis and Discussion of Design Brak City Hybrid Renewable
Energy System
6.1. Scenario I: Design Solar Hybrid Energy System for Electricity Supply to Brak
City
6.1.1. Scenario I: Concept Formulation
This scenario focused on the design of the HRES for Brak City that will operate with solar
and diesel main sources of energy, thereby combining PV module and DG technology.
Therefore, the design was considered in two Categories, wherein the first design
concentrated on a solar stand-alone system, and the second one focused on a solar grid-
connected system in order to meet the electricity demands in Brak City. The objectives of
this scenario are to identify and discover the following:
The feasibility of using of PV technology in case of increasing diesel prices in region.
The solar energy shares in the system as well as the COE.
Which most cost-effective system to use in the region, solar stand-alone system or solar
grid-connected system?
To compare the COE gained from the study with the COE of existing system.
What is the OST configuration in a solar stand-alone system and solar grid-connected
system?
If the design meets the electricity demand for Brak City.
To achieve these targets, the result of 1728 systems designs (see Appendix 5, paragraph 16)
was simulated and tested by HOMER, additionally 12 sensitivity cases have been used in
the design representing four variables of diesel price and three variables of solar radiation
density as previously specified in chapter 5 (in paragraph 5.3.1. and 5.3.3.). The detail of
system categories and winning components related to the design of the solar HES are
shown in Appendix 6, paragraph 1 (the objectives answer presented in paragraph 6.1.5).

91
6.1.2. Result Analysis of Solar Stand-Alone System
6.1.2.1. Optimization Results
HOMER presented the optimization results categorically, where each category reflects
system configuration and size components with NPC and renewable fraction in the system.
Because of huge data results, in the study, a particular case has been considered in order to
compare the system categories for all systems of scenarios, not only in the case of solar
energy technology usage in the design, but in other systems, as well, including wind energy
systems, solar and wind energy systems. Consequently, the average of renewable sources
in the site as well as the current cost of diesel in Libya without subsidies has been taken
into account in the study in order to compare these systems in one identical case (i.e.
average solar radiation 5.7 kWh/m2/d, average wind speed 4.3 m/s, and with diesel price
0.20 $/L).
In the case of the design for a solar stand-alone HES for Brak City, the optimization results
for the average renewable resource in the site and fuel price is shown in Figure 6.1. The
most economically OST is PV/DG/battery/converter with a minimum COE of 0.153 $/kWh
and with 21% share of RE in the system with CC of dispatch strategy, even without battery,
because the generator need to operate at full output to serve the required load (see, the CC
clarification in paragraph 5.4.4).
Figure 6.1:
Optimization results for solar stand-alone HES for Brak City at sensitivity
variables of solar radiation 5.7 kWh/m2/d and diesel price 0.20 $/L

92
6.1.2.2. Simulation Results of Energy Production of the Optimal System
The simulation results presented in the study are at the same variables that have been
considered in the optimization results, which refer to the average of renewable sources in
the project location and the current diesel price in Libya. Consequently, the simulation
results of the solar stand-alone HES design are represented in Figure 6.2, where the share
of PV electric production is 24% in the system. The excess of electricity is 0.483%; this is
the loss of electricity from system components such as inverter, battery and DG where this
value goes to waste (HOMER does not account this value to calculate the COE). The
system has shortage capacity of 0.048%, despite the small quantity of unmet electricity
load, resulting in 0% total energy produced.
Figure 6.2:
Simulation results for solar stand-alone HES for Brak City at solar radiation of
5.7 kWh/m2/d and diesel price 0.20 $/L

93
6.1.2.3. Sensitivity Results
In this sensitivity study only the optimal system configuration is analyzed. It is analyzed
how sensitive this OST is reaching on changes in diesel price and/or solar radiation values.
In all cases is PV/DG/battery44 (as shown in Figure 6.3) the optimal solution. Therefore,
The OST configuration does not influenced and not changed by increases in fuel price nor
by solar radiation density at the site.
Figure 6.3:
Sensitivity results and OST for solar stand-alone HES for Brak City with
superimposed LCOE
The overall sensitivity results of all systems configuration related to the design for the solar
stand-alone HES are represented in Figure 6.4, which show all the system components with
each sensitivity variable as well as the value of future parameters. The cheapest COE is
0.151 $/kWh at solar radiation 6.37 kWh/m2/d and diesel price at 0.20 $/L and with share
of the RE set to 24%, which reflects the low diesel price and highest solar radiation.
Therefore, the COE increasing whenever diesel price and solar radiation increased. As
shown that CC is optimal dispatch strategy overall system components sizes as well as the
sensitivity variables used in the design.
44 This configuration of the OST includes converter too, where HOMER did not displayed this when
representing sensitivity results graphically, thought it was displayed in overall sensitivity result categories as
well as in the schematic of the system, as well as in other design systems of scenarios.

94
Further will be mentioned and discussed only some reasonable results of this sensitivity.
For example: Even the sensitivity variables changing (i.e. solar radiation and diesel price),
system components size not changing in DG, battery and converter. A changing in PV size
occurs in case of diesel price lower or higher as 0.40 $/L (except for solar radiation of 4.92
kWh/m2/d and diesel price at 0.40 $/L). This may be referred to, that these components
sizes are the optimal in system configuration not in general but due to the chosen input
values.
The renewable fraction in the system increases as solar radiation and diesel price increased,
but, surprising not in case of diesel price 0.80 $/L (the renewable fraction less than in case
of diesel price 0.60 $/L), because of the electricity losses in the system where the excess of
electricity goes to waste. For example with solar radiation 6.37 kWh/m2/d with diesel price
0.60 $/L the renewable fraction is 36% with 11.3% excess of electricity in the system,
while at diesel price 0.80 $/L the renewable fraction is 35% with 11.8% excess of
electricity (see, the example of these losses shown in Appendix 5 paragraph 17).
Figure 6.4: Sensitivity result categories for solar stand-alone HES for Brak City

95
6.1.3. Result Analysis of Solar Grid-Connected System
6.1.3.1. Optimization Results
In design grid-connected system need to specify the maximum amount of electricity that
can flow to and from the grid. Lambert clarified how to specify this value as “specify a
value equal to or greater than the peak load” (2010, HOMER online support). In the design
of Brak City HRES the grid value specified greater than the peak load of the system (see
Figure 5.1a, where the peak load of the system is 76,204 kW), and specified to 80,000 kW
as illustrated in Figure 6.5. As shown from this Figure, the optimization results of solar
grid-connected HES for Brak City at the average solar radiation in the site of 5.7 kWh/m2/d
and diesel price at 0.20 $/L show that the minimum COE is 0.137 $/kWh. The renewable
fraction is 23% and does not changing even the system configuration changed, because all
systems produced same amount of the electricity from PV, which equal to 25%. The
system comes in first rank from the four possible systems, where the OST configuration is
grid/PV/DG/converter, and dispatch strategy is CC, while the system comes in second rank
in the case of use small battery bank in system configuration with LF of dispatch strategy.
Figure 6.5:
Optimization results for solar grid-connected HES for Brak City at sensitivity
variables of solar radiation 5.7 kWh/m2/d and diesel price 0.20 $/L
6.1.3.2. Simulation Results of Energy Production of the Optimal System
The simulation results for the design of solar grid-connected HES at solar radiation value
of 5.7 kWh/m2/d and diesel price 0.20 $/L is represented in Figure 6.6, where the share of
RE in the system produced from PV module results in a 25% share. The value of excess

96
electricity in system is 0.09%, and the system has no shortage capacity and thus meets the
electric load in a year.
Figure 6.6:
Simulation results for solar grid-connected HES for Brak City at solar radiation
of 5.7 kWh/m2/d and diesel price 0.20 $/L
6.1.3.3. Sensitivity Results
The COE for electricity produced in the grid is increasing whenever diesel price increased.
Because of that, firstly must be calculated this dependency of the COE produced by DG
only from diesel price (these COE had been calculated for the system configuration that
presented in Appendix 5, paragraph 12). This is shown in Figure 6.7, and used also in the
other scenarios.

97
Figure 6.7: Sensitivity study on diesel price versus grid COE
As shown from Figure 6.8a, Figure 6.8b, Figure 6.8c and Figure 6.8d, the OST
configurations for all system variable cases considered in the design is
grid/PV/DG/converter. Also, here even if the diesel price and solar radiation changed the
OST configuration is not changing, which may be refer to that this optimal configuration
system through sensitivity variables that have been used in the design. As in stand-alone
system, the CC is optimal dispatch strategy overall system components sizes as well here.
Also, the all systems used the same size of DG, converter, while the PV size is changing,
especially at low solar radiation of 4.92 kWh/m2/d the system used big size of PV, because
need to more size to satisfy the electricity needs. This may be indicating to that this the
optimal size in system configuration that fit with electricity load requirements. The
renewable fraction in some cases are similar, despite the PV size changes, which may be
referred to that this the maximum energy can be produced from PV with these system
components and variables, even at case of increase solar radiation and diesel price. A
comparison of stand-alone system and grid-connected system is given in paragraph 6.1.5.
0
0.05
0.1
0.15
0.2
0.25
0.3
0.35
0.4
0.2
0.4
0.6
0.8
COE ($/kWh)
Diesel Price ($/L)
Diesel Price versus COE

98
Figure 6.8a:
Sensitivity result categories for solar grid-connected HES for Brak City at
diesel price 0.20 $/L
Figure 6.8b:
Sensitivity result categories for solar grid-connected HES for Brak City at
diesel price 0.40 $/L
Figure 6.8c:
Sensitivity result categories for solar grid-connected HES for Brak City at
diesel price 0.60 $/L
Figure 6.8d:
Sensitivity result categories for solar grid-connected HES for Brak City at
diesel price 0.80 $/L
99
6.1.4. Breakeven Grid Extension Distance of Solar Hybrid Energy System
The comparison study was conducted on grid extension in order to compare the solar stand-
alone HES cost with grid extension cost, indicated to the breakeven grid extension distance
which varies by the price of diesel. Lambert simplified and describes the breakeven grid
extension distance as “the distance from the grid which makes the net present cost of
extending the grid equal to the net present cost of the stand-alone system. Farther away
from the grid, the stand-alone system is optimal. Nearer to the grid, grid extension is
optimal” (2010, HOMER online support).
So, findings that the cost of grid extension distance is influenced by diesel price categories,
and various from negative value to 8,257 km depending on NPC as illustrated in Figure
6.9. In case of grid extension distance comes in negative value, the stand-alone system will
be optimal as clarified in the study that “the EDL45 comes out be a negative value meaning
that a decentralised RE hybrid system is a better option than the grid extension”
(Battacharyya and Palit, 2014, p.227). Based on this, the following points can be simply
stated:
At diesel price 0.20 $/L the grid extension cost less than solar stand-alone system up to
8,257 km, thereafter the grid extension becomes more expensive. If the system is
farther away from the grid the stand-alone system is optimal to use.
At diesel price 0.40 $/L the grid extension cost less than solar stand-alone system up to
2,148 km, thereafter the grid extension becomes more expensive.
The grid extension distance at diesel price 0.60 $/L and 0.80 $/L is in negative value,
which indicates to the solar stand-alone system is optimal option than grid extension
(because COE produced by the grid is higher than COE produced by the stand-alone
system).
45 The grid extension known also as economical distance line (EDL).

100
Figure 6.9:
Breakeven grid extension distances for solar HES for Brak City at sensitivity
variables of solar radiation 5.7 kWh/m2/d and with different diesel price
categories
6.1.5. Conclusion
The study conducted on design solar HES be it a stand-alone system or grid-connected
system concluded that there is feasibility for the use of PV technology, where the potential
is high. The solar energy shares in the system vary from 21% to 36% for all the feasible
systems that have been tested and used in the design with COE being between 0.134 $/kWh
to 0.335 $/kWh.
The solar grid-connected systems are most cost-effective (i.e. lower-cost) than solar stand-
alone systems in terms of energy at all sensitivity variables as shown in the comparison
Breakeven Grid Extension Distance:
-5,285 Km
Diesel Price:
0.60 $/L
Breakeven Grid Extension Distance:
8,257 Km
Diesel Price:
0.20 $/L
Breakeven Grid Extension Distance:
2,148 Km
Diesel Price:
0.40 $/L
Breakeven Grid Extension Distance:
-12,122 Km
Diesel Price:
0.80 $/L

101
represented in Figure 6.10. In addition, in comparison the COE for both systems in terms of
average renewable sources and actual diesel cost in Libya is lower than the current COE in
existing energy system in region (i.e. the COE in Libya without subsidies, which equal 0.20
$/kWh). The OST configurations are PV/DG/battery/converter and grid/PV/DG/converter
in a stand-alone system and grid-connected system respectively. This configuration and
system schematic is clearly shown in Figure 6.11, which represents the result of the
simulation process of the design solar HES for Brak City.
In summary, the advantages of implementation of such technology results in COE that is
less than that in the existing system, and furthermore is environmentally-friendly as well
meets the electricity demand for Brak City region.
Figure 6.10: Comparison of COE for solar HES categories for Brak City
0 0.1 0.2 0.3 0.4
0.20
0.40
0.60
0.80
0.20
0.40
0.60
0.80
0.20
0.40
0.60
0.80
4.92
4.92
4.92
4.92
5.70
5.70
5.70
5.70
6.37
6.37
6.37
6.37
COE ($/kWh)
Sensitivity Variables: Solar Radiation (kWh/m²/d) and
Diesel Price ($/L) respectively
COE for Solar HES Categories
Stand-Alone System
Grid-Connected System

102
Figure 6.11: Schematic configurations of solar HES categories for Brak City
6.2. Scenario II: Design Wind Hybrid Energy System for Electricity Supply to
Brak City
6.2.1. Scenario II: Concept Formulation
The concept of this scenario is like the previous scenario, but it differs in the type of RE
technology, wherein wind energy technology has been used in the design. The scenario
concentrated on the design of HRES for Brak City using wind and diesel as the main
sources of energy, thus combining wind turbine and DG. The design was into considered in
two categories, wherein the first design concentrated on designing a wind stand-alone
system, and the second design concentrated on designing a wind grid-connected system in
order to meet the electricity demand in Brak City. The scenario aims to determine and
explore the following:
Is it cost-effective and feasibility of use wind energy technology in the region?
The gained COE from the scenario as well as wind energy shares in the system.
Which most cost-effective system to use in the region, wind stand-alone system or wind
grid-connected system?
To compare the COE gained from the study with the COE of existing system.
What OST configurations in wind stand-alone system and wind grid-connected system?
Solar Stand-Alone System
Solar Grid-Connected System

103
If the design meets the electricity demand for Brak City.
Thus, the result of 2496 systems designs (see Appendix 5, paragraph 16) was tested and
simulated in order to realize these tasks. In addition, 12 sensitivity variables have been used
in the design, including four variables of diesel price and three variables of wind speed as
specified previously (as mentioned in paragraphs 5.3.2 and 5.3.3). Thus, the sensitivity
study in this scenario was conducted within two dimensions; first, the wind speed; second,
diesel price.46 The system categories and winning components for the design wind HES is
illustrated in detail in Appendix 6, paragraph 2 (the objectives answer presented in
paragraph 6.2.5).
6.2.2. Result Analysis of Wind Stand-Alone System
6.2.2.1. Optimization Results
The optimization results for wind stand-alone HES for Brak City with wind speed in the
site of 4.3 m/s with diesel price of 0.20 $/L shows that the OST configuration is
wind/DG/battery/converter as shown in Figure 6.12. The system preferred to use the wind
turbine E-82 instead of the wind turbine E-101 in the system configuration. This indicates
that the wind capture is more efficient at the hub height of wind turbine E-82, although the
wind turbine E-101 has more powered. As a result, COE in this system is 0.139 $/kWh
with a contribution of 36% of RE and with CC of dispatch strategy.
46 Again, because of huge amount of data gathered the result analysis represented the average renewable
sources in the project site of Brak City HRES and current diesel price without subsidies for all scenarios in
order to compare them in one case and situation. The same goes for the case design of the wind energy
system.

104
Figure 6.12:
Optimization results for wind stand-alone HES for Brak City at sensitivity
variables of wind speed 4.3 m/s and diesel price 0.20 $/L
6.2.2.2. Simulation Results of Energy Production of the Optimal System
The simulation result for wind stand-alone HES at average wind speed in the site is 4.3 m/s
and diesel price of 0.20 $/L resulting in the contribution of 40% of energy produced by
wind turbine E-82 as shown in Figure 6.13. The excess of electricity through system
components is 4.21% and the system meets the electric load with very low capacity
shortage in a year, which equal to 0.03%.
Figure 6.13:
Simulation results for wind stand-alone HES for Brak City at wind speed 4.3
m/s and diesel price 0.20 $/L

105
6.2.2.3. Sensitivity Results
The sensitivity results for wind stand-alone HES indicates to that the system configuration
has not changed and causes an effect through the increasing of the fuel price as well as
wind speed in the site, where the OST for all variables cases is wind/DG/battery, as shown
in Figure 6.14. The system configuration especially the number of turbines remains at the
same structure for all wind speed values. Only the number of hours during which the diesel
generators are running decreased dramatically with increasing diesel price. The amount of
diesel needed in case of wind speed 3.9 m/s and diesel price of 0.20 $/L is more than half
than in use of wind speed 5.2 m/s and diesel price 0.80 $/L. This is clearly shown in Figure
6.15, where CC is optimal dispatch strategy overall system components sizes as well as the
sensitivity variables used in the design. The minimum COE is 0.122 $/kWh at wind speed
of 5.2 m/s and diesel price at 0.20 $/L and with share of the RE set to 52%, which reflects
the low diesel price and maximum wind speed. Therefore, the COE increasing whenever
diesel price and wind speed increased.
Figure 6.14:
Sensitivity results and OST for the wind stand-alone HES for Brak city with
superimposed LCOE,

106
Figure 6.15: Sensitivity results categories for wind stand-alone HES for Brak City
6.2.3. Result Analysis of Wind Grid-Connected System
6.2.3.1. Optimization Results
The OST for wind grid-connected HES for Brak City is grid/wind/DG at wind speed of 4.3
m/s and diesel price of 0.20 $/L as shown in Figure 6.16, which represents the optimization
results of the system. Likewise, in the case of the wind stand-alone, the system which
preferred to use the wind turbine E-82 instead of wind turbine E-101 in the system
configuration, where the COE is 0.113 $/kWh with the renewable fraction by 37% in the
system, and CC of dispatch strategy.
Figure 6.16:
Optimization results for wind grid-connected HES for Brak City at
sensitivity variables of wind speed 4.3 m/s and diesel price 0.20 $/L

107
6.2.3.2. Simulation Results of Energy Production of the Optimal System
The simulation results for wind grid-connected HES presents that the system meets the
load demand and has no capacity shortage, wherein 40% of energy produced by wind
turbine (E-82) as shown in Figure 6.17. The excess of electricity through system
components is a little high, which equates to 4.96% of total energy produced in a year.
Figure 6.17:
Simulation results for wind grid-connected HES for Brak City with wind
speed 4.3 m/s and diesel price 0.20 $/L
6.2.3.3. Sensitivity Results
The sensitivity results for wind grid-connected HES concluded that the OST configurations
for all sensitivity variables is grid/wind/DG as shown in Figure 6.18a, Figure 6.18b, Figure
6.18c Figure 6.18d. Therefore, the increasing of fuel price and wind speed value in the site
has no effect on the system configuration. This may be referring to that this the optimal
size in system configuration, which fit with electricity load requirements. Likewise in wind
stand-alone system, the CC is optimal dispatch strategy overall system components sizes as
well as the sensitivity variables used in the design.

108
At diesel price 0.60 $/L and 0.80 $/L, the system use more quantity of wind turbine to
producing the electricity, and this may be refer to tis most economically than producing by
diesel generators at that diesel cost. Consequently, the renewable fraction increased
whenever number of wind turbines used in the system increased. Except, in sensitivity
variables of 5.2 m/s and diesel price of 0.60 $/L and 0.80 $/L the system prefer to use 75
wind turbines and gives the same renewable fraction 62% (also except in Figure 6.18d,
where the number of wind turbines decreased from 100 to 75 despite the wind speed
increasing), which is may be indicates to that the system influenced by strength of wind
speed and not influenced by increase of diesel price.
Figure 6.18a:
Sensitivity result categories for wind grid-connected HES for Brak City at
diesel price 0.20 $/L
Figure 6.18b:
Sensitivity result categories for wind grid-connected HES for Brak City at
diesel price 0.40 $/L
Figure 6.18c:
Sensitivity result categories for wind grid-connected HES for Brak City at
diesel price 0.60 $/L

109
Figure 6.18d:
Sensitivity result categories for wind grid-connected HES for Brak City
at diesel price 0.80 $/L
6.2.4. Breakeven Grid Extension Distance of Wind Hybrid Energy System
The results of the study were conducted on breakeven grid extension distance in order to
compare the wind stand-alone system cost with grid extension cost and determine if it is
similar as the results in solar HES categories. The grid extension distance is influenced by
varying diesel prices as shown in Figure 6.19 and can summarized in the following way:
The cost of the grid extension with diesel price of 0.20 $/L is cheaper than wind stand-
alone system before breakeven distance 3,125 km, and after that the wind stand-alone
system is less in cost.
By comparing the systems at diesel price 0.40 $/L, 0.60 $/L and 0.80 $/L the grid
extension distance is in negative values (-6,508, -17838 and -30,957 prospectively),
which indicates to the grid extension is expensive than wind stand-alone system, which
indicating to that wind stand-alone system optimal to implemented.
In conclusion, the economically sound system is wind stand-alone system than grid
extension with all diesel cost used in the study, and is optimal to use.

110
Figure 6.19:
Breakeven grid extension distances for wind HES for Brak City at sensitivity
variable of wind speed 4.3 m/s and with different diesel price categories
6.2.5. Conclusion
The study results of this scenario concluded that there is a high prospect and feasibility for
establishing wind HES in region, whether wind stand-alone system or wind grid-connected
system as well as its cost-effectiveness for using such technology. The COE that resulted
from using wind energy technology was 0.097 $/kWh to 0.289 $/kWh for all feasible
system categories that were tested in the design, and the renewable fraction varied from
28% to 67%. Moreover, the comparison of COE for all design categories indicates that the
grid-connected systems are lower in cost than stand-alone systems at all sensitivity
variables, as illustrated in Figure 6.20. In addition, the COE at average wind speed at the
Breakeven Grid Extension Distance:
-17,838 Km
Diesel Price:
0.60 $/L
Breakeven Grid Extension Distance:
3,125 Km
Diesel Price:
0.20 $/L
Breakeven Grid Extension Distance:
-6,508 Km
Diesel Price:
0.40 $/L
Breakeven Grid Extension Distance:
-30,957 Km
Diesel Price:
0.80 $/L

111
site and at current diesel cost in Libya is low-cost compared to the COE in the existing
energy system of Libya, where the OST configuration is wind/DG/battery/converter and
grid/wind/DG in stand-alone system and grid-connected system respectively.
The system configuration and its structure are represented in the schematic diagram in
Figure 6.21, which reflects the results of the simulation process related to wind HES for
Brak City. To conclude, the use of such technology is sound in terms of cost-effectiveness
whether in stand-alone system or grid-connected system as well as being more
environmentally conservative than the existing energy system in the region, with the share
of RE being at least 28% in the system. Additionally to, the design is meets the electricity
demand of Brak City region.
Figure 6.20: Comparison of COE for wind HES categories for Brak City
0.000 0.100 0.200 0.300 0.400
0.2
0.4
0.6
0.8
0.2
0.4
0.6
0.8
0.2
0.4
0.6
0.8
3.9
3.9
3.9
3.9
4.3
4.3
4.3
4.3
5.2
5.2
5.2
5.2
COE ($/kWh)
Sensitivity Variables: Wind Speed (m/s) and Diesel Price ($/L)
respectively
COE for Wind HES Categories
Stand-Alone System
Grid-Connected System

112
Figure 6.21: Schematic configurations for wind HES categories for Brak City
6.3. Scenario III: Design Solar and Wind Hybrid Energy System for Electricity
Supply to Brak City
6.3.1. Scenario III: Concept Formulation
Solar energy and wind energy technologies have been used in this scenario in order to
design the HRES for Brak City, which operates by solar, wind and diesel as the main
sources of energy. The system is a combination of PV module, wind turbines and DG.
Similarly to the other scenarios, the design was into configured two styles, the first design
focused on a solar and wind stand-alone system, while the second design concentrated on a
solar and wind grid-connected system in order to meet the electricity demand in Brak City.
The scenario objectives were to find out and explore the following:
Is it cost-effective to use both solar and wind energy technology in region?
To identify the gained COE from the scenario.
Which most cost-effective system to use in the region, solar and wind stand-alone
system or solar and wind grid-connected system?
What OST configurations in solar and wind stand-alone system, solar and wind grid-
connected system?
Wind Stand-Alone System
Wind Grid-Connected System
113
If the design meets the electricity demand for Brak City.
Thus to realize these objectives a total of 22,464 systems designs (see Appendix 5,
paragraph 16) were tested and simulated, in addition to 36 sensitivity variables that were
used in the design. Also, in this scenario the sensitivity study was conducted through three
dimensions, where in the first dimension four variables of diesel price were used, in the
second dimension three variables for solar radiation, and three variables for wind speed in
the third dimension. The components’ quantity and the size winner relevant to the design of
the solar and wind HES are represented in Appendix 6, paragraph 3 (the objectives answer
presented in paragraph 6.3.5).
6.3.2. Result Analysis of Solar and Wind Stand-Alone System
6.3.2.1. Optimization Results
The OST for solar and wind stand-alone HES for Brak City at solar radiation 5.7
kWh/m2/d, wind speed 4.3 m/s and diesel price of 0.20 $/L is
PV/wind/DG/battery/converter as shown in Figure 6.22, these attributes represent the
optimization results of the system. The optimization results indicates that to be the most
cost-effective the use of wind energy technology in the design outperforms of used both
technologies in the design, wherein the solar and wind system comes in fourth rank after
the wind-diesel system, solar-diesel system and wind-diesel system without battery
respectively. On the other hand, the solar and wind system has a renewable fraction more
than other systems which accounts for 51% at COE of 0.164 $/kWh, because the system
produces the energy from both technologies while confined in one technology in other
systems. Likewise in other scenarios, the CC dispatch strategy is the optimal strategy in the
system configuration.

114
Figure 6.22:
Optimization results for solar and wind stand-alone HES for Brak City at
sensitivity variables of solar radiation 5.7 kWh/m2/d, wind speed 4.3 m/s and
diesel price 0.20 $/L
6.3.2.2. Simulation Results of Energy Production of the Optimal System.
The simulation results for solar and wind stand-alone HES shows that the system meets the
load demand and has no capacity shortage, but the excess of electricity through system
components is very high, representing 11.3%, as clarified in Figure 6.23. The electricity
produced by renewable technology represents 58% in the system (36% by wind turbine and
22% from PV module).
Figure 6.23:
Simulation results for solar and wind stand-alone HES for Brak City at solar
radiation 5.7 kWh/m2/d, wind speed 4.3 m/s and diesel price 0.20 $/L

115
6.3.2.3. Sensitivity Results
The sensitivity results of the solar and wind stand-alone HES design concluded that the
OST configuration for all sensitivity variables used in the design is
wind/DG/battery/converter as shown in Figure 6.24. Also, system configuration does not
influenced by increasing fuel price, solar radiation density and wind speed. Except at a
sensitivity variable of solar radiation 6.37 kWh/m2/d, wind speed 3.9 m/s and diesel price
0.80 $/L, where the OST is PV/wind/DG/battery/converter as illustrated in Figure 6.25a,
and Figure 6.25b respectively. This indicates and concluded that wind energy most cost-
effective to use than solar energy or both technologies in the design. The optimal dispatch
strategy is CC overall system components sizes as well as the sensitivity variables used in
the design. Also, here the system components size does not changing in DG, battery and
converter, while is changing in number of wind turbines needed in the design, in case of
diesel price at 0.60 $/L and 0.80 $/L. This is may be refer to, in case of rising the diesel
price the system prefer to produce the electricity from wind turbine, because it is
economically than producing from diesel generators.
Figure 6.24:
Sensitivity results and OST for solar and wind stand-alone HES for Brak City
with superimposed LCOE and diesel price of 0.20 $/L

116
Figure 6.25a:
Sensitivity result categories for solar and wind stand-alone HES for Brak
City (10 of 36 sensitivity variables)
Figure 6.25b:
Sensitivity result categories for solar and wind stand-alone HES for Brak
City (26 of 36 sensitivity variables)

117
6.3.3. Result Analysis of Solar and Wind Grid-Connected System
6.3.3.1. Optimization Results
The optimization results for solar and wind grid-connected HES for Brak City result in
average of renewable sources in the site indicating that the OST is
Grid/PV/wind/DG/converter as shown in Figure 6.26. The system gives COE 0.147 $/kWh
with renewable fraction 52%, and comes in seventh rank from a total of 12 feasible systems
in cost, with CC of dispatch strategy.
Figure 6.26:
Optimization results for solar and wind grid-connected HES for Brak City at
sensitivity variables of solar radiation 5.7 kWh/m2/d, wind speed 4.3 m/s and
diesel price 0.20 $/L
6.3.3.2. Simulation Results of Energy Production of the Optimal System
The simulation results for solar and wind grid-connected HES indicates that the system
meets the load demand and has no capacity shortage, as shown in Figure 6.27. The system
produces 65% of total electricity from renewable technology, but the excess electricity
through system components is very high, accounting 12%.

118
Figure 6.27:
Simulation results for solar and wind grid-connected HES for Brak City at
solar radiation 5.7 kWh/m2/d, wind speed 4.3 m/s and diesel price 0.20 $/L
6.3.3.3. Sensitivity Results
The sensitivity results of design solar and wind grid-connected HES show that the OST is
grid/wind/DG for all sensitivity variables as illustrated in Figure 6.28a, Figure 6.28b,
Figure 6.28c and Figure 6.28d. Now even in case of high solar radiation it is always more
economically not to use PV panels. In case of grid connection led this sensitivity study to
the same results as gained in scenario II.
Figure 6.28a:
Sensitivity result categories for solar and wind grid-connected HES for Brak
City at diesel price 0.20 $/L

119
Figure 6.28b:
Sensitivity result categories for solar and wind grid-connected HES for Brak
City at diesel price 0.40 $/L
Figure 6.28c:
Sensitivity result categories for solar and wind grid-connected HES for Brak
City at diesel price 0.60 $/L
Figure 6.28d:
Sensitivity result categories for solar and wind grid-connected HES for Brak
City at diesel price 0.80 $/L
6.3.4. Breakeven Grid Extension distance of Solar and Wind Hybrid Energy
System
Similar to other scenarios, the study was conducted on a breakeven grid extension distance,
indicated by comparing the solar and wind stand-alone system costs with grid extension

120
cost, where influenced with varying diesel price. The results for grid extension distance in
each of the diesel price variables are represented in Figure 6.29 and can be concluded in the
following:
The cost of the grid extension in diesel price 0.20 $/L (and system configuration 4 of
Figure 6.22) up to a distance of 11,986 km is the less expensive, after which the solar
and wind stand-alone system is costs less.
Comparing the systems in terms of diesel price 0.40 $/L, 0.60 $/L and 0.80 $/L, the
grid extension distance also resulted here in a negative value, which indicates that the
grid extension is expensive than a solar and wind stand-alone system.
Figure 6.29:
Breakeven grid extension distance for solar and wind HES for Brak City at solar
radiation 5.7 kWh/m2/d, wind speed 4.3 m/s and with different diesel price
categories
Breakeven Grid Extension Distance:
-13,856 Km
Diesel Price:
0.60 $/L
Breakeven Grid Extension Distance:
11,986 Km
Diesel Price:
0.20 $/L
Breakeven Grid Extension Distance:
-1,165 Km
Diesel Price:
0.40 $/L
Breakeven Grid Extension Distance:
-29,101 Km
Diesel Price:
0.80 $/L
121
6.3.5. Conclusion
The study concludes from this scenario that the design for solar and wind HES is non-
feasible, and that use of both technologies in one system is not cost-effective in this region.
Consequently, the sensitivity analysis results from this scenario leads to the same outcome
as scenario II, where wind energy is the most cost-effective technology to use in the region,
instead of combining these technologies in one system whether stand-alone or grid-
connected (as shown in Figure 6.26, Figure 6.28a, Figure 6.28b, Figure 6.28c and Figure
6.28d).
To the questions posted in section 6.3.1; the COE gained from using both technologies in
one system: the cost rates are between 0.134 $/kWh to 0.295 $/kWh in stand-alone system
and from 0.134 $/kWh to 0.295 $/kWh in grid-connected system (see, results in Appendix
5 paragraph 18). Also, here comparable to other scenarios, the COE in grid-connected
systems are lower in cost than stand-alone systems in all design categories at all sensitivity
variables, as shown. Furthermore, the OST resulting from the simulation process is
PV/wind/DG/battery/converter for the stand-alone system and grid/PV/wind/DG in the
grid-connected system.
In summary, the study concluded that using both technologies in the design is not cost-
effective, and should accordingly be avoided.
6.4. Comparison the Cost of Energy of Scenarios
The comparison of the COE for all scenario categories, at average solar radiation and wind
speed, with sensitivity variables for diesel price is illustrated in Table 6.1 (see, solar and
wind HES values in Figure 6.22, Figure 6.26 and Appendix 5, paragraph 18). A resulting in
the conclusion that the use of wind HES is most economical versus solar HES or solar and
wind HES overall diesel price levels, whether in case of stand-alone systems or in grid-
connected systems as shown in Figure 6.32 and Figure 6.33 respectively.

122
Table 6.1:
Rank of COE for all system categories of the scenarios at average renewable
sources at the site of Brak City HRES with different diesel prices
System
type
Sensitivity variables
COE ($/kWh)
Rank
Solar
(kWh/m²/d)
Wind
(m/s)
Diesel
($/L)
Stand-alone
system
Grid-
connected
system
Stand-alone
system
Grid-
connected
system
Solar HES
5.7
-
0.2
0.153
0.137
11
11
5.7
-
0.4
0.209
0.189
7
7
5.7
-
0.6
0.262
0.240
3
3
5.7
-
0.8
0.317
0.289
1
1
Wind HES
-
4.3
0.2
0.139
0.113
12
12
-
4.3
0.4
0.185
0.156
9
9
-
4.3
0.6
0.227
0.196
6
6
-
4.3
0.8
0.264
0.231
2
4
Solar and
wind HES
5.7
4.3
0.2
0.164
0.147
10
10
5.7
4.3
0.4
0.200
0.180
8
8
5.7
4.3
0.6
0.238
0.213
4
5
5.7
4.3
0.8
0.269
0.245
4
2
Figure 6.30:
Comparison of COE for stand-alone systems of scenarios at different diesel
prices
0.00
0.05
0.10
0.15
0.20
0.25
0.30
0.35
Diesel Price
0.20 $/L
Diesel Price
0.40 $/L
Diesel Price
0.60 $/L
Diesel Price
0.80 $/L
COE ($/kWh)
Diesel Price
COE for Stand-Alone Systems and Different Diesel Prices
Scenario I
Scenario II
Scenario III

123
Figure 6.31:
Comparison of COE for grid-connected systems of scenarios at different
diesel prices
6.5. Summary of Findings
In the IRENA - study (2015a, p.94 and p.73) the typical COE-range had been calculated
between 0.08 $/kWh to 0.50 $/kWh in solar PV system and between 0.045 $/kWh to 0.14
$/kWh in wind-onshore system in 2014. It was found to be within this global level ranges.
The key findings of this study can summarized as following:
The most cost-effective viable technology to use in the area is wind energy, whether in
stand-alone systems or grid-connected systems overall diesel price that has been used in
study scenarios.
The OST in the case of solar energy technology usage in the region is
PV/DG/battery/converter for the stand-alone system, and grid/solar/DG/ converter for
the grid-connected system.
In the case of wind energy technology usage in the region, the OST configuration is
wind/DG/battery/converter for the stand-alone system, and grid/wind/DG for the grid-
connected system.
0.00
0.05
0.10
0.15
0.20
0.25
0.30
0.35
Diesel Price
0.20 $/L
Diesel Price
0.40 $/L
Diesel Price
0.60 $/L
Diesel Price
0.80 $/L
COE ($/kWh)
Diesel Price
COE for Grid-Connected Systems and Different Diesel Prices
Scenario I
Scenario II
Scenario III
124
By using both solar and wind energy technologies in the design, the OST is
PV/wind/DG/battery/converter for the stand-alone system, and grid/PV/wind/DG/
converter for the grid-connected system. But that lead to higher COE than using wind
turbines only.
The grid-connected systems are more sustainable economically and environmentally,
and meet the electricity demand for Brak City society.
The optimal dispatch strategy is CC for all scenario categories at an average of
sensitivity variables, as well as a majority of the feasible systems, whether stand-alone
systems or grid-connected systems, which indicates that CC is better than LF strategy.
In summary, implementing such as these technologies can be contributing partly to solving
the problem of electricity outage facing the present energy system in Brak City as well as
in Libya in sustainable energy manner instead of the current fossil energy sources.

125
7. Vision for Implementing Renewable Energy Technologies in Libya
7.1. Outlook of Implementing Solar and Wind Energy in Other Regions of Libya
Regarding the outlook for implementing solar and wind energy technologies in other
regions of the country: Based on the case study that has been conducted in order to design
HRES in the Brak City region, as well as on the scenario results (clarifying the potential for
RE technologies in this region as well as other regions of Libya), the scope of further
studies can be expanded to additional regions of Libya. The outlook of the optimal RET
that can be used in each region of Libya has been determined based on approximate design
criteria - not adjusted to real district energy requirements because the populations as well as
energy load differ from region to region47 (See the districts details and results in Appendix
7). Because of that, not surprising that some districts have similar COE.
The results of the simulation process concluded in Figure 7.1 indicate the optimal RET to
use in each region, is wind energy at a range of diesel price levels, in stand-alone HRES
operation by solar and wind energy technologies. Also, in the case of grid-connected
HRES, the optimal RET is wind energy at all diesel price levels; indicating that increasing
fuel price has no substantial effect on the type of optimal technology as shown in Figure
7.2. Even in the south of Libya, where the solar radiation value is high, wind energy
technology is still optimal.
In summary, the optimal RET to implement does not vary by geography or diesel cost.
There is no effect in the case of using for stand-alone energy systems or grid-connected
energy systems as shown in Figure 7.3, where wind energy technology is the optimal in all
categories. The COE overall regions of Libya varies from 0.121 to 0.286 $/kWh in stand-
alone systems, and ranges from 0.096 to 0.254 $/kWh in grid-connected systems in all
categories. Accordingly, the grid-connected system is cheaper. Although Libyan districts
47 The criteria designed based on the average of RE sources of districts of Libya, and application the
scenarios parameters in the same procedure used in the case study with consideration of the diesel price levels
in order to specify the optimal RET to use in each region. Also, in the consideration to satisfy the same
energy load value used in Brak City energy system, and simulate HOMER based on this energy load.

126
exhibit variations in the fine details of RE sources, implementation of these technologies is
feasible and viable in all regions of the country.
Libya Districts with their COE ($/kWh)
22
0.135
0.178
0.218
0.253
Technology Type
21
0.146
0.184
0.223
0.259
Wind Energy
20
0.144
0.181
0.218
0.254
19
0.139
0.185
0.227
0.264
18
0.150
0.191
0.232
0.271
17
0.152
0.193
0.235
0.275
16
0.152
0.193
0.235
0.275
15
0.152
0.193
0.235
0.276
14
0.151
0.192
0.234
0.274
13
0.149
0.189
0.230
0.268
12
0.149
0.197
0.233
0.268
11
0.149
0.197
0.233
0.268
10
0.140
0.186
0.229
0.267
9
0.149
0.189
0.230
0.268
8
0.145
0.182
0.220
0.255
7
0.132
0.174
0.212
0.246
6
0.153
0.195
0.237
0.279
5
0.121
0.155
0.187
0.215
4
0.121
0.155
0.187
0.215
3
0.153
0.195
0.237
0.279
2
0.149
0.188
0.229
0.267
1
0.155
0.199
0.243
0.286
0.20
0.40
0.60
0.80
Diesel Price $/L
Figure 7.1:
Outlook of the optimal RET to use for each district of Libya at various diesel
price levels with COE related to establishing stand-alone HRES

127
Libya Districts with their COE ($/kWh)
22
0.110
0.150
0.188
0.222
Technology Type
21
0.112
0.154
0.193
0.227
Wind Energy
20
0.110
0.151
0.189
0.223
19
0.113
0.156
0.196
0.231
18
0.115
0.159
0.201
0.238
17
0.116
0.161
0.204
0.242
16
0.116
0.162
0.204
0.242
15
0.116
0.162
0.204
0.242
14
0.116
0.161
0.203
0.241
13
0.114
0.158
0.199
0.236
12
0.114
0.158
0.199
0.236
11
0.114
0.158
0.199
0.236
10
0.114
0.158
0.199
0.235
9
0.114
0.158
0.199
0.236
8
0.110
0.151
0.190
0.224
7
0.107
0.146
0.182
0.214
6
0.117
0.163
0.207
0.245
5
0.096
0.129
0.159
0.185
4
0.096
0.129
0.159
0.185
3
0.117
0.163
0.207
0.245
2
0.114
0.158
0.200
0.236
1
0.120
0.168
0.214
0.254
0.20
0.40
0.60
0.80
Diesel Price $/L
Figure 7.2:
Outlook of the optimal RET to use for each district of Libya at various diesel
price levels with COE related to establishing grid-connected HRES

128
Figure 7.3:
Libya outlook map for optimal RET to use in each district of Libya at diesel
price 0.20 $/L, 0.40 $/L, 0.60 $/L and 0.80 $/L, related to establishing stand-
alone HRES as well as grid-connected HRES
7.2. Role of Using Renewable Energy Technologies in Energy System of Libya
From the case study key findings related to use the solar and wind energy in Brak City
region and the outlook of implementation such as those technologies in other regions of the
country. Also, for the problems that discussed previously (in paragraph 1.1) which are
facing current energy system of Libya could conclude the role of using the RE technologies
in Libya.
The implementation of RE technologies in a variety of applications may lead to an active
role and improve the performance of the energy sector as well as overcoming the current
problems facing Libyan energy system in both local and global level. Implementation of
wind energy in application of stand-alone system and grid-connected system can enable
Libya’s partly to overcome the outage of electricity. Other role for implementing RE
technologies related to economic progress, that electricity import can be reduced and
129
implementing strategic development option long-term in order to exporting the electricity,
which will contribute effectively in economic progress. Regarding the environment
prospective, the CO2 emission from the current conventional generating technologies can
be gradually reduced. The implementations will enable Libya to participate with world
communities for the first time at the global climate protection level.
In summary, the using of RE technologies in variety of application in Libya can be lead an
active role toward the development of energy sector and fill partly or as first step the
insufficiency in electricity production facing Libya in present time.
130
8. Conclusion
8.1. Conclusion
The objective of this thesis is implementation of RE technologies in the Libyan energy
system in order to overcome the problems and insufficiency in energy capacity facing the
current energy system by using alternative energy instead of present fossil energy
resources. To achieve this objective, a case study to design HRES in the Brak City region
has been conducted in several scenarios and system configurations.
From the assessment the existing energy system and by determining the causes hindering
development of this sector, it can be concluded that the present energy system of Libya is
non-sustainable. It does not meet Libyan energy demands whether economic,
environmental, or societal. Beyond the national level, expectations to act with energy
policy against climate changes are unfulfilled. Therefore the existing capacity does not
meet peak load requirements, and causing outages in electricity supply for several hours,
up to days in some regions of the country. Additionally, the environmental impact of CO2
emissions from conventional generating technologies used, dependent on oil and gas as
primary energy sources, is an issue.
The task posted in the thesis is identifying the challenges and opportunities for
development of the Libyan energy sector. This concluded in the most pressing challenges:
increasing energy demand versus inability of the current installed power capacity to meet
this demand now and in the foreseeable future. Of importance here are inefficient
generating technologies with high electrical losses due to transmission and distribution
processes. The policy of the government is nowadays one of the most major challenges,
where centralization in decision-making, and investment law making in particular, is
hindering RET-based development. In the context of the described opportunities, upgrading
the energy infrastructure and optimising the energy transmission and distribution systems
would substantially contribute to development. However, the greatest opportunity lies in
implementing sustainable RE technologies.
131
Libya has considerable RE resources; especially solar and wind energy. Other RE
technologies such as biomass energy and geothermal energy have lower potential in Libya,
because lack of the resources. Priority is given here to solar energy and wind energy and by
case study is analysed, where the availability of resources making the implementation of
such technologies possible.
Accordingly, by use of solar and wind energy is designed a HRES for Brak City region.
This is then enlarged to other regions of Libya in order to develop the energy system more
sustainable. The scenario analysis shows that RET have an active role and advantages in
the present and in the future (i.e. long-term use), where the COE is cost-effective and
competitive to the current COE. But this is only true for a RE share between 21% and 67%.
With increased diesel price, RET would be increasingly viable, especially in use of wind
energy where COE is lower as for PV technology. Also, RET in a grid-connected system is
more effective than stand-alone system application. In case of use solar energy in the
design of Brak City HRES, the COE is 0.151 $/kWh to 0.335 $/kWh in a solar stand -alone
system and from 0.134 $/kWh to 0.299 $/kWh in a solar grid-connected system. In case of
use wind energy technology in the design, the COE is 0.122 $/kWh to o.289 $/kWh in a
stand-alone system and between 0.097 $/kWh to 0.256 $/kWh in a grid-connected system.
On the other hand, the share of RE is 0.21% to 0.36% in solar stand-alone system, and
from 0.23% to 0.31% in solar grid-connected system, while it is 0.28% to 0.67% in wind
stand-alone system and from 0.29% to 0.62 in wind grid-connected system.
Regarding the co-use of solar and wind energy technology in the design of Brak City
HRES, this is not cost-effective as well as not optimal to be implemented in one system as
concluded from the study of scenario III. Therefore, the combination of solar and wind
energy technologies is not beneficial and should be avoided.
In summary, RET is the most sustainable way to develop the Libyan energy sector. It can
feasibly and viably contribute to solving the currently problems facing this sector.
Implementation of these technologies would deliver advantages for the Libyan
132
environment, economy, and society. Further, this would contribute to climate-political
requirements at the global level. As closing words for this work, Libya’s energy future lies
in renewable.

133
Appendixes
Appendix 1: Administrative Districts of Libya (shabiyaat)
Table districts of Libya with solar and wind energy resources
Nr.
Name of district
Population
Coordinates
Average Renewable source
Latitude
Longitude
Solar irradiation
(kWh/m2/d)
Wind speed
(m/s)
N
E
1
Butnan
159,536
30
24
5.58
3.9
2
Derna
163,351
32.5
22.666
5.27
4.2
3
Jabal al Akhdar
203,156
30.766
21.733
5.62
4.0
4
Marj
185,848
32.5
20.833
5.44
5.2
5
Benghazi
670,797
32.116
20.066
5.44
5.2
6
Al Wahat
177,047
30
22
5.6
4.0
7
Kufra
50,104
24
23
6.37
4.6
8
Sirte
141,378
31.204
16.587
5.65
4.4
9
Misrata
550,938
32.366
12.083
5.32
4.2
10
Murqub
432,202
32.65
14.266
4.92
4.2
11
Tripoli
1,065,405
32.65
13.316
5.11
4.2
12
Jafara
453,198
32.15
13
5.11
4.2
13
Zawiya
290,993
32.75
12.716
5.32
4.2
14
Nuqat al Khams
287,662
32.594
11.894
5.42
4.1
15
Jabal al Gharbi
304,159
31.75
12.5
5.36
4.1
16
Nalut
93,224
31.866
11
5.42
4.1
17
Jufra
52,342
28
17
5.57
4.1
18
Wadi al Shatii
78,532
28
13
5.68
4.2
19
Sabha
134,162
27.033
14.433
5.7
4.3
20
Wadi al Hayaa
76,858
26.25
12.5
5.9
4.5
21
Ghat
23,518
25.333
11
5.89
4.4
22
Murzuq
78,621
25.9
13.9
6.27
4.5

134
Appendix 2: Determine Energy Demand for Brak City
1- Libya's Population Growth Rate
Table of population growth rate in Libya for 10 years (2003-2012)
Item
Year
Growth rate %
1
2003
1.5
2
2004
1.5
3
2005
1.6
4
2006
1.6
5
2007
1.7
6
2008
1.6
7
2009
1.5
8
2010
1.3
9
2011
1.0
10
2012
0.8
Average
1.4
Calculation formula48:
Where:
PR = Percent Rate.
VPresent = Present.
VPast = Past.
2- Growth Rate of Electricity Consumption Per Capita in Libya
Table of growth rate for electricity consumption per capita in Libya for 8 years (2003-
2010), (see also Figure 2.7 in paragraph 2.2.3).
48The calculation formula from http://pages.uoregon.edu/rgp/PPPM613/class8a.htm , online accessed date
[30th March 2014].
Number
Year
Electricity consumption
per capita (kWh)
Growth rate %
0
2002
2,871
-
1
2003
3,055
6.4
2
2004
3,221
5.4
3
2005
3,553
10.3
4
2006
3,969
11.7
5
2007
4,158
4.8

135
3- Electricity Load for Brak City HRES
The table illustrates the calculation details for expected required electricity loads to design
Brak City HRES that designed to operate in 2017, which have been determined by
considering only the average increase of population and electricity consumption per capita
(see above).
Number
Year
Population
growth rate
(=1.4% ann.)
Electricity consumption
growth rate (kWh per
capita). (= 2% ann.)
Energy demand
(kWh/yr)
1
2012
82505
4,850
400,149,250
2
2013
83660
4,947
413,866,020
3
2014
84831
5,046
428,057,226
4
2015
86019
5,147
442,739,793
5
2016
87223
5,250
457,920,750
6
2017
88444
5,355
473,617,620
4- Monthly Load of Libya's Electricity Network in 2012
The table represents the monthly load values of Libya's electricity network in 2012, which
has been used in order to determine the primary monthly load of HRES for Brak City,
where the average monthly load values have been used in the design.
Month
Max. Load
(kW)
Min. Load
(kW)
Ave. Load
(kW)
Monthly load
percentage %
Jan
5,560,000
3,200,000
4,380,000
9.13
Feb
5,627,000
2,388,000
4,007,500
8.35
Mar
4,925,000
2,205,000
3,565,000
7.43
Apr
3,850,000
2,080,000
2,965,000
6.18
May
4,355,000
2,307,000
3,331,000
6.94
Jun
5,300,000
2,638,000
3,969,000
8.27
Jul
5,740,000
3,851,000
4,795,500
9.99
Aug
5,981,000
3,807,000
4,894,000
10.2
Sep
5,595,000
3,135,000
4,365,000
9.1
Oct
5,250,000
3,408,000
4,329,000
9.02
Nov
4,220,000
2,201,000
3,210,500
6.69
Dec
5,810,000
2,547,000
4,178,500
8.7
Sum
47,990,000
100
6
2008
4,360
4.9
7
2009
4,602
5.6
8
2010
4,651
1.1
Average
6.3

136
5- Daily Load of Libya's Electricity Network in 2008
The table represents the daily load values of Libya's electricity network in 2008, which has
been used in order to determine hourly average percentages values based on the average
daily load value.
Hour
Max. Load
(kW)
Min. Load
(kW)
Ave. Load
(kW)
Hourly energy
percentage %
1
4,050,000
2,400,000
3,225,000
3.92
2
3,750,000
2,290,000
3,020,000
3.67
3
3,580,000
2,070,000
2,825,000
3.43
4
3,600,000
2,085,000
2,842,500
3.45
5
3,530,000
1,920,000
2,725,000
3.31
6
3,600,000
2,200,000
2,900,000
3.52
7
3,730,000
2,440,000
3,085,000
3.75
8
3,830,000
2,740,000
3,285,000
3.99
9
3,970,000
2,860,000
3,415,000
4.15
10
4,030,000
2,960,000
3,495,000
4.25
11
4,050,000
3,050,000
3,550,000
4.31
12
4,040,000
3,030,000
3,535,000
4.29
13
4,240,000
2,980,000
3,610,000
4.38
14
4,260,000
2,900,000
3,580,000
4.35
15
4,250,000
2,800,000
3,525,000
4.28
16
4,190,000
2,790,000
3,490,000
4.24
17
4,330,000
2,940,000
3,635,000
4.42
18
4,350,000
3,030,000
3,690,000
4.48
19
4,370,000
3,200,000
3,785,000
4.6
20
4,410,000
3,510,000
3,960,000
4.81
21
4,750,000
3,300,000
4,025,000
4.89
22
4,650,000
3,250,000
3,950,000
4.8
23
4,400,000
2,960,000
3,680,000
4.47
24
4,240,000
2,750,000
3,495,000
4.24
Sum
100
6- Distributions Load of System
This table illustrates the details of distribution energy load for the both monthly and daily
load, where calculated based on the load percentage that has been determined in the
preceding steps.
A- Monthly Load of System
Month
Monthly
distribution
load %
Yearly load
of system
(kWh/yr)
Monthly load
of system
(KWh/mon.)
Month days
Daily load of
system (kWh/d)
Jan
9.13
473,617,620
43,241,289
31
1,394,880

137
Feb
8.35
473,617,620
39,547,071
28
1,412,395
Mar
7.43
473,617,620
35,189,789
31
1,135,154
Apr
6.18
473,617,620
29,269,569
30
975,652
May
6.94
473,617,620
32,869,063
31
1,060,292
Jun
8.27
473,617,620
39,168,177
30
1,305,606
Jul
9.99
473,617,620
47,314,400
31
1,526,271
Aug
10.2
473,617,620
48,308,997
31
1,558,355
Sep
9.1
473,617,620
43,099,203
30
1,436,640
Oct
9.02
473,617,620
42,720,309
31
1,378,074
Nov
6.69
473,617,620
31,685,019
30
1,056,167
Dec
8.7
473,617,620
41,204,733
31
1,329,185
Sum
100
473,617,620
365
15,568,673
Average
39,468,135
1,297,389
B- Daily Load of System
Hour
Daily/
hourly
distribution
load %
Hourly load in each month (kW)
Jan
Feb
Mar
Apr
May
Jun
1
3.92
54,679
55,366
44,498
38,246
41,563
51,180
2
3.67
51,192
51,835
41,660
35,806
38,913
47,916
3
3.43
47,844
48,445
38,936
33,465
36,368
44,782
4
3.45
48,123
48,728
39,163
33,660
36,580
45,043
5
3.31
46,171
46,750
37,574
32,294
35,096
43,216
6
3.52
49,100
49,716
39,957
34,343
37,322
45,957
7
3.75
52,308
52,965
42,568
36,587
39,761
48,960
8
3.99
55,656
56,355
45,293
38,929
42,306
52,094
9
4.15
57,888
58,614
47,109
40,490
44,002
54,183
10
4.25
59,282
60,027
48,244
41,465
45,062
55,488
11
4.31
60,119
60,874
48,925
42,051
45,699
56,272
12
4.29
59,840
60,592
48,698
41,855
45,487
56,010
13
4.38
61,096
61,863
49,720
42,734
46,441
57,186
14
4.35
60,677
61,439
49,379
42,441
46,123
56,794
15
4.28
59,701
60,451
48,585
41,758
45,381
55,880
16
4.24
59,143
59,886
48,131
41,368
44,956
55,358
17
4.42
61,654
62,428
50,174
43,124
46,865
57,708
18
4.48
62,491
63,275
50,855
43,709
47,501
58,491
19
4.6
64,164
64,970
52,217
44,880
48,773
60,058
20
4.81
67,094
67,936
54,601
46,929
51,000
62,800
21
4.89
68,210
69,066
55,509
47,709
51,848
63,844
22
4.8
66,954
67,795
54,487
46,831
50,894
62,669
23
4.47
62,351
63,134
50,741
43,612
47,395
58,361
24
4.24
59,143
59,886
48,131
41,368
44,956
55,358
Average hourly load
58,120
58,850
47,298
40,652
44,179
54,400

138
Hour
Daily/
hourly
distribution
load %
Hourly load in each month (kW)
Jul
Aug
Sep
Oct
Nov
Dec
1
3.92
59,830
61,088
56,316
54,021
41,402
52,104
2
3.67
56,014
57,192
52,725
50,575
38,761
48,781
3
3.43
52,351
53,452
49,277
47,268
36,227
45,591
4
3.45
52,656
53,763
49,564
47,544
36,438
45,857
5
3.31
50,520
51,582
47,553
45,614
34,959
43,996
6
3.52
53,725
54,854
50,570
48,508
37,177
46,787
7
3.75
57,235
58,438
53,874
51,678
39,606
49,844
8
3.99
60,898
62,178
57,322
54,985
42,141
53,034
9
4.15
63,340
64,672
59,621
57,190
43,831
55,161
10
4.25
64,867
66,230
61,057
58,568
44,887
56,490
11
4.31
65,782
67,165
61,919
59,395
45,521
57,288
12
4.29
65,477
66,853
61,632
59,119
45,310
57,022
13
4.38
66,851
68,256
62,925
60,360
46,260
58,218
14
4.35
66,393
67,788
62,494
59,946
45,943
57,820
15
4.28
65,324
66,698
61,488
58,982
45,204
56,889
16
4.24
64,714
66,074
60,914
58,430
44,781
56,357
17
4.42
67,461
68,879
63,499
60,911
46,683
58,750
18
4.48
68,377
69,814
64,361
61,738
47,316
59,547
19
4.6
70,208
71,684
66,085
63,391
48,584
61,143
20
4.81
73,414
74,957
69,102
66,285
50,802
63,934
21
4.89
74,635
76,204
70,252
67,388
51,647
64,997
22
4.8
73,261
74,801
68,959
66,148
50,696
63,801
23
4.47
68,224
69,658
64,218
61,600
47,211
59,415
24
4.24
64,714
66,074
60,914
58,430
44,781
56,357
Average hourly
load
63,595
64,931
59,860
57,420
44,007
55,383

139
Appendix 3: Project Locations Characteristics and Data
Selected Location
Number
Location name
Location coordinates
Latitude
Longitude
1
Ashkida
27.567
14.498
2
Brak
27.682
14.264
3
Tamazawa
27.631
14.087
4
Getta
27.496
14.123
5
Bergin
27.633
13.630
6
Adri
27.545
13.456
7
Wenzreek
27.478
13.170
Location 1: Ashkida
Item
Unit
Climate data location
Latitude
°N
27.567
Longitude
°E
14.264
Elevation
m
491
Heating design temperature
°C
4.52
Cooling design temperature
°C
37.83
Earth temperature amplitude
°C
25.35
Frost days at site
day
0
Month
Air temperature
°C
Relative
humidity
%
Daily solar
radiation -
horizontal
kWh/m2/d
Atmospheric
pressure
kPa
Wind speed
m/s
Earth
temperature
°C
Heating degree-
days
°C-d
Cooling degree-
days
°C-d
Jan
10.8
44.8%
3.56
96.4
4.0
12.1
216
49
Feb
12.8
36.8%
4.68
96.3
4.2
14.7
146
89
Mar
17.5
29.3%
5.86
96.0
4.5
20.2
47
246
Apr
23.0
22.8%
6.66
95.6
4.8
26.2
5
401
May
27.7
21.4%
6.79
95.6
4.9
31.2
0
552
Jun
31.0
20.0%
7.62
95.7
4.6
35.0
0
628
Jul
31.1
20.9%
7.78
95.7
4.5
35.7
0
648
Aug
31.0
22.5%
7.12
95.7
4.2
35.4
0
648
Sep
29.4
24.7%
6.12
95.8
4.1
32.8
0
588
Oct
23.9
30.3%
5.20
96.0
4.0
26.5
1
442
Nov
17.6
35.4%
3.81
96.2
3.9
19.3
38
237
Dec
12.3
42.5%
3.17
96.4
3.9
13.4
171
87
Annual
22.3
29.3%
5.70
96.0
4.3
25.2
624
4615
Measured
at (m)
10.0
0.0
Location 2: Brak
Item
Unit
Climate data location
Latitude
°N
27.682

140
Longitude
°E
14.264
Elevation
m
491
Heating design temperature
°C
4.52
Cooling design temperature
°C
37.83
Earth temperature amplitude
°C
25.35
Frost days at site
day
0
Month
Air temperature
°C
Relative humidity
%
Daily solar
radiation -
horizontal
kWh/m2/d
Atmospheric
pressure
kPa
Wind speed
m/s
Earth
temperature
°C
Heating degree-
days
°C-d
Cooling degree-
days
°C-d
Jan
10.8
44.8%
3.56
96.4
4.0
12.1
216
49
Feb
12.8
36.8%
4.68
96.3
4.2
14.7
146
89
Mar
17.5
29.3%
5.86
96.0
4.5
20.2
47
246
Apr
23.0
22.8%
6.66
95.6
4.8
26.2
5
401
May
27.7
21.4%
6.79
95.6
4.9
31.2
0
552
Jun
31.0
20.0%
7.62
95.7
4.6
35.0
0
628
Jul
31.1
20.9%
7.78
95.7
4.5
35.7
0
648
Aug
31.0
22.5%
7.12
95.7
4.2
35.4
0
648
Sep
29.4
24.7%
6.12
95.8
4.1
32.8
0
588
Oct
23.9
30.3%
5.20
96.0
4.0
26.5
1
442
Nov
17.6
35.4%
3.81
96.2
3.9
19.3
38
237
Dec
12.3
42.5%
3.17
96.4
3.9
13.4
171
87
Annual
22.3
29.3%
5.70
96.0
4.3
25.2
624
4615
Measured
at (m)
10.0
0.0
Location 3: Tamazawa
Item
Unit
Climate data location
Latitude
°N
27.631
Longitude
°E
14.087
Elevation
m
491
Heating design temperature
°C
4.52
Cooling design temperature
°C
37.83
Earth temperature amplitude
°C
25.35
Frost days at site
day
0
Month
Air
temperature
°C
Relative
humidity
%
Daily solar
radiation -
horizontal
kWh/m2/d
Atmospheric
pressure
kPa
Wind speed
m/s
Earth
temperature
°C
Heating
degree-days
°C-d
Cooling
degree-days
°C-d
Jan
10.8
44.8%
3.56
96.4
4.0
12.1
216
49
Feb
12.8
36.8%
4.68
96.3
4.2
14.7
146
89
Mar
17.5
29.3%
5.86
96.0
4.5
20.2
47
246
Apr
23.0
22.8%
6.66
95.6
4.8
26.2
5
401
May
27.7
21.4%
6.79
95.6
4.9
31.2
0
552

141
Jun
31.0
20.0%
7.62
95.7
4.6
35.0
0
628
Jul
31.1
20.9%
7.78
95.7
4.5
35.7
0
648
Aug
31.0
22.5%
7.12
95.7
4.2
35.4
0
648
Sep
29.4
24.7%
6.12
95.8
4.1
32.8
0
588
Oct
23.9
30.3%
5.20
96.0
4.0
26.5
1
442
Nov
17.6
35.4%
3.81
96.2
3.9
19.3
38
237
Dec
12.3
42.5%
3.17
96.4
3.9
13.4
171
87
Annual
22.3
29.3%
5.70
96.0
4.3
25.2
624
4615
Measured at
(m)
10.0
0.0
Location 4: Getta
Item
Unit
Climate data location
Latitude
°N
27.496
Longitude
°E
14.123
Elevation
m
491
Heating design temperature
°C
4.52
Cooling design temperature
°C
37.83
Earth temperature amplitude
°C
25.35
Frost days at site
day
0
Month
Air
temperature
°C
Relative
humidity
%
Daily solar
radiation -
horizontal
kWh/m2/d
Atmospheric
pressure
kPa
Wind speed
m/s
Earth
temperature
°C
Heating
degree-days
°C-d
Cooling
degree-days
°C-d
Jan
10.8
44.8%
3.56
96.4
4.0
12.1
216
49
Feb
12.8
36.8%
4.68
96.3
4.2
14.7
146
89
Mar
17.5
29.3%
5.86
96.0
4.5
20.2
47
246
Apr
23.0
22.8%
6.66
95.6
4.8
26.2
5
401
May
27.7
21.4%
6.79
95.6
4.9
31.2
0
552
Jun
31.0
20.0%
7.62
95.7
4.6
35.0
0
628
Jul
31.1
20.9%
7.78
95.7
4.5
35.7
0
648
Aug
31.0
22.5%
7.12
95.7
4.2
35.4
0
648
Sep
29.4
24.7%
6.12
95.8
4.1
32.8
0
588
Oct
23.9
30.3%
5.20
96.0
4.0
26.5
1
442
Nov
17.6
35.4%
3.81
96.2
3.9
19.3
38
237
Dec
12.3
42.5%
3.17
96.4
3.9
13.4
171
87
Annual
22.3
29.3%
5.70
96.0
4.3
25.2
624
4615
Measured
at (m)
10.0
0.0
Location 5: Bergin
Item
Unit
Climate data location
Latitude
°N
27.633
Longitude
°E
13.63
Elevation
m
503
Heating design temperature
°C
4.13
Cooling design temperature
°C
38.22
Earth temperature amplitude
°C
25.84

142
Frost days at site
day
1
Month
Air
temperature
°C
Relative
humidity
%
Daily solar
radiation -
horizontal
kWh/m2/d
Atmospheric
pressure
kPa
Wind speed
m/s
Earth
temperature
°C
Heating
degree-days
°C-d
Cooling
degree-days
°C-d
Jan
10.3
45.1%
3.64
96.3
4.0
11.7
227
43
Feb
12.5
36.2%
4.83
96.1
4.2
14.5
152
84
Mar
17.4
28.5%
6.03
95.8
4.5
20.0
50
242
Apr
22.9
22.1%
6.81
95.5
4.8
26.1
6
398
May
27.7
21.1%
7.08
95.5
5.0
31.1
0
553
Jun
31.2
19.4%
7.85
95.5
4.6
35.0
0
633
Jul
31.3
19.4%
8.04
95.5
4.5
35.8
0
655
Aug
31.1
21.1%
7.30
95.6
4.2
35.4
0
653
Sep
29.4
23.7%
6.20
95.7
4.1
32.7
0
590
Oct
23.9
29.5%
5.30
95.9
4.1
26.3
1
438
Nov
17.4
35.0%
3.96
96.0
4.0
19.1
42
231
Dec
11.8
42.6%
3.23
96.2
3.9
13.1
182
79
Annual
22.2
28.6%
5.86
95.8
4.3
25.1
660
4599
Measured
at (m)
10.0
0.0
Location 6: Adri
Item
Unit
Climate data location
Latitude
°N
27.545
Longitude
°E
13.456
Elevation
m
503
Heating design temperature
°C
4.13
Cooling design temperature
°C
38.22
Earth temperature amplitude
°C
25.84
Frost days at site
day
1
Month
Air
temperature
°C
Relative
humidity
%
Daily solar
radiation -
horizontal
kWh/m2/d
Atmospheric
pressure
kPa
Wind speed
m/s
Earth
temperature
°C
Heating
degree-days
°C-d
Cooling
degree-days
°C-d
Jan
10.3
45.1%
3.64
96.3
4.0
11.7
227
43
Feb
12.5
36.2%
4.83
96.1
4.2
14.5
152
84
Mar
17.4
28.5%
6.03
95.8
4.5
20.0
50
242
Apr
22.9
22.1%
6.81
95.5
4.8
26.1
6
398
May
27.7
21.1%
7.08
95.5
5.0
31.1
0
553
Jun
31.2
19.4%
7.85
95.5
4.6
35.0
0
633
Jul
31.3
19.4%
8.04
95.5
4.5
35.8
0
655
Aug
31.1
21.1%
7.30
95.6
4.2
35.4
0
653
Sep
29.4
23.7%
6.20
95.7
4.1
32.7
0
590
Oct
23.9
29.5%
5.30
95.9
4.1
26.3
1
438
Nov
17.4
35.0%
3.96
96.0
4.0
19.1
42
231
Dec
11.8
42.6%
3.23
96.2
3.9
13.1
182
79

143
Annual
22.2
28.6%
5.86
95.8
4.3
25.1
660
4599
Measured
at (m)
10.0
0.0
Location 7: Wenzreek
Item
Unit
Climate data location
Latitude
°N
27.478
Longitude
°E
13.17
Elevation
m
503
Heating design temperature
°C
4.13
Cooling design temperature
°C
38.22
Earth temperature amplitude
°C
25.84
Frost days at site
day
1
Month
Air
temperature
°C
Relative
humidity
%
Daily solar
radiation -
horizontal
kWh/m2/d
Atmospheric
pressure
kPa
Wind speed
m/s
Earth
temperature
°C
Heating
degree-days
°C-d
Cooling
degree-days
°C-d
Jan
10.3
45.1%
3.64
96.3
4.0
11.7
227
43
Feb
12.5
36.2%
4.83
96.1
4.2
14.5
152
84
Mar
17.4
28.5%
6.03
95.8
4.5
20.0
50
242
Apr
22.9
22.1%
6.81
95.5
4.8
26.1
6
398
May
27.7
21.1%
7.08
95.5
5.0
31.1
0
553
Jun
31.2
19.4%
7.85
95.5
4.6
35.0
0
633
Jul
31.3
19.4%
8.04
95.5
4.5
35.8
0
655
Aug
31.1
21.1%
7.30
95.6
4.2
35.4
0
653
Sep
29.4
23.7%
6.20
95.7
4.1
32.7
0
590
Oct
23.9
29.5%
5.30
95.9
4.1
26.3
1
438
Nov
17.4
35.0%
3.96
96.0
4.0
19.1
42
231
Dec
11.8
42.6%
3.23
96.2
3.9
13.1
182
79
Annual
22.2
28.6%
5.86
95.8
4.3
25.1
660
4599
Measured
at (m)
10.0
0.0

144
Appendix 4: Wind Turbines Technical Specifications
1- Wind Turbine E-82 E2
Technical specification E-82 E2
Rated power
2,000 KW
Rotor dimension
82 m
Hub height in meter
78/85/98/108/138
Wind zone (DIBt)
WZ III
Wind class (IED)
IEC/EN IIA
WEC concept
Gearless, variable speed
Single blade adjustment
Rotor
Type
Upwind rotor with active
pitch control
Rotational direction
Clockwise
No. of blades
3
Swept area
5,281 m2
Blade material
GRP (epoxy resin); Built-
in lightning protection
Rotational speed
Variable, 6 - 18 rpm
Pitch control
ENERCON single blade
pitch system per rotor
blade with allocated
emergency supply
Drive train with generator
Hub
Rigid
Main bearing
Double row
tapered/cylindrical roller
bearings
Generator
ENERCON direct-drive
annular generator
Grid feed
ENERCON inverter
Brake systems
– 3 independent pitch
control systems with
emergency power supply
– Rotor brake
– Rotor lock
Yaw system
Active via yaw gear,
load-dependent damping
Cut-out wind speed
28 - 34 m/s (with
ENERCON storm
control)
Remote monitoring
ENERCON SCADA
Wind
(m/s)
Power
(kW)
Power-
coefficient Cp(-)
1
0
0
2
3
0.12
3
25
0.29
4
82
0.40
5
174
0.43
6
321
0.46
7
532
0.48
8
815
0.49
9
1180
0.50
10
1580
0.49
11
1810
042
12
1980
0.35
13
2050
0.29
14
2050
0.23
15
2050
0.19
16
2050
0.15
17
2050
0.13
18
2050
0.11
19
2050
0.09
20
2050
0.08
21
2050
0.07
22
2050
0.06
23
2050
0.05
24
2050
0.05
25
2050
0.04

145
2- Wind Turbine E-101
Technical specification E-101
Rated power
3,050 KW
Rotor dimension
101 m
Hub height in meter
99/135/149
Wind zone (DIBt)
WZ III
Wind class (IED)
IEC/EN IIA
WEC concept
Gearless, variable speed
Single blade adjustment
Rotor
Type
Upwind rotor with
active pitch control
Rotational direction
Clockwise
No. of blades
3
Swept area
8012 m2
Blade material
GRP (epoxy resin);
Built-in lightning
protection
Rotational speed
Variable, 4 - 14.5 rpm
Pitch control
ENERCON single blade
pitch system per rotor
blade with allocated
emergency supply
Drive train with generator
Hub
Rigid
Main bearing
Double row
tapered/cylindrical roller
bearings
Generator
ENERCON direct-drive
annular generator
Grid feed
ENERCON inverter
Brake systems
– 3 independent pitch
control systems with
emergency power supply
– Rotor brake
– Rotor lock, latching
(10°)
Yaw system
Active via yaw gear, load-
dependent damping
Cut-out wind speed
28 - 34 m/s (with
ENERCON storm control)
Remote monitoring
ENERCON SCADA
Wind
(m/s)
Power
(KW)
Power-
coefficient Cp(-)
1
0
0
2
3
0.07
3
37
0.279
4
118
0.376
5
258
0.421
6
479
0.452
7
790
0.469
8
1200
0.478
9
1710
0.478
10
2340
0.477
11
2867
0.439
12
3034
0.358
13
3050
0.283
14
3050
0.227
15
3050
0.184
16
3050
0.152
17
3050
0.127
18
3050
0.107
19
3050
0.091
20
3050
0.078
21
3050
0.067
22
3050
0.058
23
3050
0.051
24
3050
0.045
25
3050
0.040

146
Appendix 5: HOMER Input Summary
HOMER 2 Licenses
Activated
Order
License id
Serial Numbers
Renewal Code
Renewal Date
Expiration Date
7172
8846
273801h2
6f060q
2015-03-26
2015-09-22
9145
26261
20f80176
am04as
2015-11-26
2016-05-24
9145
26262
295801s9
7w02wx
2016-09-08
2017-03-07
1- Load: Brak Load (AC Load)
Data source:
Synthetic
Daily noise:
0%
Hourly noise:
0%
Scaled annual average:
1,297,578 kWh/d
Scaled peak load:
76,204 kW
Load factor:
0.709

147
2- PV
Costs
Size (kW)
Capital ($)
Replacement ($)
O&M ($/yr)
1.000
3,000
2,100
60
Inputs
Sizes to consider:
0, 60,000, 80,000, 100,000, 120,000, 140,000, 180,000, 220,000, 260,000 kW
Lifetime:
20 yr
Derating factor:
90%
Tracking system:
Horizontal Axis, daily adjustment
Ground reflectance:
40%
3- Solar Resource
Location Coordinates
Latitude:
27 degrees 40 minutes North
Longitude:
14 degrees 15 minutes East
Time zone:
GMT +2:00
Date Source: Average Daily Radiation
Month
Clearness Index
Average Radiation
(kWh/m2/day)
Jan
0.565
3.560
Feb
0.626
4.680
Mar
0.652
5.860
Apr
0.645
6.660
May
0.612
6.790
Jun
0.672
7.620
Jul
0.696
7.780
Aug
0.674
7.120
Sep
0.650
6.120
Oct
0.658
5.200
Nov
0.582
3.810
Dec
0.536
3.170
Variable: Solar Date Scaled Average
Scaled annual average
4.92, 5.7 & 6.37 (kWh/m2/d)

148
Solar Resource Profeile
4- AC Generator: Diesel Generator
Costs
Size (kW)
Capital ($)
Replacement ($)
O&M ($/hr)
1.000
800
600
0.030
Inputs
Sizes to consider:
0, 20,000, 40,000, 60,000, 80,000, 100,000 kW
Lifetime:
180,000 hrs
Min. load ratio:
30%
Heat recovery ratio:
0%
Fuel used:
Diesel
Fuel curve intercept:
0.08 L/hr/kW
Fuel curve slope:
0.25 L/hr/kW
5- Fuel: Diesel
Price:
0.2, 0.4, 0.6, 0.8 $/L
Lower heating value:
43.2 MJ/kg
Density:
820 kg/m3
Carbon content:
88.0%
Sulfur content:
0.330%
6- Battery: Surrette 6CS25P
Costs
Quantity
Capital ($)
Replacement ($)
O&M ($/yr)
1
1,200
1,000
5.00

149
Inputs
Quantities to consider:
0, 10,000, 20,000, 30,000
Voltage:
6 V
Nominal capacity:
1,156 Ah
Lifetime throughput:
9,645 kWh
Details Profile
7- Converter
Costs
Size (kW)
Capital ($)
Replacement ($)
O&M ($/yr)
1.000
700
550
3
Inputs
Sizes to consider:
0, 60,000, 80,000, 100,000 kW
Lifetime:
15 yr
Inverter efficiency:
90%
Inverter can parallel with AC generator:
Yes
Rectifier relative capacity:
100%
Rectifier efficiency:
85%
8- Economics
Annual real interest rate:
6%
Project lifetime:
25 yr
Capacity shortage penalty:
$ 0/kWh

150
System fixed capital cost:
$ 0
System fixed O&M cost:
$ 0/yr
9- System Control
Dispatch strategy
Check load following:
Yes
Check cycle charging:
Yes
Setpoint state of charge:
80%
Generator Control
Allow systems with multiple generators:
Yes
Allow multiple generators to operate simultaneously:
Yes
Allow systems with generator capacity less than peak load:
Yes
10- Emissions
Carbon dioxide penalty:
$ 0/t
Carbon monoxide penalty:
$ 0/t
Unburned hydrocarbons penalty:
$ 0/t
Particulate matter penalty:
$ 0/t
Sulfur dioxide penalty:
$ 0/t
Nitrogen oxides penalty:
$ 0/t
11- Constraints
Load Capacity Constrain
Maximum annual capacity shortage:
0%
Minimum renewable fraction:
20%
Operating Reserve
Operating reserve as percentage of hourly load:
10%
Operating reserve as percentage of peak load:
0%
Operating reserve as percentage of solar power output:
25%
Operating reserve as percentage of wind power output:
50%
12- Grid
Grid Connected Costs
This Figure represents the sensitivity study conducted on electricity price from the grid versus COE, that
presented in Figure 6.7 paragraph 6.1.3.3.

151
Inputs
CO2 emissions factor:
632 g/kWh
CO emissions factor:
0 g/kWh
UHC emissions factor:
0 g/kWh
PM emissions factor:
0 g/kWh
SO2 emissions factor:
2.74 g/kWh
NOx emissions factor:
1.34 g/kWh
Interconnection cost:
$ 0
Standby charge:
$ 2,000/yr
Purchase capacity:
80,000 kW
Sale capacity:
0 kW
Grid Extension costs
Capital cost:
$ 15,000/km
O&M cost
$ 160/yr/km
Power price:
$ 0.130/kWh
$ 0.203/kWh
$ 0.227/kWh
$ 0.351/kWh
13- AC Wind Turbine: E-101
Costs
Quantity
Capital ($)
Replacement ($)
O&M ($/yr)
1
5,566,250
5,120,950
105,759
Inputs
Quantities to consider:
0, 50, 75, 100, 125, 150, 175
Lifetime:
20 yr
Hub height:
99 m
14- AC Wind Turbine: E-82
Costs
Quantity
Capital ($)
Replacement ($)
O&M ($/yr)
1
3,650,000
3,358,000
69,350
Inputs
Quantities to consider:
0, 50, 75, 100, 125, 150, 175
Lifetime:
20 yr
Hub height:
138 m
15- Wind Resource
Data source: Average Wind Speed
Month
Wind Speed
(m/s)
Jan
4.0

152
Feb
4.2
Mar
4.5
Apr
4.8
May
4.9
Jun
4.6
Jul
4.5
Aug
4.2
Sep
4.1
Oct
4.0
Nov
3.9
Dec
3.9
Wind Resource Profeile
Inputs
Weibull k:
2.5
Autocorrelation factor:
0.85
Diurnal pattern strength:
0.200
Hour of peak wind speed:
15
Scaled annual average:
3.9, 4.3, 5.2 m/s
Anemometer height:
10 m
Altitude:
491 m
Wind shear profile:
Logarithmic
Surface roughness length:
0.01 m
16- Simulation Systems
Solar System
Wind system

153
Solar and wind system
17- Example of Electricity Losses of System
18- Solar and Wind System Results
A- Solar and Wind HES, COE
Minimum COE in stand-alone system

154
Maximum COE in stand-alone system
Minimum COE in grid-connected system
Maximum COE in grid-connected system
B- At Average Renewable Resource at Site of Bark City HRES
These Figures represented values of solar and wind HES at average renewable sources and
with different diesel price levels that presented in Table 6.1, paragraph 6.4.

155
Solar and Wind Stand-Alone Systems
Solar and Wind Grid-Connected Systems
At Diesel Price 0.40 $/L

156
At Diesel Price 0.60 $/L
At Diesel Price 0.80 $/L

157
Appendix 6: Scenarios Component Sizes and Sensitivity Variables
1- Scenario 1: Solar Hybrid Renewable Energy System
Sensitivity Inputs of Solar System
Solar Stand-Alone System Search Space

158
Solar Grid-Connected System Search Space
2- Scenario 2: Wind Hybrid Renewable Energy System
Sensitivity Inputs of Wind System

159
Wind Stand-Alone System Search Space
Wind Grid-Connected System Search Space

160
3- Scenario 3: Solar and Wind Hybrid Renewable Energy System
Sensitivity Inputs of Solar and Wind System
Solar and Wind Stand-Alone System Search Space

161
Solar and Wind Grid-Connected System Search Space

162
Appendix 7: Districts Outlook Results
1. Butnan
Stand-Alone System
Grid-Connected System
At Diesel Price 0.20 $/L
At Diesel Price 0.40 $/L
At Diesel Price 0.60 $/L
At Diesel Price 0.80 $/L

163
2. Derna
Stand-Alone System
Grid-Connected System
At Diesel Price 0.20 $/L
At Diesel Price 0.40 $/L
At Diesel Price 0.60 $/L
At Diesel Price 0.80 $/L

164
3. Jabal al Akhdar
Stand-Alone System
Grid-Connected System
At Diesel Price 0.20 $/L
At Diesel Price 0.40 $/L
At Diesel Price 0.60 $/L
At Diesel Price 0.80 $/L

165
4. Marj
Stand-Alone System
Grid-Connected System
At Diesel Price 0.20 $/L
At Diesel Price 0.40 $/L
At Diesel Price 0.60 $/L
At Diesel Price 0.80 $/L

166
5. Benghazi
Stand-Alone System
Grid-Connected System
At Diesel Price 0.20 $/L
At Diesel Price 0.40 $/L
At Diesel Price 0.60 $/L
At Diesel Price 0.80 $/L

167
6. Al Wahat
Stand-Alone System
Grid-Connected System
At Diesel Price 0.20 $/L
At Diesel Price 0.40 $/L
At Diesel Price 0.60 $/L
At Diesel Price 0.80 $/L

168
7. Kufra
Stand-Alone System
Grid-Connected System
At Diesel Price 0.20 $/L
At Diesel Price 0.40 $/L
At Diesel Price 0.60 $/L
At Diesel Price 0.80 $/L

169
8. Sirte
Stand-Alone System
Grid-Connected System
At Diesel Price 0.20 $/L
At Diesel Price 0.40 $/L
At Diesel Price 0.60 $/L
At Diesel Price 0.80 $/L

170
9. Misrata
Stand-Alone System
Grid-Connected System
At Diesel Price 0.20 $/L
At Diesel Price 0.40 $/L
At Diesel Price 0.60 $/L
At Diesel Price 0.80 $/L

171
10. Murgub
Stand-Alone System
Grid-Connected System
At Diesel Price 0.20 $/L
At Diesel Price 0.40 $/L
At Diesel Price 0.60 $/L
At Diesel Price 0.80 $/L

172
11. Tripoli
Stand-Alone System
Grid-Connected System
At Diesel Price 0.20 $/L
At Diesel Price 0.40 $/L
At Diesel Price 0.60 $/L
At Diesel Price 0.80 $/L

173
12. Jafara
Stand-Alone System
Grid-Connected System
At Diesel Price 0.20 $/L
At Diesel Price 0.40 $/L
At Diesel Price 0.60 $/L
At Diesel Price 0.80 $/L

174
13. Zawiya
Stand-Alone System
Grid-Connected System
At Diesel Price 0.20 $/L
At Diesel Price 0.40 $/L
At Diesel Price 0.60 $/L
At Diesel Price 0.80 $/L

175
14. Nuqat al Khams
Stand-Alone System
Grid-Connected System
At Diesel Price 0.20 $/L
At Diesel Price 0.40 $/L
At Diesel Price 0.60 $/L
At Diesel Price 0.80 $/L

176
15. Jabal al Gharbi
Stand-Alone System
Grid-Connected System
At Diesel Price 0.20 $/L
At Diesel Price 0.40 $/L
At Diesel Price 0.60 $/L
At Diesel Price 0.80 $/L

177
16. Nalut
Stand-Alone System
Grid-Connected System
At Diesel Price 0.20 $/L
At Diesel Price 0.40 $/L
At Diesel Price 0.60 $/L
At Diesel Price 0.80 $/L

178
17. Jufra
Stand-Alone System
Grid-Connected System
At Diesel Price 0.20 $/L
At Diesel Price 0.40 $/L
At Diesel Price 0.60 $/L
At Diesel Price 0.80 $/L

179
18. Wadi al Shatii
Stand-Alone System
Grid-Connected System
At Diesel Price 0.20 $/L
At Diesel Price 0.40 $/L
At Diesel Price 0.60 $/L
At Diesel Price 0.80 $/L

180
19. Sabha
Stand-Alone System
Grid-Connected System
At Diesel Price 0.20 $/L
At Diesel Price 0.40 $/L
At Diesel Price 0.60 $/L
At Diesel Price 0.80 $/L

181
20. Wadi al Hayaa
Stand-Alone System
Grid-Connected System
At Diesel Price 0.20 $/L
At Diesel Price 0.40 $/L
At Diesel Price 0.60 $/L
At Diesel Price 0.80 $/L

182
21. Ghat
Stand-Alone System
Grid-Connected System
At Diesel Price 0.20 $/L
At Diesel Price 0.40 $/L
At Diesel Price 0.60 $/L
At Diesel Price 0.80 $/L

183
22. Murzuq
Stand-Alone System
Grid-Connected System
At Diesel Price 0.20 $/L
At Diesel Price 0.40 $/L
At Diesel Price 0.60 $/L
At Diesel Price 0.80 $/L
184
Bibliography
African Economic Outlook. (2012). Libya 2012. [Online]. Issy les Moulineaux: African
Economic Outlook, pp. 1-12. Available at:
http://www.afdb.org/fileadmin/uploads/afdb/Documents/Generic-
Documents/Libya%20Full%20PDF%20Country%20Note.pdf [Accessed: 22nd September
2014].
African Energy. (2015). Libya: Gecol Battles Outages and Grid Failures. [Online] Issue
306. Available at: http://www.africa-energy.com/libya?type=articles [Accessed: 16th
October 2015].
Ahwide, F., Aldali, Y. (2013). The Current Situation and Perspectives of Electricity
Demand and Estimation of Carbon Dioxide Emissions and Efficiency. [Online]
International Journal of Environmental, Chemical, Ecological, Geological and Geophysical
Engineering Vol: 7.pp. 979-984. Available at: http://waset.org/publications/9997922/the-
current-situation-and-perspectives-of-electricity-demand-and-estimation-of-carbon-
dioxide-emissions-and-efficiency [Accessed: 16th November 2015].
Aqueil, Hussin., Tindall, James., and Moran, Edward. (2012). Water Security and
Interconnected Challenges in Libya. Denver: TinMore Institute Publications, pp. 1-21
(TinMore Institute Research Report WS121027).
Berman, Edward R. (1975). Energy Technology Review: Geothermal Energy. 4th ed. New
Jersey: Noyes Data Corporation, pp. 230-242.
Berrie, T.W. (1992). Electricity Economics and Planning. [Online]. United Kingdom: Peter
Peregrinus Ltd, pp. xv-7 available at:
Boyle, Godfrey. (2004). Renwable energy, Power for a sustainable future. 2nd ed. Oxford
:Oxford University Press, pp. 2-15, 106-127, 244-278 & 342-379.
Coakley, J A. (2003). Reflectance And Albedo, Surface: Chapter 9. [Online]. Corvallis:
Elsevier Science Ltd, pp. 14-22. Available at:
Country Reports. (2015). Libya Facts and Culture. .[Online]. Available at:
http://www.countryreports.org/country/Libya.htm Accessed: 24th March 2015
Creswell, John W. (2009) Research Design: Qualitative, Quantitative, and Mixed Methods
Approaches. 3rd ed. California: SAGE Publications Inc, pp. 23-45
Denscombe, Martyn. (2007) The Good Research Guide: for Small-Scale Social Research
Projects. 3rd ed, London: Open University Press Ltd, pp. 35-47
Dii Research Company (GmbH). (2012). Desert Power 2050: Perspectives on a Sustainable
Power System for EUMENA. [Online] Munich: Dii GmbH, pp. 1-34. Available at:
http://desertenergy.org/wp-content/uploads/2015/09/dp2050_study_web.pdf [Accessed:
185
05th July 2015].
Doherty, P., and Harrison R. (1995). Cost Modeling of Electricity-Producing Hot Dry Rock
(HDR) Geothermal Systems in The United Kingdom. Report No. EUR 15388 EN.
Luxemburg: European Commission, pp. 1-12.
Ekhlat, Mohamed., Salah, Ibrahim M., and Kreama Nurredin. (2007). Mediterranean and
National Strategies for Sustainable Development Priority Field of Action 2: Energy and
Climate Change, Energy Efficiency and Renewable Energy: Libya - National study.
[Online] Sophia: UNEP, pp. 1-41. Available at:
http://s3.amazonaws.com/zanran_storage/www.planbleu.org/ContentPages/43691544.pdf
[Accessed: 04th May 2015].
Electric Power Research Institute. (2010). Addressing Solar Photovoltaic Operations and
Maintenance Challenges: A Survey of Current Knowledge and Practices. [Online]
California: EPRI, pp. 1-22. Available at: http://tdworld.com/site-
files/tdworld.com/files/archive/tdworld.com/go-grid-optimization/images/epri-solar-pv.pdf
[Accessed: 22th November 2015].
ENERCON GmbH. (2015). ENERCON Product Overview. [Online] Aurich: ENERCON,
pp. 1-35. Available at: http://www.enercon.de/fileadmin/Redakteur/Medien-
Portal/broschueren/pdf/en/ENERCON_Produkt_en_06_2015.pdf [Accessed: 17th July
2015].
Enerdata (2015). Libya will import electricity from Egypt and Tunisia to avoid shortage.
[Online]. Available at: http://www.enerdata.net/enerdatauk/press-and-publication/energy-
news-001/libya-will-import-electricty-egypt-and-tunisia-avoid-shortage_33701.html
[Accessed: 15th October 2015].
F. Karathanasi, F., Soukissian, T., and Sifnioti, D. (2015). Offshore wave potential of the
Mediterranean Sea. International Conference on Renewable Energies and Power Quality.
[Online] Lacoruia, pp. 1-5. Available at: http://www.icrepq.com/icrepq'15/358-15-
karathanasi.pdf [Accessed: 27th July 2015].
Foster, Robert., Ghassemi, Majid., and Cota, Alma. (2010). Solar Energy: Renewable
Energy and the Environment. Boca Raton: CRC Press, Taylor & Francis Group LLC, pp.
96-103, 135-172 & 265-273.
General Electricity Company of Libya. (2002). Annual Report. Tripoli: GECOL, pp. 1-51.
(Arabic version).
General Electricity Company of Libya. (2003). Annual Report. Tripoli: GECOL, pp. 1-43.
(Arabic version).
General Electricity Company of Libya. (2004). Annual Report. Tripoli: GECOL, pp. 1-40.
(Arabic version).
186
General Electricity Company of Libya. (2007). Annual Report. Tripoli: GECOL, pp. 1-31.
(Arabic version).
General Electricity Company of Libya. (2008). Annual Report. Tripoli: GECOL, pp. 1-38.
(Arabic version).
General Electricity Company of Libya. (2009). Annual Report. Tripoli: GECOL, pp. 1-41.
(Arabic version).
General Electricity Company of Libya. (2010). Annual Report. Tripoli: GECOL, pp. 1-39.
(Arabic version).
General Electricity Company of Libya. (2012). Statistics Report. Tripoli: GECOL, pp. 1-9.
(English and Arabic version).
Goldstein, Barry., et al. (2011). Geothermal Energy. In IPCC Special Report on Renewable
Energy Sources and Climate Change Mitigation. [Online] New York: Cambridge
University Press, pp. 1- 43. Available at: http://iea-gia.org/wp-
content/uploads/2012/08/IPCC_SRREN_Ch04-Geothermal-29Jun11.pdf [Accessed: 19th
April 2015].
Grubb, Michael. Et al. (1993). The ‘Earth Summit’ Agreements: A Guide and Assessment,
an analysis of the Rio ’92 UN Conference on Environment and Development. 1st ed.
London: Earthscan Publication Ltd, pp. 85-115.
Hall, D. O., Barnard, G. W., and Moss, P. A. (1982). Biomass for Energy in The
Developing Countries. 1st ed. Oxford: Pergamon Press Ltd, pp. 1-62 & 155-163.
HOMER Energy. (2014). HOMER Energy Support: Browse the Knowledge Base. [Online]
Boulder: HOMER Energy LLC. Available at: http://usersupport.homerenergy.com
[Accessed: Different Dates in 2014].
HOMER Energy. (2015). HOMER Energy Support: Browse the Knowledge Base. [Online]
Boulder: HOMER Energy LLC. Available at: http://usersupport.homerenergy.com
[Accessed: Different Dates in 2015].
https://books.google.de/books?id=RrruQiXW0sgC&pg=PR29&dq=typical+growth+rate+i
n+developing+countries+ranges+from+2%25+to+4%25&hl=de&sa=X&ved=0ahUKEwiD
tbG0vO3MAhUBUhQKHTQxBukQ6AEIHDAA#v=onepage&q=typical%20growth%20ra
te%20in%20developing%20countries%20ranges%20from%202%25%20to%204%25&f=fa
lse [Accessed: 02nd November 2015].
International Energy Agency. (2011). Technology Roadmap: Geothermal Heat and Power.
[Online] Paris: OECD/IEA, pp. 1-39. Available at:
http://www.iea.org/publications/freepublications/publication/Geothermal_roadmap.pdf
[Accessed: 02th June 2015].
187
International Energy Agency. (2014). Renewable Energy: Market Analysis and Forecasts
to 2020, Executive Summary: Medium-Term Market Report 2014. [Online]. Available at:
https://www.iea.org/Textbase/npsum/MTrenew2014sum.pdf Accessed 16th September
2015.
International Monetary Fund. (2013). Libya: Selected Issues. Washington: IMF
Publications Service, pp. 1-14. (IMF Country Report No. 13/151).
International Renewable Energy Agency. (2012a). Renewable Energy Technologies: Cost
Analysis Series, Biomass for Power Generation. Working Paper, [Online] Volume 1:
Power Sector (Issue 1/5), Abu Dhabi: IRENA Publications, pp. 1-44. Available at:
https://www.irena.org/DocumentDownloads/Publications/RE_Technologies_Cost_Analysi
s-BIOMASS.pdf [Accessed: 19th March 2014].
International Renewable Energy Agency. (2012b). Renewable Energy Technologies: Cost
Analysis Series, Concentrating Solar Power. Working Paper, [Online] Volume 1: Power
Sector (Issue 2/5), Abu Dhabi: IRENA Publications, pp. 1-38. Available at:
http://www.irena.org/documentdownloads/publications/re_technologies_cost_analysis-
csp.pdf [Accessed: 18th March 2014].
International Renewable Energy Agency. (2012c). Renewable Energy Technologies: Cost
Analysis Series, Hydropower. Working Paper, [Online] Volume 1: Power Sector (Issue
3/5), Abu Dhabi: IRENA Publications, pp. 1-31. Available at:
http://www.irena.org/documentdownloads/publications/re_technologies_cost_analysis-
hydropower.pdf [Accessed: 17th March 2014].
International Renewable Energy Agency. (2012d). Renewable Energy Technologies: Cost
Analysis Series, Solar Photovoltaics. Working Paper, [Online] Volume 1: Power Sector
(Issue 4/5), Abu Dhabi: IRENA Publications, pp. 1-41. Available at:
https://www.irena.org/DocumentDownloads/Publications/RE_Technologies_Cost_Analysi
s-SOLAR_PV.pdf [Accessed: 18th March 2014].
International Renewable Energy Agency. (2012e). Renewable Energy Technologies: Cost
Analysis Series, Wind Power. Working Paper, [Online] Volume 1: Power Sector (Issue
5/5), Abu Dhabi: IRENA Publications, pp. 1-51. Available at:
https://www.irena.org/documentdownloads/publications/re_technologies_cost_analysis-
wind_power.pdf [Accessed: 17th March 2014].
International Renewable Energy Agency. (2012f). Renewable Energy Technologies: Cost
Analysis Series, Biomass for Power Generation. Working Paper, [Online] Volume 1:
Power Sector (Issue 1/5), Abu Dhabi: IRENA Publications, pp. 1-44. Available at:
https://www.irena.org/DocumentDownloads/Publications/RE_Technologies_Cost_Analysi
s-BIOMASS.pdf [Accessed: 19th March 2014].
International Renewable Energy Agency. (2012g). Summary for Policy Makers: Renewable
Power Generation Costs, Biomass for Power Generation, Concentrating Solar Power,
188
Hydropower, Solar Photovoltaics, and Wind Power. [Online] Abu Dhabi: IRENA
Publications, pp. 1-10. Available at:
https://www.irena.org/DocumentDownloads/Publications/Renewable_Power_Generation_
Costs.pdf [Accessed: 03th September 2014].
International Renewable Energy Agency. (2013). Renewable Power Generation Costs in
2012: An Overview. [Online] Abu Dhabi: IRENA Publications, pp. 4-82. Available at:
http://costing.irena.org/media/2769/Overview_Renewable-Power-Generation-Costs-in-
2012.pdf [Accessed: 10th April 2015].
International Renewable Energy Agency. (2014a). Estimating the Renewable Energy
Potential in Africa: A GIS-based approach. Working Paper, [Online] Abu Dhabi: IRENA
Publications, pp. 7-31. Available at:
http://www.irena.org/DocumentDownloads/Publications/IRENA_Africa_Resource_Potenti
al_Aug2014.pdf [Accessed: 27th August 2015].
International Renewable Energy Agency. (2014b). Tidal Energy Technology Brief.
[Online] Abu Dhabi: IRENA Publications, pp.10-19. Available at:
http://www.irena.org/documentdownloads/publications/tidal_energy_v4_web.pdf
[Accessed: 05th August 2015].
International Renewable Energy Agency. (2015a). Renewable Power Generation Costs in
2014. [Online] pp. 1-151. Abu Dhabi: IRENA Publications. Available at:
http://www.irena.org/documentdownloads/publications/irena_re_power_costs_2014_report
.pdf [Accessed: 20th August 2015].
International Renewable Energy Agency. (2015b). Renewable Energy Auctions – A Guide
to Design 1: Summary for Policy Makers. [Online] Abu Dhabi: IRENA and Clean Energy
Ministerial, pp. 10-38. Available at:
http://www.cleanenergyministerial.org/Portals/2/pdfs/IRENA_RE_Auctions_Guide_2015_
1_summary.pdf [Accessed: 17th November 2015].
Jha, A. R., and Ph.D. (2011). Wind Turbine Technology. Boca Raton: CRC Press, Taylor &
Francis Group LLC, pp. 163-194 & 229-260.
Kreith, Frank., Kreider, Jan F. (2011). Principal of Sustainable Energy. Boca Raton: CRC
Press, Taylor & Francis Group LLC, pp. 1-45 & 117- 173 & 373- 408.
Kreith, Frank., Krudmdieck, Susan. (2014). Principal of Sustainable Energy Systems. 2nd
ed. Boca Raton: CRC Press, Taylor & Francis Group LLC, pp. 28-71 & 170- 192 & 323-
330.
Kristoferson, Lars A., and Bokalders, Varis. (1986). Renewable Energy Technologies:
Their Applications in Developing Countries. 1st ed. Oxford: Pergamon Press Ltd, pp. 251-
281.
189
Kruger, Paul. (2006). Alternative Energy Resources: The Quest for Sustainable Energy.
New Jersey: John Wiley & Sons Inc, pp. 63-167.
Kumar, Arun., et al. (2011). Hydropower. In IPCC Special Report on Renewable Energy
Sources and Climate Change Mitigation. [Online] New York: Cambridge University Press,
pp. 441- 490. Available at:
http://ebooks.cambridge.org/chapter.jsf?bid=CBO9781139151153&cid=CBO97811391511
53A025 [Accessed: 22th April 2015].
Kutz, Myer. (2007). Environmentally Conscious, Alternative Energy Production. New
Jersey: John Wiley & Sons Inc, pp. 13-21 & pp.101-127.
Lambert, Tom., Gilman, Paul., and Lilienthal, Peter. (2006) Micropower System Modeling
With HOMER. [Online] Colorado: NREL and Mistaya Engineering Inc, pp. 379- 415.
Available at:
http://homerenergy.com/documents/MicropowerSystemModelingWithHOMER.pdf
[Accessed: 29th October 2015].
Library of Congress – Federal Research Division. (2005). Country Profile: Libya. [Online]
Washington: U.S, FRD, pp. 1-18. Available at:
https://www.loc.gov/rr/frd/cs/profiles/Libya.pdf [Accessed: 10th December 2014].
Lilienthal, P. (2005). The HOMER Micropower Optimization Model. In: DOE Solar
Energy Technologies. [Online] Conference Paper, NREL/CP-710-37606. Denver:
National Renewable Energy Laboratory, pp. 1-2. Available at:
http://www.science.smith.edu/~jcardell/Courses/EGR325/Readings/2005Lilienthal.pdf
[Accessed: 26th November 2014].
Lilienthal, P., and Givler, T. (2005). Using HOMER Software, NREL’s Micropower
Optimization Model to Explore the Role of Gen-sets in Small Solar Power Systems, Case
Study: Sri Lanka. [Online] Technical Report NREL/TP-710-36774. Colorado: NREL, pp.
1-10. Available at: http://www.nrel.gov/docs/fy05osti/36774.pdf [Accessed: 27th May
2015].
Luca Martinelli, Luca., Pezzutto, Paolo., and Ruol, Piero. (2013). Experimentally Based
Model to Size the Geometry of a New OWC Device, with Reference to the Mediterranean
Sea Wave Environment. [Online] energies (ISSN 1996-1073), pp. 4696-4720. Available at:
http://www.mdpi.com/1996-1073/6/9/4696 [Accessed: 07th August 2015].
Mazzida, JABER., (2013). Subsidies in Libya: A close look at the current situation of
subsidies with concentration on subsidized energy services. [Online] Tripoli: Author
publication, pp. 1-6.
Michaelides (Stathis), Efstathios E. (2012). Green Energy and Technology: Alternative
Energy Sources. Berlin: Springer, pp. 33-59, 236-295, 313-318 & 425-431.
190
NASA Surface meteorology and Solar Energy. (2014). A Renewable Energy Resource
Website (release 6.0). [Online]. Sponsored by NASA's Earth Science Enterprise Program.
Available at: https://eosweb.larc.nasa.gov/sse/RETScreen/ [Accessed: 05th August 2013].
National Renewable Energy Laboratory. (2011). Getting Started Guide for HOMER
Legacy (Version 2.68). [Online] Colorado: NREL, pp. 3-28. Available at:
http://www.homerenergy.com/pdf/HOMERGettingStartedGuide.pdf [Accessed: 07th June
2015].
National Renewable Energy Laboratory. (2013). 2011 Cost of Wind Energy Review.
[Online] Technical Report NREL/TP-5000-56266. Colorado: NREL, pp. 1-28. Available
at: http://www.nrel.gov/docs/fy13osti/56266.pdf [Accessed: 05th September 2014].
National Renewable Energy Laboratory. (2015). 2013 Cost of Wind Energy Review.
[Online] Technical Report NREL/TP-5000-63267. Colorado: NREL, pp. 12-48. Available
at: http://www.nrel.gov/docs/fy15osti/63267.pdf [Accessed: 11th August 2015].
Palz, W., Chartier, P., and Hall, D. O. (1981). Energy from Biomass. England: Applied
Science Publishers Ltd, pp. 33-43 & 135-147.
Renewable Energy Policy Network for the 21st Century. (2014). The First Decade: 2004 –
2014, 10 Years of Renewable Energy Progress. Paris: REN21 Publications, pp. 1-47.
Renewable Energy Policy Network for the 21st Century.(2015). Renewables 2015: Global
Status Report. [Online]. Paris: REN21 Secretariat, pp.17-125. Available at:
http://www.ren21.net/wp-content/uploads/2015/07/REN12-
GSR2015_Onlinebook_low1.pdf [Accessed: 22nd August 2015].
Reuters Africa News. (2015). UPDATE 2-Power shortages shut production at Libya's
biggest steel firm. [Online]. Available at:
http://af.reuters.com/article/libyaNews/idAFL5N10F45Z20150804 [Accessed: 15th
October 2015] (Routes report by Ahmed Elumami, August 4, 2015)
Ruhaak, Anouk. (2012). Country Report Libya. [Online] Utrecht: Economic Research
Department, Rabobank, pp. 1-6. Available at:
https://economics.rabobank.com/PageFiles/786/Libya-201209.pdf [Accessed: 10th
December 2014].
Saleh, Ibrahim M. et al. (2006). Prospects of Renewable Energy in Libya. [Online] Tripoli:
Libya, pp. 153-161. [Accessed: 06th December 2015].
Seyboth, Kristin et al. (2012). Renewable Energy Sources and Climate Change Mitigation:
Special Report on Renewable Energy Sources and Climate Change Mitigation: Summary
for Policymakers and Technical Summary. New York: Intergovernmental Panel on Climate
Change, pp. 6-59.
191
Stout, b. a. (1983). Biomass Energy Profiles. FAO Agricultural Services Bulletin 54. Rom:
FAO, pp. 10-32.
Subhes C. Bhattacharyya, Debajit Palit (2014). Mini - Grids for Rural Electrification of
Developing Countries, Analysis and Case Studies from South Asia. [E-book, Online]
Springer international publishing, p.226-228. Available at:
https://books.google.de/books?id=AaEpBAAAQBAJ&printsec=frontcover&dq=Mini-
Grids+for+Rural+Electrification+of+Developing+Countries&hl=de&sa=X&ved=0ahUKE
wiUvoDO3evQAhVhJMAKHRsbD5UQ6AEIJjAA#v=onepage&q=Mini-
Grids%20for%20Rural%20Electrification%20of%20Developing%20Countries&f=false
[Accessed: 24th November 2016].
Supersberger, Nikolaus., Früher, Laura. (2011). Integration of renewable energy and
nuclear power into North Africa Energy Systems: Analysis Of Energy Import and export
Effects. Journal of Energy Policy - Elsevier. . [Online] Energy Policy 39. pp. 4458–4465.
Available at: http://www.sciencedirect.com/science/article/pii/S0301421511000048
[Accessed: 09th September 2014].
The Renewable Energy Authority of Libya. (2009). Conference paper in: “Solar Energy in
the MENA Region”. Erfurt: Germany. Online pp. 1-19. Available at:
http://www.numov.org/de/publication-al/doc_view/617-6-ramadan-abdiwe-reaol-libya.
Accessed: 24.06.2016
The World Bank. (2012). World Development Indicators. Washington: World Bank
Publications, pp. 50-79.
United Nations Environment Programme. (2007). Current Status of Renewable Energies in
the Middle East – North African Region. [Online] Nairobi: UNEP Publications, pp. 1-44.
Available at: http://www.unep.org/pdf/rowa/Renewable_Energy.pdf [Accessed: 07th
December 2015].
United Nations, Division for Public Administration and Development Management,
Department of Economic and Social Affairs. (2004). Great Socialist People’s Libyan Arab
Jamahiriya: Public Administration, Country Profile. [Online] New York: UNPAN, pp. 1-
18. Available at:
http://unpan1.un.org/intradoc/groups/public/documents/UN/UNPAN023273.pdf
[Accessed: 15th December 2014].
Wikipedia. (2015). Districts of Libya. [Online]. Available at:
https://en.wikipedia.org/wiki/Districts_of_Libya accessed on Accessed 4th January 2015.
Williams, Richard J. (1974). Solar Energy: Technology and Applications, 1st ed. Michigan:
Ann Arbor Science Publishers Inc, pp. 1-64.
World Bank. (2016). Electric power transmission and distribution losses (% of output).
Online. Available at:
192
http://data.worldbank.org/indicator/EG.ELC.LOSS.ZS?end=2013&locations=LY-
1W&name_desc=false&start=2003 Accessed: 29.06.2016
World Energy Council. (2013). World Energy Perspective: Cost of Energy Technologies.
[Online] London: World Energy Council, pp. 5-42. Available at:
https://www.worldenergy.org/wp-
content/uploads/2013/09/WEC_J1143_CostofTECHNOLOGIES_021013_WEB_Final.pdf
[Accessed: 25th November 2015].
World Food Programme - Regional Bureau for the Middle East, ODC. (2011). Food
Security in Libya – An Overview. [Online] Rome: WFP, pp. 1-30. Available at:
http://documents.wfp.org/stellent/groups/public/documents/ena/wfp234964.pdf [Accessed:
24th July 2014].
Wrixon, G. T., Rooney, A.-M. E., Palz , W. (1993). Renewable energy – 2000. Berlin:
Springer, pp. 19-82.
Yin, Robert K. (2009). Case Study Research: Design and Methods. 4th ed, California:
SAGE Publications Inc, pp. 3-21, 53-60, 97-90.
