
CHAPTER 68
European Air- and Rail-Transport
Dominik Grether
This chapter discusses simulation of air- and rail-transport technology and passengers using
MATSim. There is no great difference in overall travel times between middle-range rail and air
transportation. Airports and railway stations are affected by capacity and opening time constraints.
For passengers and goods, geospatial location is an important property. Both modes, but especially
air transport, are faced with difficult capacity restrictions at certain departure times.
This chapter discusses how MATSim can be applied to capture these constraints and how in-
teraction between passenger demand and constraints on technology supply can be modeled. The
public transit model of MATSim (Chapter 16) is applied. Airports and aircraft are microscopi-
cally modeled the same way as bus stops and buses. Passengers are represented microscopically as
multi-agent demand for air transportation. Their choices of transport mode, routes, and depar-
ture time are restricted by the air transport technology simulation model’s capacity. The modeling
of rail transport is based on teleportation. With appropriate data, the modeling approach for air
transport could also be applied to rail transport (Quick, 2012).
The modeling of technology and demand is sketched in Section 68.1. On the basis of simulation
results for a pure air transport model, rail transport is added and effects of mode choice are pre-
sented (Section 68.2). Section 68.3 then interprets simulation results and highlights some modeling
aspects requiring further study. The choice set generation and plans removal algorithm of MATSim
is discussed in detail; that is also the subject of Section 97.4. Modeling, results, and studies of this
chapter present the highlights of Grether (2014, Chapter 6, pp. 119), in more detail.
How to cite this book chapter:
Grether, D. 2016. European Air- and Rail-Transport. In: Horni, A, Nagel, K and Axhausen, K W.
(eds.) The Multi-Agent Transport Simulation MATSim, Pp. 419–428. London: Ubiquity Press.
DOI: http://dx.doi.org/10.5334/baw.68. License: CC-BY 4.0
420 The Multi-Agent Transport Simulation MATSim
Stop
transit stop facility
apron
outbound runway
outbound taxiway
inbound taxiway
inbound runway
Nodes
Links
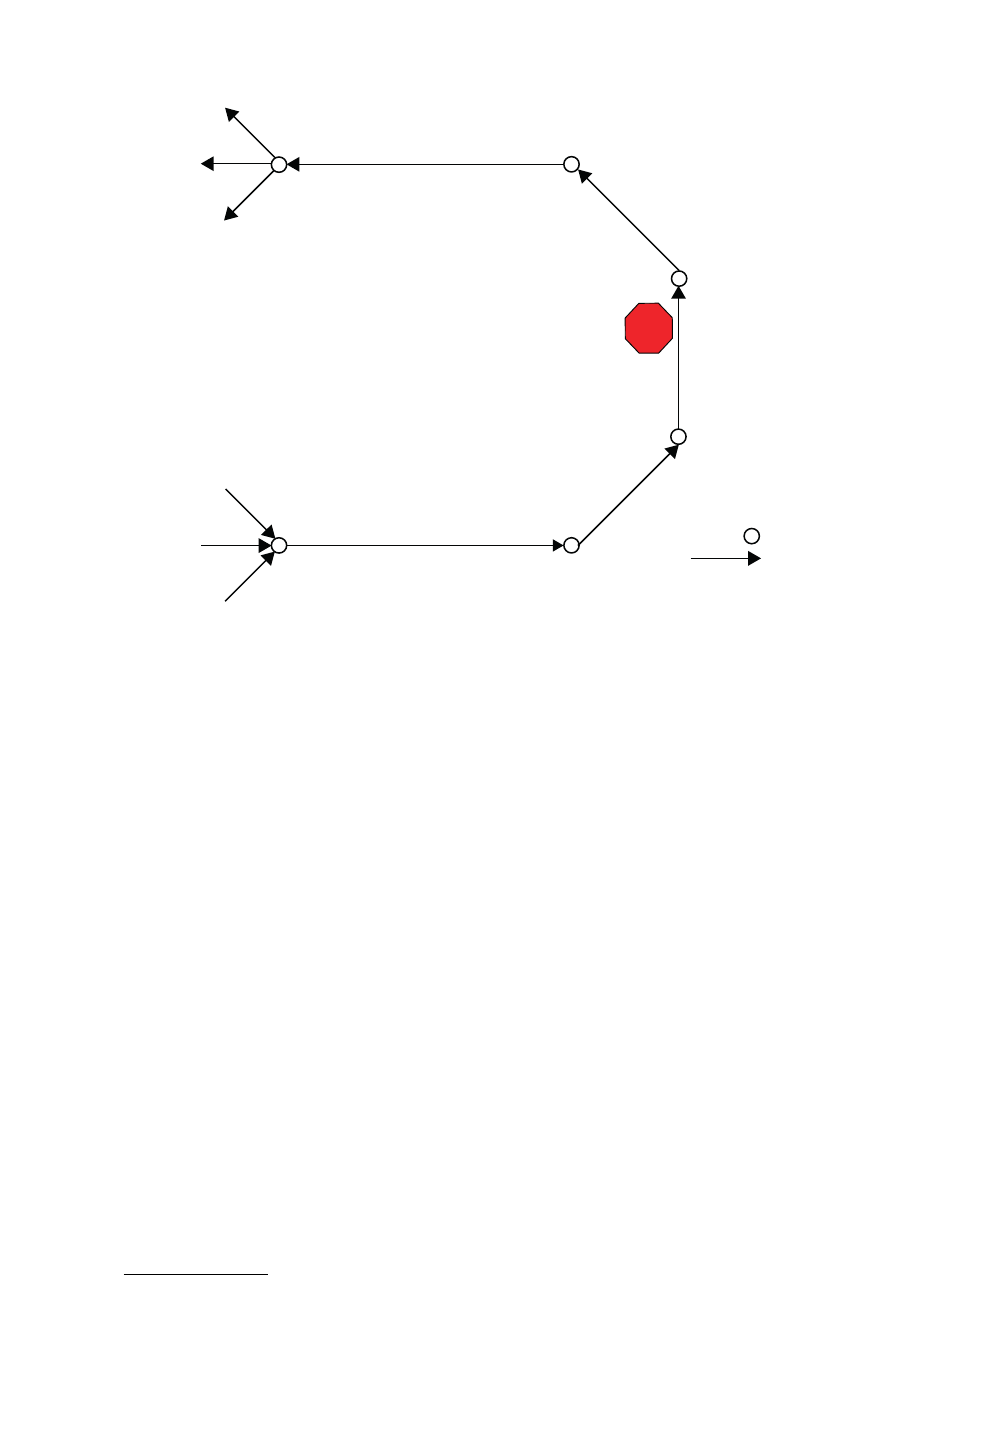
Figure 68.1: Layout of airports in the air transport network: In- and outbound runways are mod-
eled by separate links connected by taxiways and a link representing the apron. There the transit
stop facility is attached.
Source: Grether et al. (2013)
68.1 Air Transport Scenario
68.1.1 Modeling & Simulation of Air Transport Technology
The air traffic technology model uses data provided by OAG Aviation.1Relevant data for schedule
and network generation is taken from the September 2009 OAG data, using all flights departing on
a Tuesday, taking each specific flight number into account only once. This may not always result in
complete flight cycles, e.g., when the outbound and inbound flight operate on different days of the
week. Compared to using all flights of an entire week, the network may be incomplete, as certain
destinations are only served on specific days.
The air network modeling aims at a simulation with MATSim. The network consists of airports,
each showing an identical layout and point-to-point connections in between. Every runway is solely
used either for inbound or outbound flights, with taxiways connecting the runways to the apron.
The latter accommodates a transit stop, i.e., the terminal, where flight movements originate and
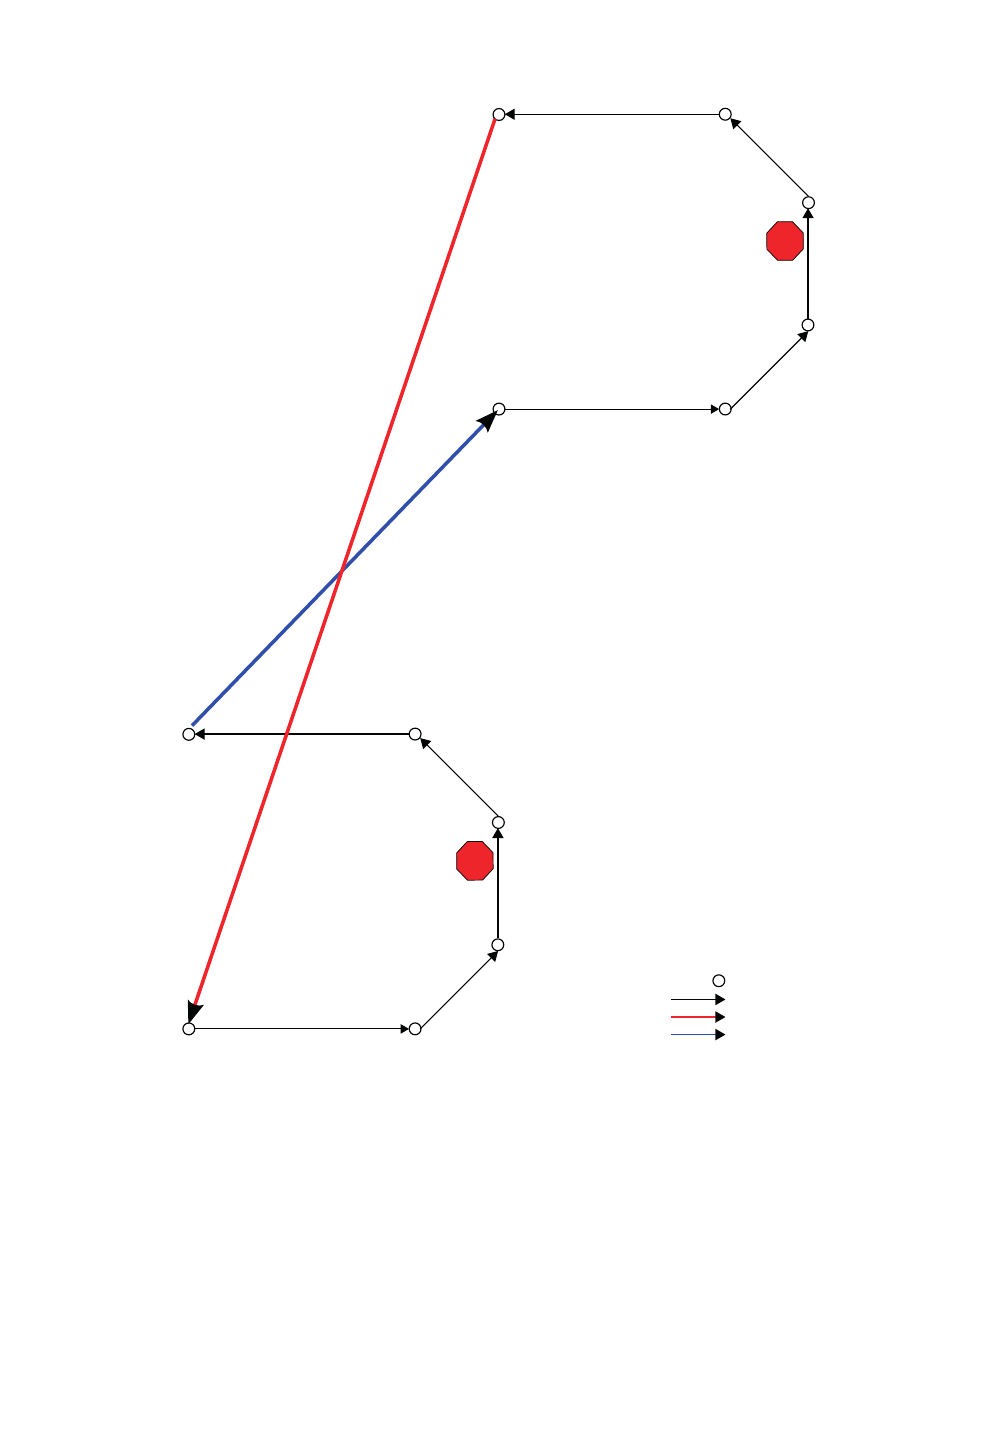
terminate (Figure 68.1). Each airport pair is directly connected by airway links, one for each flight
and direction of travel (Figure 68.2). Maximum speed on any of these links is calculated based on
distance and flight duration provided by OAG. Times for taxi, take-off, and landing are also taken
into account, i.e., flight duration is reduced by the time needed from push-back to airborne before
the maximum speed for an airway link is calculated. Each flight has an individual link that could
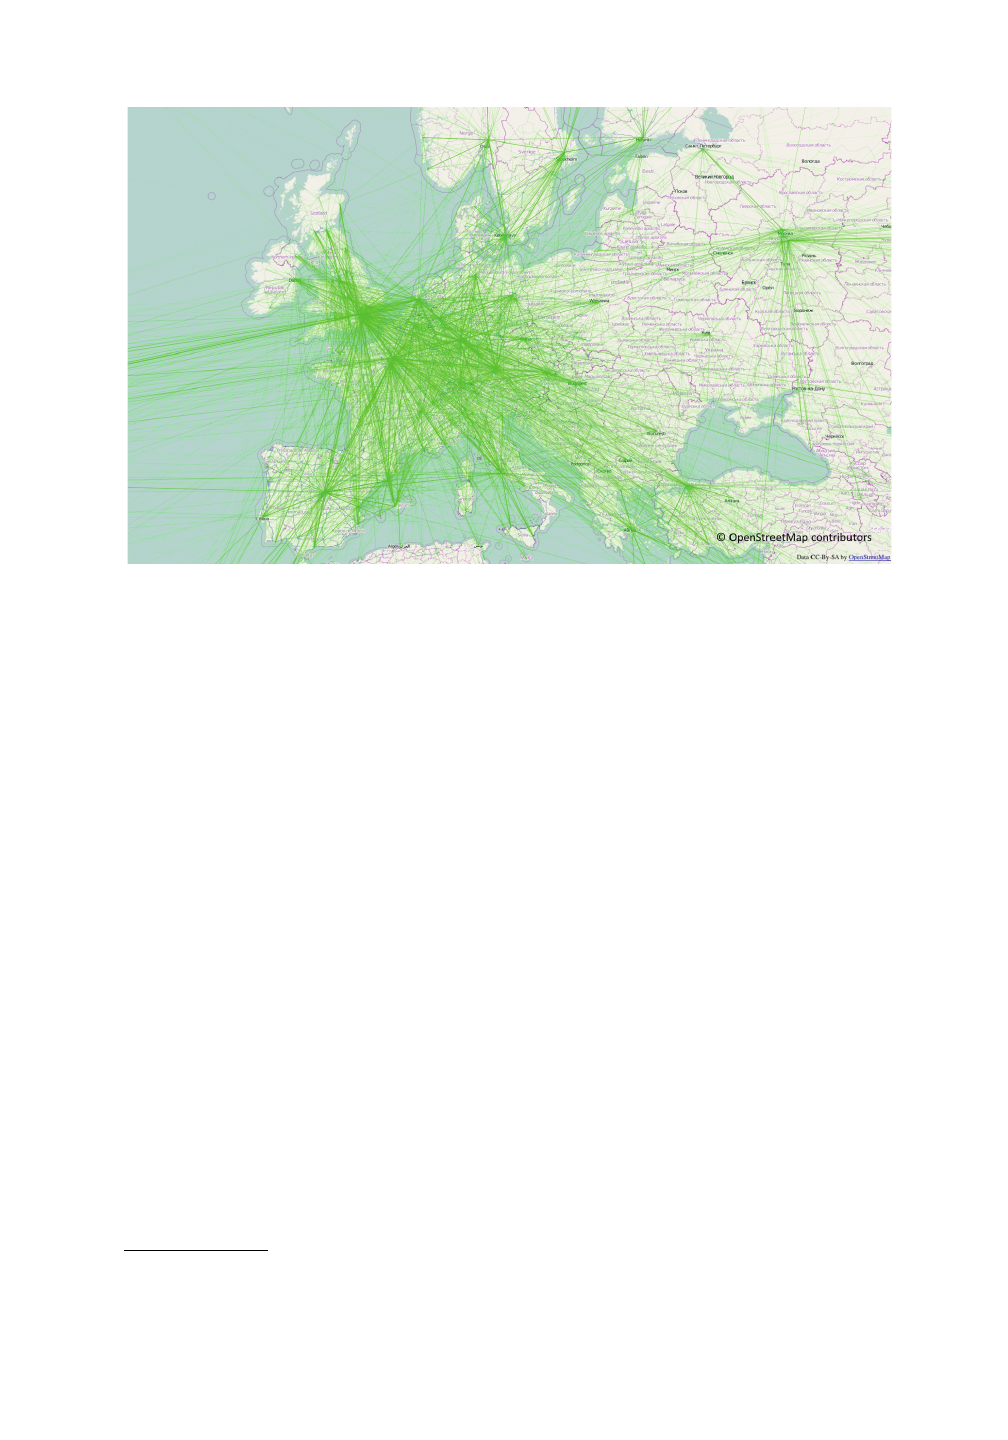
be interpreted as route, each possessing individual characteristics. Figure 68.3 shows parts of the
network for European air traffic.
1http://www.oagaviation.com, last access 08.08.2012
European Air- and Rail-Transport 421
Stop
outbound runway
inbound runway
Nodes
Links
Stop
outbound runway
inbound runway
TXL - ZRH
ZRH - TXL
Tegel Airport (TXL)
Zurich Airport (ZRH)
Figure 68.2: Layout of airways in the air transport network: each airport pair is directly connected
by two airway links, one for each flight and direction.
Source: Grether et al. (2013)
Flight schedules are taken from the OAG data and translated to a MATSim transit schedule con-
taining information about each line, route, and departure. For each airline offering a connection
between two airports, a transit line is generated. A transit route, which represents the route on the
air traffic network, is created for each flight offered by this airline. Mutual interferences of aircrafts
en-route are not included in the studies presented in this chapter.
422 The Multi-Agent Transport Simulation MATSim
Figure 68.3: European air network with country borders in the background (country borders
c
http://www.openstreetmap.org).
Source: Grether et al. (2013)
To represent individual aircraft in the simulation, transit vehicles are created on the basis of OAG
data. IATA aircraft codes, operating airlines, and seating capacities are reflected in the respective
aircraft representation for every flight. Information about boarding times, i.e., passenger flow per
door over time, is not available, but could be set for each aircraft type. One aircraft per flight is
generated, thus delays resulting from a delayed incoming aircraft are not modeled. Accordingly,
no aircraft rotations and vehicle trip chains are implemented at this time. The maximum velocity
of each aircraft is set to twice sonic speed, since speed limitations are set for each network airway
link.
68.1.2 Passenger Demand
As soon as the technology side of air transport is modeled, passenger demand simulation can begin.
The passenger demand for trips in Germany created and used for the results of this section is based
on O-D data of DESTATIS.2For each O-D pair and trip a virtual person is created. Each virtual
person performs two activities, one at the origin and the other at the destination airport. Both
activities are of same type, thus time spent performing both activities is accumulated before it is
evaluated by the utility function according to Section 3.2. A typical duration, ttyp,q, of 21 hours is
set for this activity type. The time virtual persons arrive at the origin airport and start waiting for
a connection is drawn randomly from a uniform distribution in 4 am to 6 pm, UTC. This reflects
estimated typical opening hours of European airports. No other time constraints are set, thus the
only incentive for virtual persons is to reduce overall travel time and maximize time spent at the
activity. A flight leg is scheduled between the two activities, connecting origin and destination. As
2Deutsches Statistisches Bundesamt, http://www.destatis.de, Fachserie 8 Reihe 6, last access 10.09.2012
European Air- and Rail-Transport 423
usual, the demand does not specify if a direct flight from O to D is chosen or the virtual person
is on a route containing one or more transfers. The synthetic population contains 51 832 virtual
persons, 1 550 trips from the original data are neglected as origin and destination are equal.
68.2 Simulation Results
68.2.1 Air Transport
As a scenario for air transport technology, a coverage model from Europe to world wide destina-
tions is used; with the synthetic population, it serves as input for the simulation. The assignment of
flights to the desired O-Dconnection, i.e., the passenger routing, is calculated by MATSim’s default
public transit routing module.
Each simulation is run for 600 iterations. In each iteration, 10 % of the virtual passengers may
shift their departure time randomly within a 2 hour interval. Another 10 % may seek a new route,
i.e., a connection between origin and destination. Each passenger chooses from a set of 5 plans
using an MNL. The outcome is stable after 500 iterations, then departure time choice and routing
are switched off. For another 100 iterations only the MNL is used by passengers to select a plan.
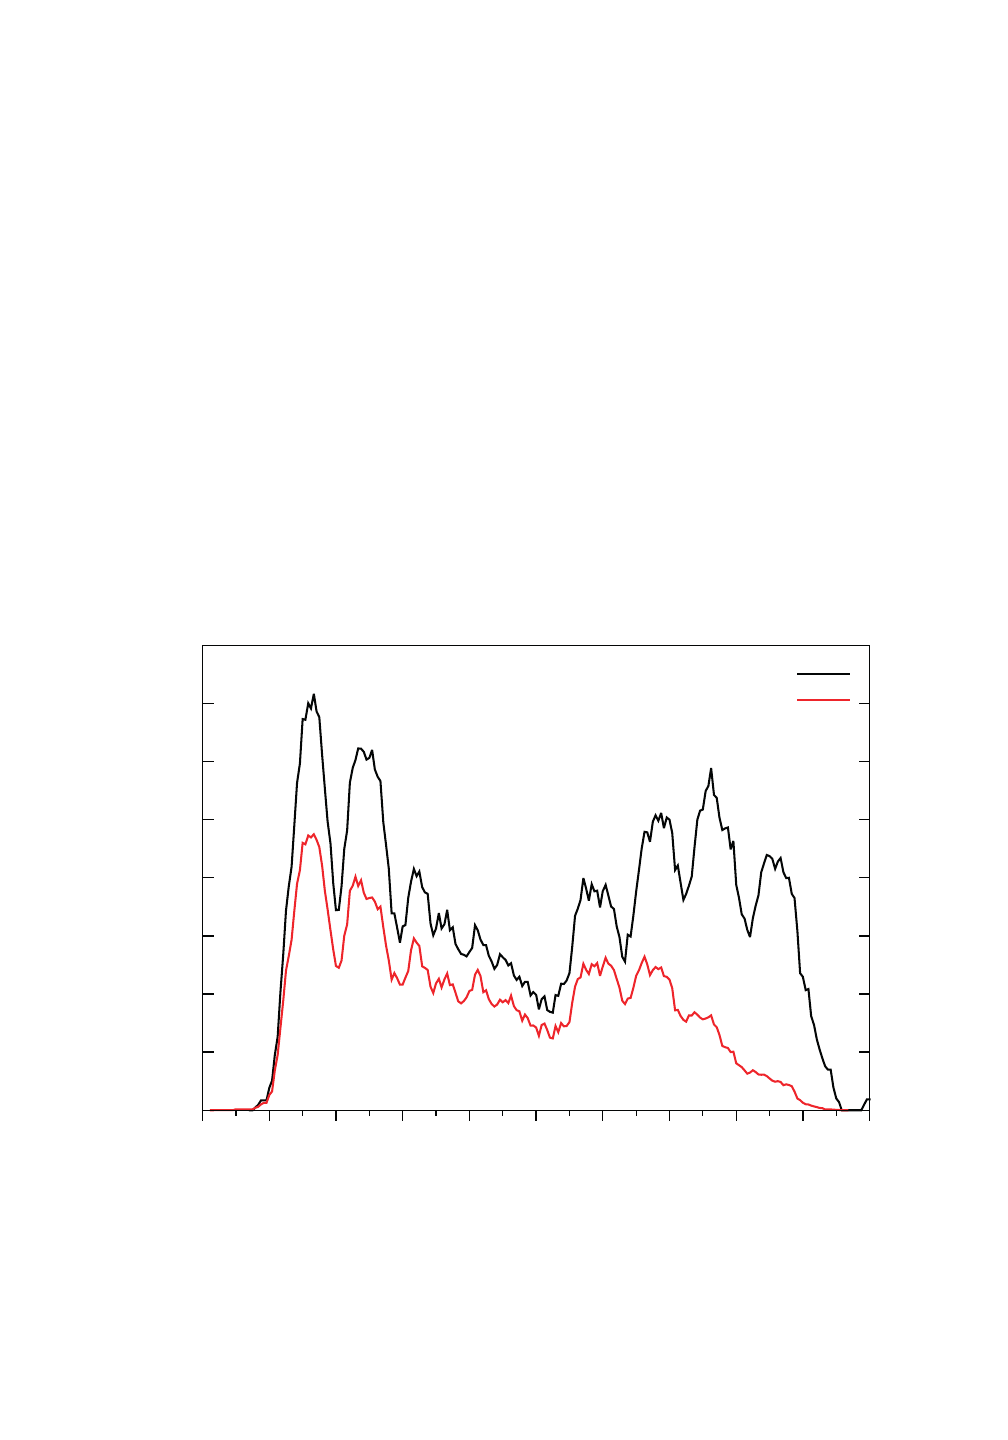
Results are then taken from the output of the 600th iteration. Filtered by flights in Germany,
Figure 68.4 depicts passengers in aircraft (red) and seats (black) over time of day and reveals
passengers’ tendency to depart early.
0
2000
4000
6000
8000
10000
12000
14000
16000
04:00
06:00
08:00
10:00
12:00
14:00
16:00
18:00
20:00
22:00
00:00
# passengers/seats
time of day [hh:mm]
# seats on air
# passengers
Figure 68.4: Passengers in aircraft and available seats over time in Germany: At any time, there
are more seats than passengers. Air transport-only scenario based on O-D data for Germany,
iteration 600.
Loading more pages...