
This journal is ©The Royal Society of Chemistry 2020 Energy Environ. Sci., 2020, 13, 3607--3619 | 3607
Cite this: Energy Environ. Sci.,
2020, 13,3607
Understanding the formation of bulk- and
surface-active layered (oxy)hydroxides for water
oxidation starting from a cobalt selenite
precursor†
Jan Niklas Hausmann,
a
Stefan Mebs,
b
Konstantin Laun,
c
Ingo Zebger,
c
Holger Dau, *
b
Prashanth W. Menezes *
a
and Matthias Driess *
a
The urgent need for a stable, efficient, and affordable oxygen evolution reaction (OER) catalyst has led
to the investigation of a vast amount of transition metal materials with multiple different anions. In situ
and post catalytic characterization shows that most materials transform during the harsh OER conditions
to layered (oxy)hydroxides (LOH). Several open questions concerning these in situ formed LOH remain
such as: an explanation for their strongly varying activities, or the effect of the precatalyst structure,
leaching anions, and transformation conditions on the formed LOH. Herein, we report on a cobalt
selenite precursor, which, depending on pH and potential, transforms irreversibly into two different LOH
OER catalysts. Combining multiple electrochemical and analytical methods ex and in situ, we prove that
one of these products is near-surface catalytically active and the other one throughout the bulk with an
in situ average cobalt oxidation state of 3.2. We deduce a detailed structural model explaining these
differences and propose general concepts relating both the precatalyst structure and the transformation
conditions to the final catalyst. Further, we apply these models to the most promising non-noble metal
catalyst, NiFe LOH.
Broader context
Implementing a sustainable global energy economy requires more than the construction of solar and wind power plants, as the fluctuations of these energy
sources contrast the constant energy demand of society. A solution to this problem is a highly scalable energy storage technology. In this regard, fuels are
advantageous as, for their scalability, only simple tanks must be constructed instead of highly resource-/energy-demanding batteries. Fuels contain reduced
chemical species that can be burned using O
2
under the release of energy. To close this energy storage cycle, oxidized compounds must be reduced while
investing electric energy. The electrons for this process come from water (O
II
) independent of whether the oxidized species are CO
2
or protons. Therefore,
catalytic oxygen evolution (OER) is the central process to form regenerative fuels from green electricity. The harsh conditions during OER lead to an in situ
transformation of most materials. Herein, we introduce a new concept to understand this transformation while considering the substrate and the
transformation conditions. Our detailed ex-andin situ investigations allow us to deduce structural relationships explaining different activities in layered
double hydroxides, the most promising catalysts for the alkaline OER.
Introduction
Highly scalable energy storage technologies are required for the
implementation of a sustainable global energy economy.
1–3
In this regard, green fuel formation out of water and CO
2
is
highly promising.
4–7
For fuel formation processes, electrons are
required.
8
The most prominent reaction supplying electrons is
the oxygen evolution reaction (OER), where electric energy is
used to oxidize abundant O
II
(from water).
8–10
The kinetically
demanding OER involves four sequential proton-coupled electron
transfer steps and accounts for a significant loss of efficiency in
a
Department of Chemistry: Metalorganics and Inorganic Materials, Technische
Universita
¨t Berlin, Straße des 17 Juni 135, Sekr. C2, 10623 Berlin, Germany.
b
Fachbereich Physik, Freie Universita
¨t Berlin, Arnimallee 14, 14195 Berlin,
c
Department of Chemistry: Physical Chemistry/Biophysical Chemistry, Technische
Universita
¨t Berlin, Straße des 17 Juni 135, Sekr. C2, 10623 Berlin, Germany
†Electronic supplementary information (ESI) available. See DOI: 10.1039/
d0ee01912g
Received 14th June 2020,
Accepted 1st September 2020
DOI: 10.1039/d0ee01912g
rsc.li/ees
Energy &
Environmental
Science
PAPER
Open Access Article. Published on 04 September 2020. Downloaded on 11/6/2020 9:03:26 PM.
This article is licensed under a
Creative Commons Attribution-NonCommercial 3.0 Unported Licence.
View Article Online
View Journal
| View Issue
3608 |Energy Environ. Sci., 2020, 13, 3607--3619 This journal is ©The Royal Society of Chemistry 2020
fuel forming processes.
11,12
To overcome this disadvantage, a vast
amount of suitable OER catalysts based on earth-abundant
transition-metals (TM) has been investigated.
9,13
Initially, mainly
(Fe/Co/Ni)O
x
H
y
were explored.
14
However, research has shown
that varying the anion can be advantageous.
15
In this regard,
chalcogenides,
16
pnictides,
17
carbides,
18
borides,
19
phosphates,
20
phosphites,
21
borates,
22
borophosphates,
23
and intermetallic
materials
24
have been tested for their suitability as OER electrode
materials.
9,15,25
The TM compounds with these anions are expected to
transform under industrially relevant OER conditions (pH 414,
current densities above 200 mA cm
2
and lifetimes up to 100000 h)
as their anions either have redox potentials significantly lower than
those of O
II
or are highly soluble in water.
25–27
In situ and post
catalytic characterization methods revealed that, even within a few
hours at low current densities (10 mA cm
2
) and pH 14, most
of these materials undergo corrosion.
18,23,24,28–38
Therefore, they
are merely precatalysts, and the active species are in most cases
Fe/Co/Ni layered (oxy)hydroxides (LOH). The observed transforma-
tions are consistent with the Pourbaix diagrams of iron, cobalt, and
nickel (shown in Fig. S1, ESI†), as they reveal that LOH are the only
thermodynamically stable oxide phases under OER conditions
besides dissolved FeO
42
.
39–42
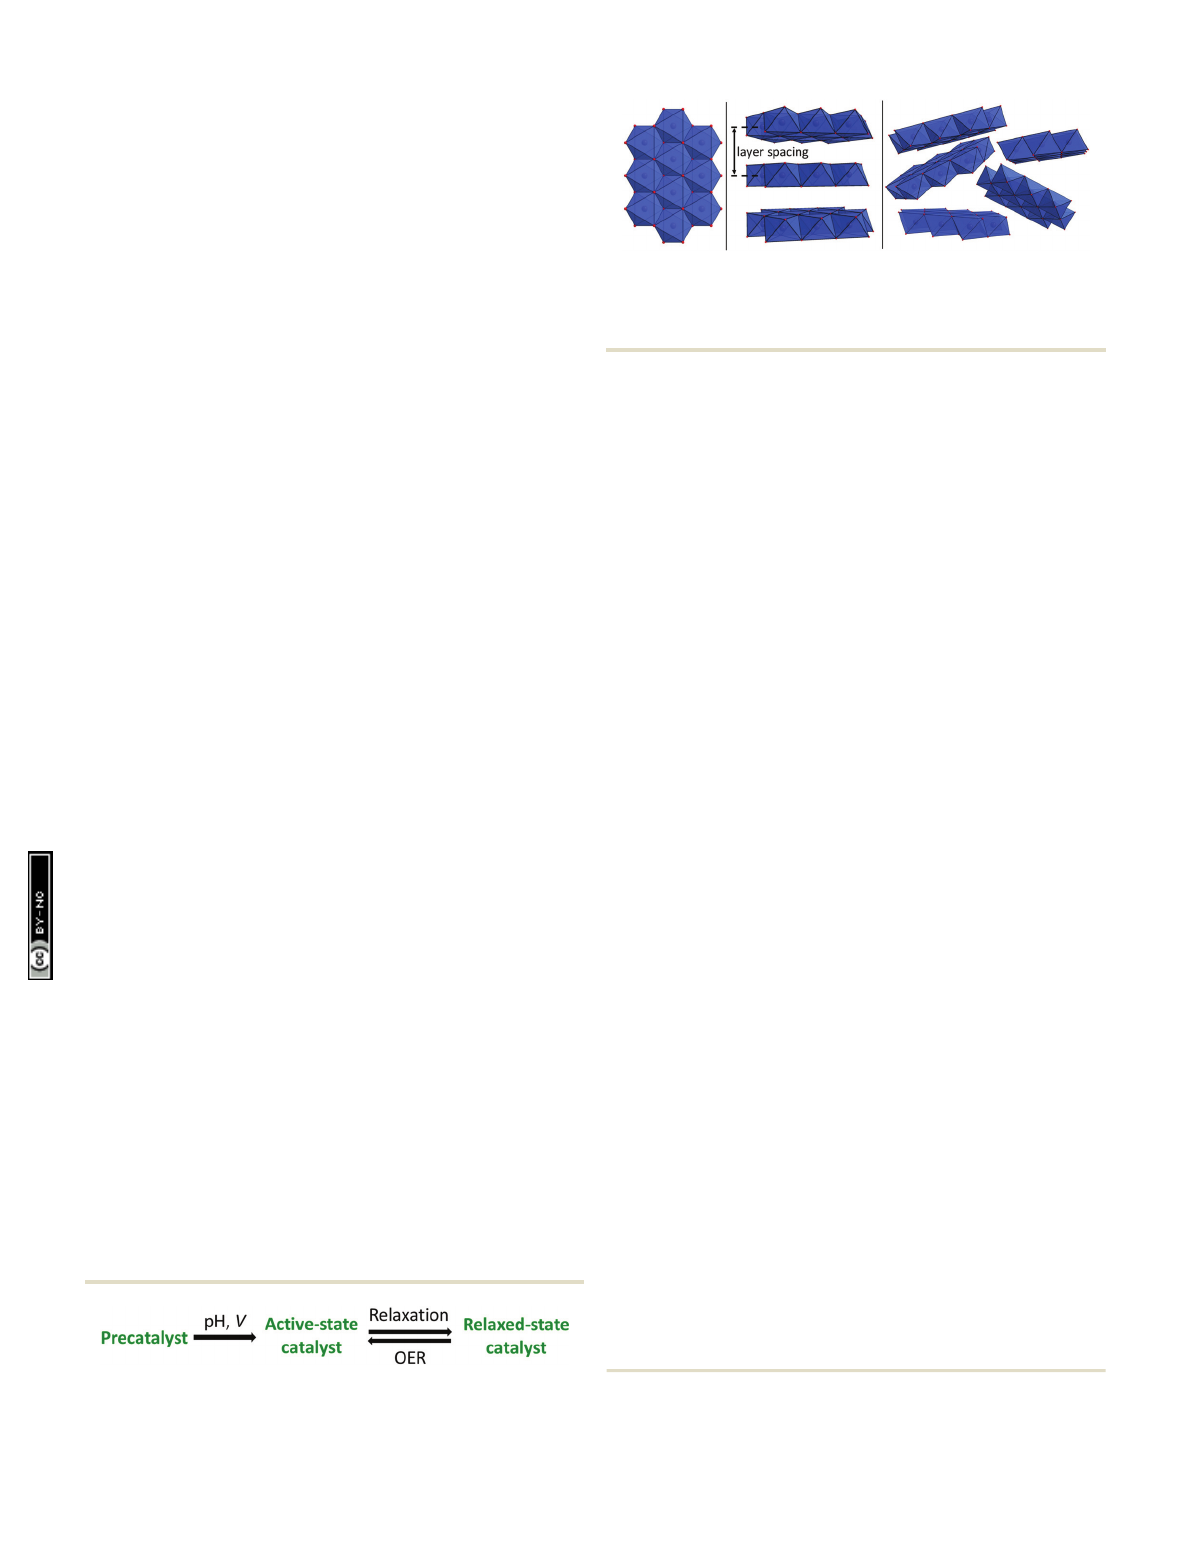
Thus, during the OER, a precatalyst transforms into the
active-state catalyst (see Scheme 1). The nature of this catalyst
will depend on the structure of the precatalyst and on the
leaching ability, redox potential, and size of its anion.
25,26,31
Further, the transformation conditions (mainly pH and elec-
trical potential) will affect the structure and catalytic properties
of the active-state catalyst. In this regard, it has been shown
that from one precatalyst, depending on the applied V, an OER
or hydrogen evolution reaction (HER) catalyst with different
structures and electronic properties can be formed.
20,23,35,36
However, even though many OER precatalysts have been inves-
tigated already, the influence of the precatalyst structure, the
leaching anion, and the transformation conditions on the even-
tually formed LOH catalyst remains as an open question.
31,34,43
Although LOH share the same short-range order (layers of
edge-sharing MO
6
octahedra, see Fig. 1 left), they are structu-
rally highly versatile, as the organization of these layers varies
drastically.
44
In crystalline forms, the layers are usually stacked
in parallel (see Fig. 1 middle). Between the layers, neutral
and charged species can be intercalated, affecting the layer
distance.
45
The layers do not have to be perfectly planar and can
be bend.
46
Furthermore, amorphous forms exist, where single
layers (domains) are only a single or very few nanometers in
diameter and the stacking is disordered (see Fig. 1 right).
47–49
The
domains can be connected by tetrahedral units or electrostatic
interactions.
48
These structural variations (tetrahedral linkage of
domains, domain size, domain stacking, defects, doping...)of
amorphous LOH are pivotal for their catalytic properties and can
help to understand the substantially different OER performance
of in situ formed LOH.
23,25,26,30,31,48,50
Because the structural
variations are non-periodic and highly complex, the elucidation
of structure-performance relationships is challenging,
51
and
raises the follwing research questions:
(a) Does the variation of pH and Vafford different LOH OER
catalysts from the same precatalyst?
(b) How do structural variations of amorphous LOH affect
their catalytic performance?
(c) Can the structure of the LOH catalyst be predetermined
by that of the precatalyst?
(d) Why are in situ formed LOH from precatalysts with
leaching anions often more active than directly synthesized
ones?
To answer these questions, we focused on monometallic
cobalt LOH as a suitable system, as it combines a high catalytic
activity per active site with sufficient conductivity and good
stability under alkaline OER conditions.
52,53
For the precatalyst
structure, a preorganization of the cobalt in layers similar to the
final LOH is desired, as this may simplify to determine struc-
tural correlations between the precatalyst and catalyst. Further,
if the anion is located in the interlayer space, a rapid leaching
could be beneficial for the complete transformation in cobalt
LOH. Cobalt(II) selenite, CoSeO
3
H
2
O, crystallizing in the space
group P2
1
/n, fulfills these requirements and has never been
tested as an OER precatalyst.
54–56
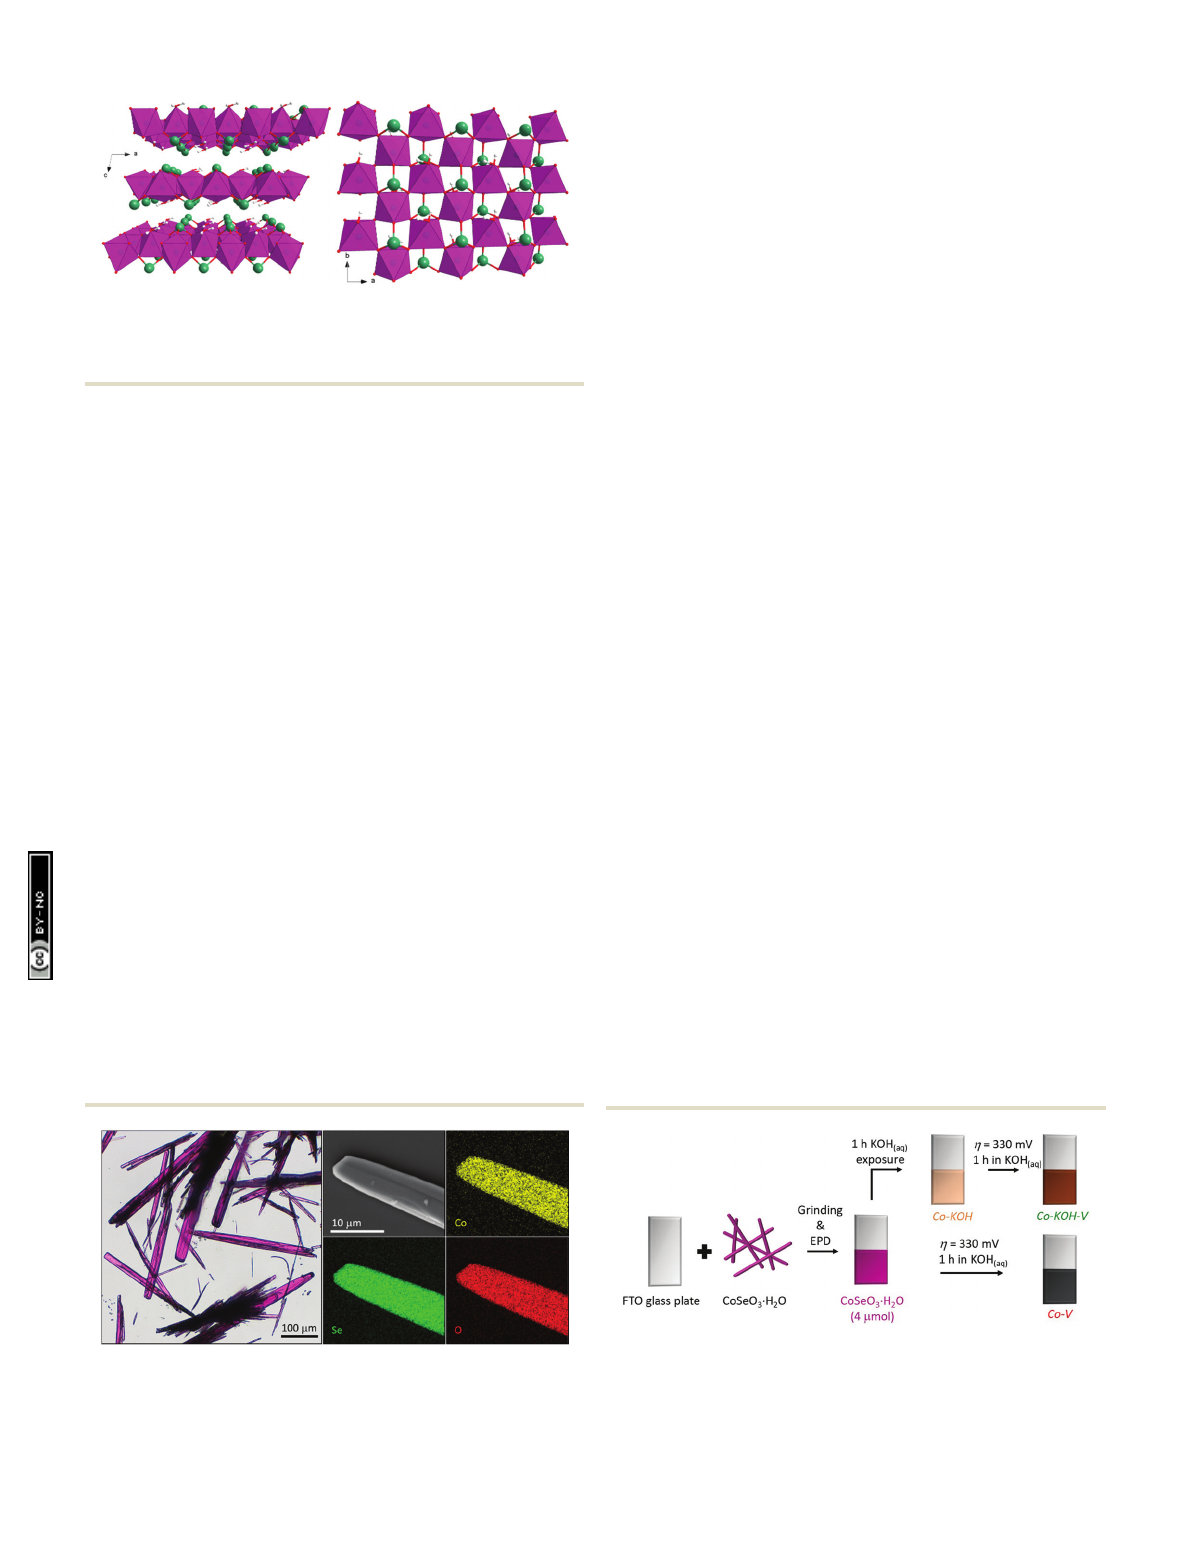
It acquires a layered structure
with a layer spacing of 6.6 Å (see Fig. 2).‡The layers are
comprised of [CoO
6
] octahedra sharing four corners. The
[CoO
6
] octahedra are additionally connected via [SeO
3
] units
with selenium pointing into the interlayer space. Moreover,
coordinated water resides between the [CoO
6
] layers. Further,
CoSeO
3
H
2
O contains Se
IV
, which could be an intermediate in
the in situ transformation of TM selenides to the corresponding
LOH,
26
that show outstanding OER performances as reported
recently.
29,50,57–61
Herein, we demonstrate that, depending on the pH and V,
two cobalt LOH with very different catalytic properties can be
Scheme 1 Transformation of a precatalyst to the active catalyst. The
reversible step on the right side shows the dynamic behavior of the
catalyst, which can be assessed by in situ investigations.
Fig. 1 Structural models for LOH. Left: Top view on a layer of edge
sharing [MO
6
] octahedra, the common structural motif of LOH. Centre:
A crystalline LOH with parallel stacking of the layers. Right: An amorphous
LOH with disordered layer arrangement.
‡The correct formula of the compound would be Co(H
2
O)[SeO
3
], as the water
coordinates to the cobalt and is not crystal water. However, we refer to it as
CoSeO
3
H
2
O to be consistent with previous reports.
Paper Energy & Environmental Science
Open Access Article. Published on 04 September 2020. Downloaded on 11/6/2020 9:03:26 PM.
This article is licensed under a
Creative Commons Attribution-NonCommercial 3.0 Unported Licence.
View Article Online
This journal is ©The Royal Society of Chemistry 2020 Energy Environ. Sci., 2020, 13, 3607--3619 | 3609
formed in situ from the CoSeO
3
H
2
O precatalyst; one is bulk
OER-active and the other active only in its near-surface region.
Through detailed quasi in situ and post catalytic investigations,
we deduced a model explaining the different catalytic proper-
ties of LOH phase with the same short-range but different long-
range orders, and propose a concept relating the precatalyst
structure and the transformation conditions to the active
catalyst.
Results
CoSeO
3
H
2
O was obtained through a facile, previously reported,
hydrothermal synthesis from SeO
2
and Co(OAc)
2
and charac-
terized by state of the art methods: light microscopy (see Fig. 3
and Fig. S2, ESI†), scanning electron microscope (SEM) with
energy dispersive X-ray (EDX) mapping (see Fig. 3 and Fig. S3,
ESI†), powder X-ray diffraction (pXRD, see Fig. S4, ESI†),
inductively coupled plasma optical absorption spectroscopy
(ICP-OES, see Fig. S4, ESI†), X-ray photoelectron spectroscopy
(XPS; see Fig. S5, ESI†), transmission electron microscopy
(TEM) with selected area electron diffraction (SAED, see
Fig. S6, ESI†), resonance Raman (RR, see Fig. 9), and X-ray
absorption spectroscopy including extended X-ray absorption
fine structure (EXAFS; see Fig. 10) and X-ray absorption near
edge structure (XANES; see Fig. 10) analyses. All methods
confirm the formation of a pristine CoSeO
3
H
2
O phase with
no additional surface oxidation.
Alkaline OER investigations
Performing cyclic voltammetry (CV) with CoSeO
3
H
2
O deposited
on fluorine doped tin oxide (FTO), we observed a broad redox
feature during the first cycle, indicating a transformation of the
material (see Fig. S9(a), ESI†). Further, the purple film turned
black during the first CV (see Fig. S9(a) and (b), ESI†). In the
second CV a current density (i)of10mAcm
2
was reached at an
overpotential (Z) of 332 mV (see Fig. S9(b), ESI†). Interestingly, a
color change was already observed, when the film was exposed to
the 1 M KOH for 60 s without applied potential (see Fig. S9(c),
ESI†). pXRD revealed that after 60 s a phase with low crystallinity
formed while after 1 h a crystalline one was obtained (see
Fig. S9(d), ESI†). Based on these observations, we decided to
investigate two different transformation pathways for the in situ
formationofanOERcatalystfromtheCoSeO
3
H
2
O precursor (see
Fig. 4). The first one was a two-step process, where the precatalyst
was first exposed to 1 M KOH for 1 h(Co–KOH)andsubsequently
for 1 h a potential of 1.56 V vs. reversible hydrogen electrode
(V
RHE
) was applied (Co–KOH–V). In the second pathway, the same
precatalyst was directly exposed to 1.56 V
RHE
for1hinthealkaline
solution (Co–V).
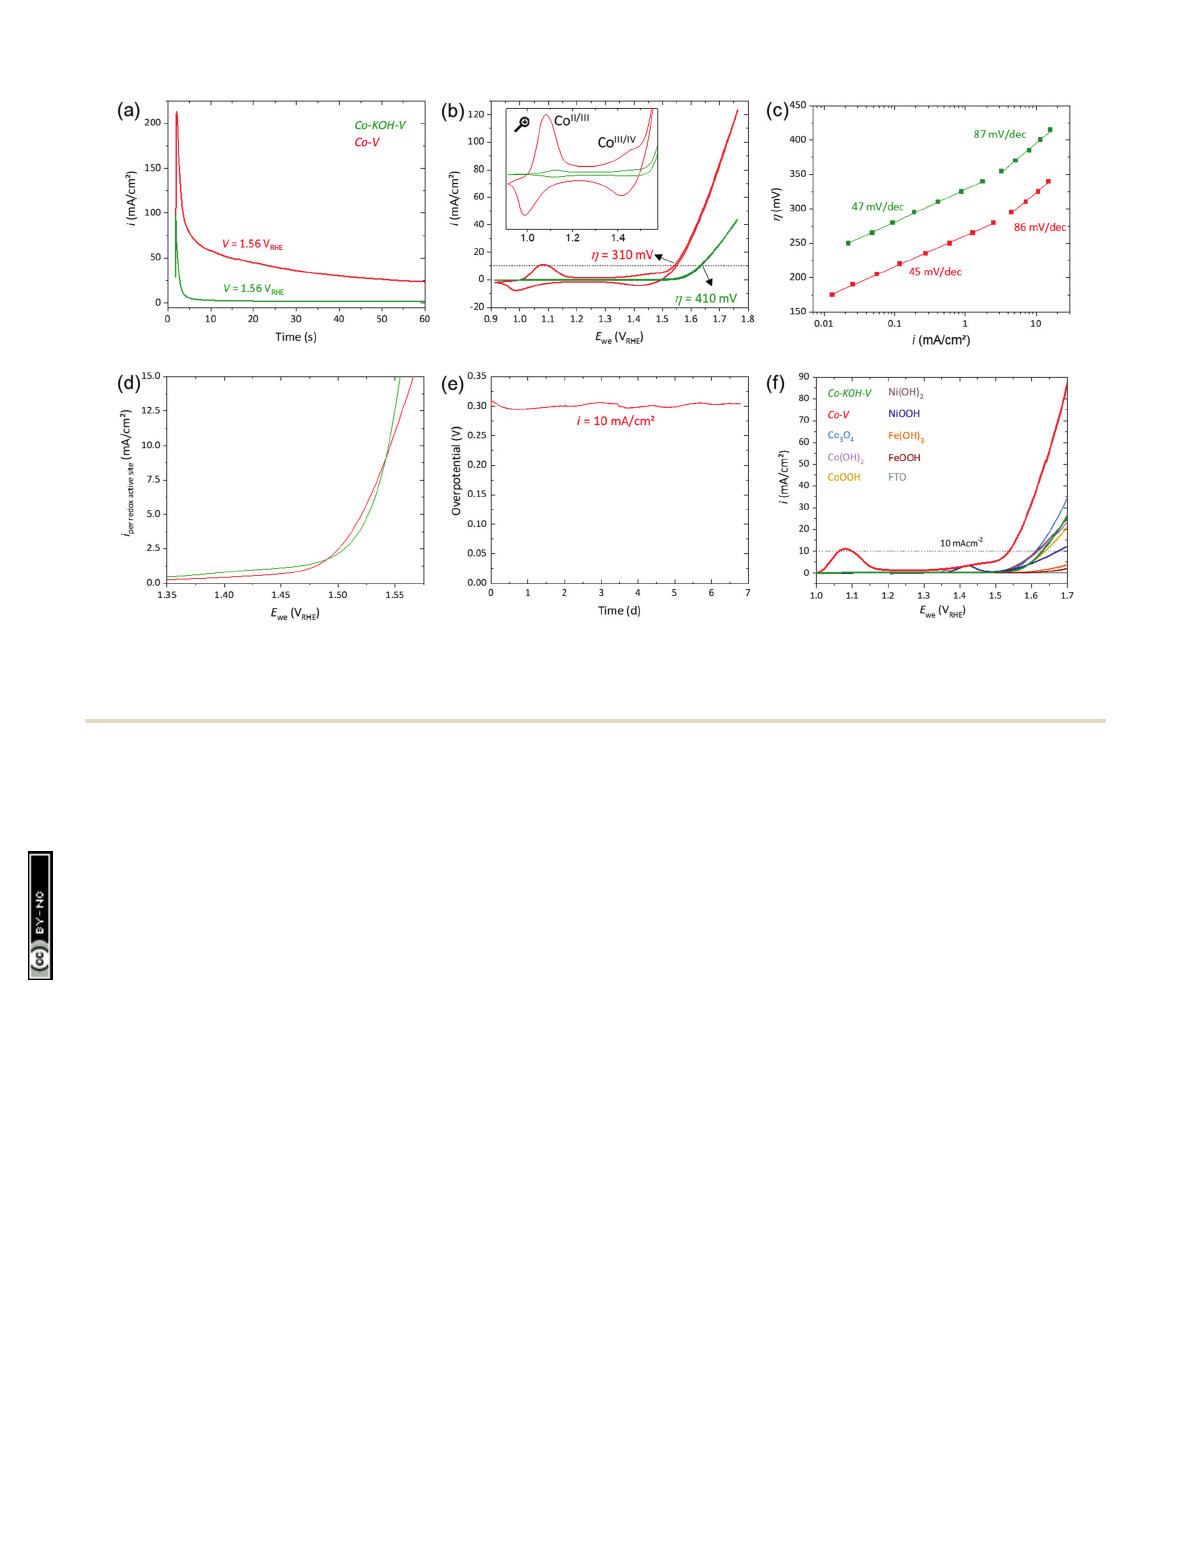
Electrochemical transformation and CV. Fig. 5(a) shows the
current responses at 1.56 V
RHE
for the two pathways. Both
curves exhibit an initial peak and then approach asymptotically
to a certain current density. We ascribe the current peak to the
precatalyst oxidation and the asymptotic current to the OER.
The OER current of the Co–V electrode was around 15 times
higher than that of Co–KOH–V. Additionally, we investigated
the CA response at different potentials as well as at pH 13 and
12 (see Fig. S10(a)–(d), ESI†). We found that both a pH above 13
and a redox potential above the Co
II/III
redox feature are
required for a large current response and high OER activity as
observed for Co–V. For a CA measurement at 1.24 V
RHE
, the
integration of the oxidation peak revealed that about three
electrons per formula unit were removed from the sample (see
Fig. S10(e), ESI†). This finding is consistent with the oxidation
of Co
II
to Co
III
and (Se
IV
O
3
)
2
to (Se
VI
O
4
)
2
. This hypothesis also
explains why a redox potential above the Co
II/III
redox feature
is required for a large current response. For Co–KOH–V, only
0.25 electrons per formula unit were removed, indicating an
incomplete oxidation or surface oxidation of the precatalyst
Fig. 2 Crystal structure of CoSeO
3
H
2
O. Selenium in green, oxygen in
red, hydrogen in grey, and [CoO
6
] octahedra in purple. Left: View along the
b axis showing the layer stacking, right: view along the c axis giving a top
view on a single layer.‡
Fig. 3 Left: Light microscope image showing the needle like morphology
of CoSeO
3
H
2
O, right: SEM/EDX mapping of the tip of a needle of CoSeO
3
H
2
O revealing a homogeneous distribution of the elements (for EDX
spectrum see Fig. S3, ESI†).
Fig. 4 Scheme of the deposition and the two herein presented trans-
formation pathways with the names of the obtained compounds and
intermediates (KOH represents 1 h of KOH exposure and V1hat
Z= 310 mV). The obtained CoSeO
3
H
2
O film was examined by SEM/EDX
and EXAFS (see Fig. S7, S8, S29, and Table S2, ESI†).
Energy & Environmental Science Paper
Open Access Article. Published on 04 September 2020. Downloaded on 11/6/2020 9:03:26 PM.
This article is licensed under a
Creative Commons Attribution-NonCommercial 3.0 Unported Licence.
View Article Online
3610 |Energy Environ. Sci., 2020, 13, 3607--3619 This journal is ©The Royal Society of Chemistry 2020
(see Fig. S10(f), ESI†). All following electrochemical or analytical
investigation were performed after 1 h of chronoamperometry
(CA) at 1.56 V
RHE
for both samples.
The CVs in Fig. 5(b) reveal that the electrocatalytic activity
of Co–V (Z
10
= 310 mV) was considerably higher than that
of Co–KOH–V (Z
10
= 410 mV). Further, for both samples, two
well-separated reversible redox peaks are present (see inset
Fig. 5(b)). These reversible features are the Co
II/III
and Co
III/IV
redox processes.
49,62
They remained unchanged when the
electrolyte was changed to fresh selenium free 1 M KOH.
Both redox peaks of Co–V are several times larger than those
of Co–KOH–V. Integration of the Co
II/III
peak of Co–V disclosed
that more than 40% of the cobalt atoms underwent this
reversible transformation (for the integration of all redox peaks
see Fig. S11, ESI†). For Co–KOH–V, it was fewer than 3% of the
cobalt. For the Co
III/IV
redox peak of Co–V, approximately 30%
of the total cobalt sites were redox active (2.5% for Co–KOH–V).
The peak current of a redox transition in CV is a function of
the scan rate (n). For a (pseudo)capacitive redox process, the
peak current is proportional to n.
63,64
Limitations by transport
phenomena lead to a deviation of this behavior (nfor a
diffusion controlled process). In Fig. S12 (ESI†), the peak
current of the Co
II/III
redox feature is plotted against n;
for Co–V and Co–KOH–V, a linear relationship is obtained.
Therefore, neither diffusion of base nor electron transport is
significantly limiting at the investigated current densities (up to
20 mA cm
2
). This is consistent with reported in situ conduc-
tivity measurements on cobalt oxyhydroxides.
65,66
Tafel analysis, C
dl
, EIS, long term CA, and LSV. Fig. 5(c)
shows steady-state Tafel plots with two linear regions with
the same slope for both catalysts. The first slope is around
46 mV dec
1
and the second around 86 mV dec
1
. As both
systems, Co–V and Co–KOH–V, have the same two Tafel slopes,
it is likely that the active-site structures and catalytic mecha-
nism are identical. Consequentially, the reaction rates per
active site should be alike. Thus, we conclude that a larger
number of catalytically active cobalt sites explains the improved
performance of Co–V. Cobalt sites that can undergo the
reversible Co
II
–Co
III
–Co
IV
redox processes potentially fulfill
the requirements to be a catalytically active site.
49,66,67
Therefore,
integration of the isolated Co
II/III
redox peak at 1.05 V
RHE
can
approximate the amount of catalytically active cobalt sites.
Fig. 5(d) displays the activity of Co–KOH–V and Co–V normal-
ized by the amount of Co
II/III
redox active sites. The normalized
activities are comparable. Hence, both catalysts have the same
kind of catalytic sites, and the Co
II/III
redox process is suitable
for their quantification. We could not achieve an unambiguous
estimation of the C
dl
for the two catalysts. Nevertheless, all
measurements indicate a significantly higher C
dl
of Co–KOH–V
compared to Co–V (see detailed discussion in Fig. S13, ESI†).
This is consistent with the morphologies observed in the SEM
and TEM for the respective samples (see Fig. S19, S20, S23
and S24, ESI†).
Electrochemical impedance spectroscopy (EIS) and long-term
chronopotentiometric (CP) measurements were performed,
as was linear scan voltammetry (LSV) in comparison to other
Fig. 5 Electrochemical investigations on FTO substrates of Co–KOH–V (in green) and Co–V (in red; both: loading 4 mmol, area 1 cm
2
). (a) Current
responses at 1.56 V
RHE
. (b) CV (n=5mVs
1
) with a magnification of the redox peaks as inset. (c) Steady-state Tafel analyses. (d) Current densities taken
from CV (n=1mVs
1
) normalized by the amount of Co
II/III
redox active sites. (e) CP measurement of Co–V at 10 mA cm
2
. (f) LSVs (n=5mVs
1
)
of several (Co/Ni/Fe)O
x
H
y
compounds in comparison to Co–KOH–V and Co–V. All measurements have been iR compensated (see ESI†for details).
Paper Energy & Environmental Science
Open Access Article. Published on 04 September 2020. Downloaded on 11/6/2020 9:03:26 PM.
This article is licensed under a
Creative Commons Attribution-NonCommercial 3.0 Unported Licence.
View Article Online
This journal is ©The Royal Society of Chemistry 2020 Energy Environ. Sci., 2020, 13, 3607--3619 | 3611
(Co/Ni/Fe)O
x
H
y
compounds. EIS conducted at 1.55 V
RHE
yielded
a semi-circular appearance in the Nyquist plot for Co–KOH–V
and Co–V (see Fig. S14 (a), ESI†). The diameter is approximately
ten times smaller for Co–V, indicating a strongly reduced
charge transfer resistance. A faradaic efficiency of 96% was
measured for Co–V (see Fig. S14(b), ESI†). A CP measurement at
10 mA cm
2
of Co–V yielded a stable performance for almost
seven days (see Fig. 5 (e)). Various (Co/Ni/Fe)O
x
H
y
were pre-
pared and loaded in the same way on FTO. Fig. 5(f) shows LSVs
recorded at 5 mV s
1
of the obtained electrodes together with
Co–KOH–V and Co–V on FTO. This comparison reveals that the
activity of Co–KOH–V is comparable to that of the other nickel-
and cobalt-based phases. Surprisingly, Co–V is drastically more
active than all the other materials. Furthermore, Co–V has a far
stronger pronounced redox peak prior to the OER.
Characterization of Co–KOH, Co–KOH–V and Co–V
ICP-OES, XRD, SAED, and XPS. The three compounds
Co–KOH, Co–KOH–V, and Co–V synthesized as described in
Fig. 4 were washed with demineralized water and subsequently
investigated using various analytical methods. ICP-OES disclosed
elemental ratios of Co:Se :K of 1: 0.01 :0.04, 1: 0.01: 0.10 and
1: 0.04:0.50 for Co–KOH, Co–KOH–V, and Co–V, respectively.
Therefore, selenium was depleted from CoSeO
3
H
2
Oinallthree
cases and oxidic cobalt species were formed.
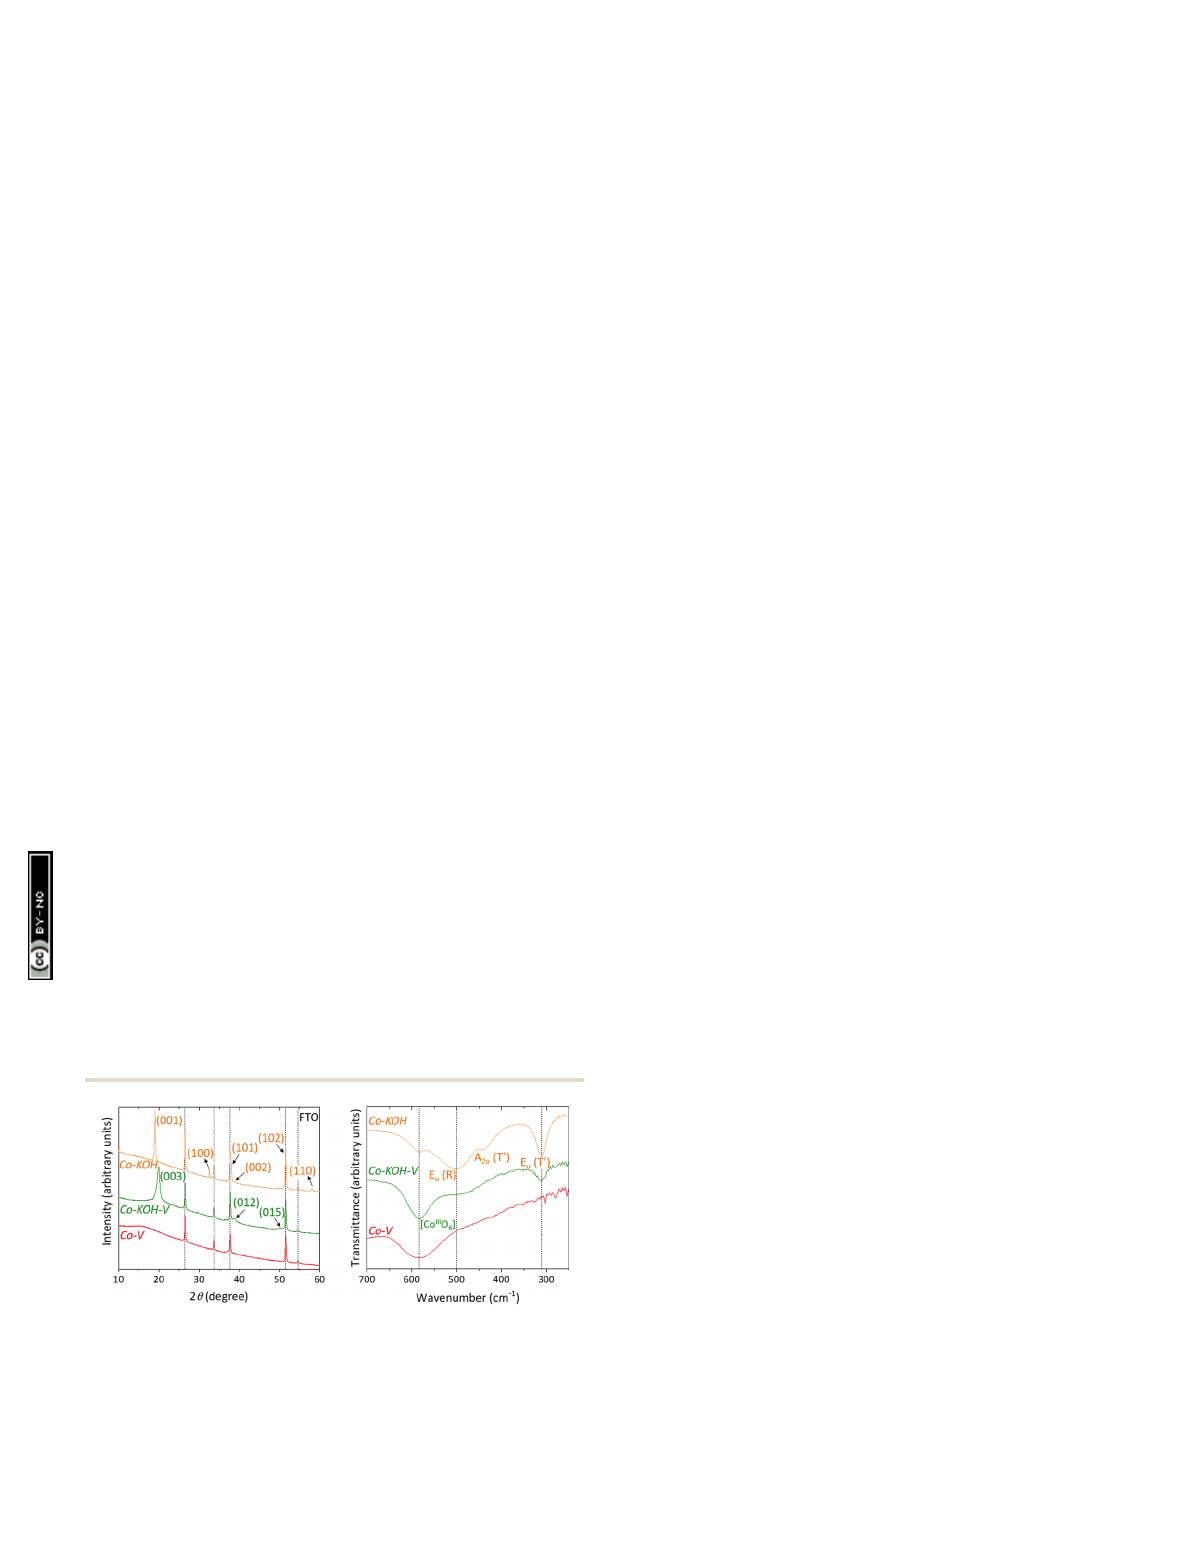
Fig. 6 left depicts the pXRD patterns of the three samples
taken directly from the FTO substrate. The diffractogram of
Co–KOH exhibits all reflexes of crystalline b-Co(OH)
2
(P%
3m1,
a= 3.18 Å and c= 4.65 Å, JCPDS 30-443). The three reflexes
present for Co–KOH–V, were assigned to b-CoOOH (R%
3m,
a= 2.85 Å and c= 13.15 Å, JCPDS 7-169). Co–V does not contain
any diffraction peaks besides those of the FTO substrate.
Hence, it is X-ray amorphous.
Electron diffraction is more sensitive than XRD and can
disclose additional phases with a lower crystallinity. Fig. S15
(ESI†) presents the SAED patterns of all three samples. The
SAED of Co–KOH confirms the presence of b-Co(OH)
2
without
additional diffraction spots. For Co–KOH–V, the SAED reveals
the occurrence of not only b-CoOOH but also of low crystallinity
b-Co(OH)
2
. The SAED of X-ray amorphous Co–V shows two
diffraction rings referring to lattice plane spacings of 2.42 Å
and 1.41 Å, which could be assigned in the structural model
derived from the EXAFS and HR-TEM data (see Fig. 8 and
EXAFS part).
Fig. S16 (ESI†) exhibits the XPS Co 2p and O 1s spectra of all
three compounds. The post catalytic cobalt surface oxidation
state is an approximately one-to-one mixture of Co
II
and Co
III
in
all three materials. Such low surface oxidation states were
previously observed for CoCat materials, which have higher
bulk oxidation states.
68
The low surface oxidation states com-
pared to the XANES investigations (see Fig. 10 left) could be
related to a formation of Co
3
O
4
from the amorphous species.
69
The O 1s spectra show three species that were assigned to
cobalt hydroxide as well as physi- and chemisorbed water.
Transmittance infrared (IR) spectroscopy. IR spectroscopy is
an integrative, bulk sensitive method capable of distinguishing
different amorphous and crystalline oxidic cobalt phases if
performed at low wavenumbers. The IR spectra of the three
samples are shown in Fig. 6 right. For Co–KOH, the three
characteristic E
u
(R), E
u
(T0), and A
2u
(T0) modes of b-Co(OH)
2
(P%
3m1) are located at 500, 441, and 311 cm
1
, respectively.
70
Additionally, a weak band at 582 cm
1
is present. This band is
characteristic for the octahedral coordinated Co
III
in CoOOH.
71
Thus, Co–KOH also contains small amounts of Co
III
, probably
due to near-surface oxidation. The spectrum of Co–KOH–V
strongly exhibits the characteristic band of CoOOH. Additionally,
weak bands for the b-Co(OH)
2
phase are present, consistent
with the SAED. For Co–V, only the vibration for octahedrally
coordinated Co
III
is found. Fig. S17 (ESI†) depicts the extended
IR spectra from 4000 to 250 cm
1
. For Co–KOH and Co–KOH–V,
the characteristic n
O–H
mode is present at 3622 cm
1
in form
of a sharp band, indicating a well-ordered hydroxide phase.
70
Interestingly, for Co–V, this vibration is absent and only a broad
and very weak peak at 3420 cm
1
is present suggesting a
disordered hydroxide-containing material with a broad distribu-
tion of force constants. Another reason for the low intensity is a
deprotonation of the hydroxidegroupsbyKOHasexpectedfrom
the Co Pourbaix diagram in Fig. S1 (ESI†).TheKtoCoratioof
1 to 2 from ICP-OES indicates that this is the case for half of the
hydroxide groups. Further, for all compounds, no intense peaks
indicating substantial amounts of (NO
3
)
or (CO
3
)
2
intercalation
are present.
45
Electron microscopy. Fig. S18–S20 (ESI†) show SEM images
and EDX mappings of the three electrodes. For Co–KOH and
Co–KOH–V, the SEM images reveal hexagonal nanoplates with
a diameter of up to 1 mm, which is typical for the formation
of b-Co(OH)
2
.
32
For Co–V, SEM images do not show the
formation of nanoplates, and particles of up to 10 mm are
present. The surface of the particles is rougher than in the
CoSeO
3
H
2
O material. In all three cases, the SEM-EDX spectra
are consistent with the ICP-OES data (see Fig S21, ESI†). The
EDX mapping reveals a homogeneous distribution of cobalt
and oxygen for all three samples (see Fig. S18–S20, ESI†).
For Co–KOH and Co–KOH–V, TEM affirms the formation of
hexagonal nanoplates (see Fig. S22 and S23, ESI†). HR-TEM
of Co–KOH unveils lattice spacings in accordance with the
Fig. 6 Left: pXRD of Co–KOH, Co–KOH–V, and Co–V taken directly
from the FTO substrate. The vertical dashed lines indicate the reflections of
FTO. The oranges numbers are the millers indices of a b-Co(OH)
2
phase
and the green ones of a b-CoOOH one. Right: IR spectra of the same
compounds. The vibrations depicted in orange belong to a b-Co(OH)
2
phase.
Energy & Environmental Science Paper
Open Access Article. Published on 04 September 2020. Downloaded on 11/6/2020 9:03:26 PM.
This article is licensed under a
Creative Commons Attribution-NonCommercial 3.0 Unported Licence.
View Article Online
Loading more pages...