
Quantification and Tuning of Surface Oxygen
Vacancies for the Hydrogenation of CO
2
on
Indium Oxide Catalysts
Robert Baumgarten
1
, Raoul Naumann d’Alnoncourt
1,
*, Stephen Lohr
1,2
, Esteban Gioria
1
,
Elias Frei
2
, Edvin Fako
2
, Sandip De
2
, Chiara Boscagli
3
, Matthias Drieß
1,4
, Stephan Schunk
2,3,5
,
and Frank Rosowski
1,2
DOI: 10.1002/cite.202200085
This is an open access article under the terms of the Creative Commons Attribution License, which permits use, distribution and reproduction in any
medium, provided the original work is properly cited.
Supporting Information
available online
The direct hydrogenation of CO
2
to methanol is an attractive approach to employ the greenhouse gas as a chemical feed-
stock. However, the commercial copper catalyst, used for methanol synthesis from CO-rich syngas, suffers from deactiva-
tion at elevated CO
2
partial pressure. An emerging alternative is represented by In
2
O
3
as it withstands the hydrothermal
conditions induced by the reverse water-gas shift reaction. The active sites for the adsorption of CO
2
and the subsequent
conversion into methanol were shown to be oxygen vacancies on the surface of In
2
O
3
. In this study, N
2
O was utilized as a
probe molecule to quantify the number of vacancies on indium oxide catalysts. The number of inserted oxygen atoms
could be correlated to the respective CO
2
hydrogenation activity. Furthermore, the atomic efficiency of indium was
enhanced by applying atomic layer deposition of indium oxide on ZrO
2
.
Keywords: CO
2
, Hydrogenation, Indium oxide, Methanol, N
2
O reactive frontal chromatography
Received: June 01, 2022; revised: August 12, 2022; accepted: September 01, 2022
1 Introduction
The efficient utilization of CO
2
as feedstock for the chemi-
cal industry would be a highly appreciated instrument to
mitigate carbon emissions [1]. CO
2
generated as by-product
along the chemical value chain could be re-introduced by
subsequent valorization processes to facilitate a circular
economy. For instance, CO
2
can be converted into syngas
(CO, H
2
) by dry reforming of methane or reduced to more
reactive CO via the reverse water-gas shift reaction (RWGS,
Eq. (1)) [2, 3]. The direct hydrogenation to hydrocarbons or
methanol is of particular interest due to the rising strive for
a hydrogen-based industry. Ideally, the CO
2
is captured
from the earth atmosphere and combined with green hy-
drogen from sustainable sources, so that the methanol itself
becomes sustainable [1, 4].
CO2gðÞ
þH2gðÞÐCO gðÞ
þH2OgðÞ
DG0
298:15K¼þ28:6 kJ mol1(1)
Methanol is among the most produced compounds with
a yearly production of about 105 Mt in 2021 [5]. It is mainly
used as intermediate for the fabrication of formaldehyde or
methyl tert-butyl ether (MTBE) and is a potential liquid
energy carrier of the future. Thereby, it can be employed in
methanol fuel cells to generate electricity or as a propellant
for combustion engines [6, 7].
Chem. Ing. Tech. 2022,94, No. 11, 1765–1775 ª2022 The Authors. Chemie Ingenieur Technik published by Wiley-VCH GmbH www.cit-journal.com
–
1
Robert Baumgarten, Dr. Raoul Naumann d’Alnoncourt,
Stephen Lohr, Esteban Gioria, Prof. Dr. Matthias Drieß,
Dr. Stephan Schunk, Dr. Frank Rosowski
BasCat – UniCat BASF JointLab, Technische Universita¨t Berlin,
10623 Berlin, Germany.
2
Stephen Lohr, Dr. Elias Frei, Dr. Edvin Fako, Dr. Sandip De,
Dr. Stephan Schunk, Dr. Frank Rosowski
BASF SE, Carl-Bosch-Straße 38, 67056 Ludwigshafen, Germany.
3
Dr. Chiara Boscagli, Dr. Stephan Schunk
hte GmbH, Kurpfalzring 104, 69123 Heidelberg, Germany.
4
Prof. Dr. Matthias Drieß
Technische Universita¨t Berlin, Institut fu
¨r Chemie: Metallorganik
und Anorganische Materialien, Straße des 17. Juni 135, 10623
Berlin, Germany.
5
Dr. Stephan Schunk
Universita¨t Leipzig, Institut fu
¨r Technische Chemie, Linne
´straße 3,
04103 Leipzig, Germany.
Research Article 1765
Chemie
Ingenieur
Technik
15222640, 2022, 11, Downloaded from https://onlinelibrary.wiley.com/doi/10.1002/cite.202200085 by Technische Universitaet Berlin, Wiley Online Library on [09/11/2022]. See the Terms and Conditions (https://onlinelibrary.wiley.com/terms-and-conditions) on Wiley Online Library for rules of use; OA articles are governed by the applicable Creative Commons License

Nowadays, methanol is conventionally synthesized from
CO-rich syngas (CO, CO
2
,H
2
) over a copper-zinc catalyst
at 50–100 bar and 200–300 C [8]. Typically, the CO
2
con-
tent is minimized as the selectivity for the reverse water-gas
shift reaction (RWGS (Eq. (1)) intensifies with a rising par-
tial pressure of CO
2
[9, 10]. Additionally, the direct hydro-
genation of CO
2
to methanol generates water as by-product
(Eq. (2)) and is less exothermic than the direct hydrogena-
tion from CO (Eq. (3)) [11]. The resulting water leads to
hydrothermal conditions causing severe changes of the
Cu/ZnO interface and reduction of the hydrogenation activ-
ity [12–14]. Therefore, the partial pressure of CO
2
is kept
low to ensure long-term stability of copper-zinc based cata-
lysts.
CO2gðÞ
þ3H2gðÞÐCH3OH gðÞ
þH2OgðÞ
DG0
298:15K¼þ3:5 kJ mol1(2)
CO gðÞ
þ2H2gðÞÐCH3OH gðÞ
DG0
298:15K¼25:2 kJ mol1(3)
Nevertheless, for effective reduction of CO
2
emissions,
the CO
2
fraction of the utilized syngas should be maxi-
mized. In recent years, indium-based catalysts emerged as
alternative system for the direct hydrogenation of CO
2
to
methanol [15, 16]. Particularly, ZrO
2
-supported In
2
O
3
was
shown to possess long-term stability and high hydrogena-
tion activity under CO
2
-rich conditions [17]. Furthermore,
indium oxides selectivity towards methanol could be in-
creased by adjusting the gas-hourly space velocity (GHSV)
as the RWGS exhibits a lower reaction rate. For In
2
O
3
, a se-
lectivity of nearly 100 % was reached at GHSV above
16 000 h
–1
[17, 18]. Yet, the drawback of elevated flow veloc-
ities is a decreased single pass conversion of the reactant
feed. On In
2
O
3
, the inhibition of the RWGS reaction was
also predicted by density functional theory (DFT) calcula-
tions [19] and confirmed by a higher apparent activation
energy for the RWGS in steady-state experiments at 50 bar
[20].
As indium oxide is the main component of the catalyst
system the major concern is to increase its dispersion and
to maximize the accessibility of indium sites by the deposi-
tion on a carrier material [21]. Monoclinic ZrO
2
(m-ZrO
2
)
was found to be the most beneficial support material reach-
ing more than ten times higher space-time yield (STY) com-
pared to TiO
2
, ZnO, SiO
2
or Al
2
O
3
(ca. 0.33 gMeOHg1
cat h1
at 300 C) [17]. Compared to bulk In
2
O
3
, the indium-base
STY was also about ten times higher when supported on
ZrO
2
(ca. 0.25 vs. 3.5 gMeOHg1
Indiumh1). Additionally, a co-
precipitation method, yielding mixed In-Zr oxides, was
demonstrated to increase the indium-based CO
2
conversion
rate to olefins [22–24]. However, mixed oxides were shown
to have inferior performance for the hydrogenation to
methanol than In
2
O
3
supported on ZrO
2
[21]. The superior
activity of the oxidic In-Zr interface was attributed to the
favored generation of oxygen defects due to the lattice mis-
match between In
2
O
3
and m-ZrO
2
[21].
The consent of most studies is that oxygen deficient sites
are most active for the CO
2
hydrogenation on In
2
O
3
[15, 25–27]. Under reaction conditions, the surface of In
2
O
3
is partially reduced by hydrogen forming under-coordi-
nated indium sites (In
2
O
3–x
) [28]. The resulting oxygen
vacancies (O
vac
) attract the insertion of CO
2
, which subse-
quently undergoes stepwise hydrogenation to methanol.
Also hydroxylated In-sites were demonstrated to be active
for CO
2
adsorption by DFT and ab initio thermodynamic
studies [29]. Yet, in order to optimize the performance of
indium-based catalysts, not only the nature but also the
quantity of active sites should be investigated.
A prominent strategy to improve the catalytic perfor-
mance is to multiply the number of surface vacancies by
enhancing the dispersion of In
2
O
3
[15]. Moreover, the for-
mation of O
vac
can be facilitated by improved H
2
activation,
which was accomplished by the promotion with noble met-
als [30]. For example, Pd and Pt nanoparticles were shown
to enhance the ability for H
2
dissociation, which aids the
formation of oxygen vacancies by hydrogen spillover
[31, 32]. Nevertheless, an excessive oxygen deficiency inhib-
its the dissociation of H
2
and hinders the subsequent hydro-
genation of adsorped CO
2
* [33]. Therefore, the conversion
of CO
2
to methanol requires a balanced supply of both O
vac
and surface oxygen [27].
The correlation between a materials characteristic and its
CO
2
hydrogenation performance was investigated via sever-
al approaches. For example, the determination of the H
2
-re-
ducibility (via TPR), the number of heat-induced oxygen
vacancies (via CO
2
-TPD) and CO
2
-FTIR was applied
[21, 22, 32]. Yet, a follow-up study demonstrated that the
H
2
-reducibility and the number of heat-induced O
vac
may
not be directly related to the CO
2
conversion rate [23]. Fur-
thermore, in an infrared spectrum the adsorption of CO
2
results in a broad range of different species and excitation
modes that are difficult to quantify.
Moreover, the X-ray photoemission spectrum (XPS) of
the O1s region (oxygen 1s orbital) was used to determine
oxygen vacancies [22, 23, 32, 34, 35]. However, other stud-
ies demonstrated that the XPS peaks, which are often
assigned to O
vac
, rather correlate to adsorbed water or sur-
face OH-groups (at 531–533 eV) [36, 37]. Nevertheless,
electron paramagnetic resonance (EPR) was employed to
verify the existence of the oxygen vacancies on the surface
[17, 35, 38]. Therefore, some publications assigned the XPS
signal to oxygen that is in close proximity to an oxygen
defect (ca. 530.5 eV) [37, 39]. Despite the possibly correct
assignment, XPS would only deliver relative O
vac
concentra-
tions. Consequently, there is a need for a practical quantifi-
cation method of accessible oxygen vacancies on the In
2
O
3
surface.
N
2
O reactive frontal chromatography (RFC) is often used
to determine the specific surface area of exposed copper
metal on a catalyst. It was also shown that N
2
O is able to
www.cit-journal.com ª2022 The Authors. Chemie Ingenieur Technik published by Wiley-VCH GmbH Chem. Ing. Tech. 2022,94, No. 11, 1765–1775
1766 Research Article
Chemie
Ingenieur
Technik
15222640, 2022, 11, Downloaded from https://onlinelibrary.wiley.com/doi/10.1002/cite.202200085 by Technische Universitaet Berlin, Wiley Online Library on [09/11/2022]. See the Terms and Conditions (https://onlinelibrary.wiley.com/terms-and-conditions) on Wiley Online Library for rules of use; OA articles are governed by the applicable Creative Commons License

titrate oxygen vacancies on the interface between Au par-
ticles and ZnO support [40]. In this study we demonstrate
the usage of N
2
O RFC for the titration of oxygen vacancies
at under-coordinated indium sites (O
vac
). The method and
theory are described in detail in the materials and methods
section (Sect. 2.4). N
2
O RFC was adapted as fingerprint
method to determine the accessibility and abundance of the
vacancies. Afterwards, the resulting values were correlated
to the CO
2
hydrogenation activity. Moreover, atomic layer
deposition (ALD) was utilized as synthesis tool to support
highly dispersed indium oxide (InO
x
) on ZrO
2
(Sect. 2.2).
Samples prepared by ALD were compared to bulk In
2
O
3
and samples deriving from incipient wetness impregnation.
2 Materials and Methods
2.1 Catalyst Synthesis
Used materials are listed in the Supporting Information
(SI). Three types of indium-based catalysts were prepared
and tested. Bulk In
2
O
3
,In
2
O
3
supported on ZrO
2
via incipi-
ent wetness impregnation (IWI) and InO
x
supported on
ZrO
2
via atomic layer deposition (Sect. 2.2). Bulk In
2
O
3
was
synthesized by the calcination of precipitated In(OH)
3
. In-
dium nitrate hydrate was dissolved in a solution of HPCL-
grade water and ethanol with a volume ratio of 1.2 to 1.
Subsequently, an aqueous solution of 90 mmol L
–1
ammoni-
um carbonate was added to the precursor solution with a
volume ratio of 1 to 2. The resulting slurry was collected
by filtration and washed with deionized water yielding
In(OH)
3
as a solid. The precursor was dried in air at 80 C
for 12 h and calcined at 300 C (3 K min
–1
) for 3 h, under
20 % O
2
(in N
2
) yielding bulk In
2
O
3
. Supported In
2
O
3
was
synthesized by incipient wetness impregnation (IWI) on
monoclinic ZrO
2
. Indium nitrate hydrate was added to
HPLC-grade water that equaled the maximum water
absorption of the ZrO
2
powder. The solution was distribut-
ed onto the ZrO
2
support and dried in air at 80 C for 12 h.
Subsequently, the precursor was calcined at 300 C
(3 K min
–1
) for 3 h, under 20 % O
2
(in N
2
), yielding
In
2
O
3
/ZrO
2
.
2.2 Atomic Layer Deposition of InO
x
on ZrO
2
Atomic layer deposition was used to prepare highly dis-
persed indium oxide (InO
x
) on ZrO
2
, which was tested as
CO
2
hydrogenation catalyst. ALD is a well-established tool
for the deposition of uniform, sub-nanoscale films on differ-
ent carrier materials. The technique follows sequential reac-
tions (cycle) in which a gaseous precursor reacts with spe-
cific surface groups of a material (e.g., OH). Subsequently,
excess precursor is purged out and the surface group termi-
nation is restored by dosing a reactant (e.g., water). The
most commonly studied material grown by ALD is Al
2
O
3
,
using trimethylaluminum (TMA) and water as a precursor-
reactant combination [41]. ALD was shown to be applicable
to materials with different topographies, such as silicon
wafers [42], electrodes [43] and even polymers [44]. There-
fore, it also gained recognition in the synthesis of heteroge-
neous catalysts [45, 46].
So far, ALD was investigated for the precise deposition of
active metals [47, 48] and metal oxides [49–51]. For exam-
ple, a porous alumina layer deposited by ALD on a Ni/SiO
2
catalyst prevented unwanted carbon formation under dry
reforming conditions [52]. Furthermore, ALD was used to
generate ZnO interfaces that facilitated the formation of
Pt
1
Zn
1
nano-alloys which were active for the dehydrogena-
tion of propane (PDH) [53]. In one example for the appli-
cation of indium oxide ALD, an In
2
O
3
layer was grown over
Pt/Al
2
O
3
also resulting in an efficient PDH catalyst [50].
However, to our knowledge, there is only one example that
applied ALD for the synthesis of CO
2
hydrogenation cata-
lysts. Wang et al. [54] deposited uniform ZnO overcoats on
Cu/SiO
2
which exhibited higher methanol selectivity com-
pared to impregnated samples.
In this study, ALD experiments were carried out in a self-
designed setup of which a detailed description is given else-
where [55]. Trimethylindium (TMI) and water were used as
precursor-reactant combination and the overall ALD pro-
cess investigation is described in detail in [56]. Initially, the
ALD growth behavior was validated by in situ thermo-
gravimetric studies in a magnetic suspension balance (SI
Fig. S1). The regarding mass uptake of InO
x
on ZrO
2
during
ALD is discussed in the SI.
For the catalyst synthesis, monoclinic ZrO
2
powder was
filled into a tubular fixed bed reactor made of quartz glass
(20 mL). The ALD process was conducted under a constant
total gas flow of 100 mL min
–1
at atmospheric pressure. The
powder substrate was kept at 150 C, the TMI dosing unit
was heated to 80 C and the water unit was kept at room
temperature. Both reactants were sequentially fed into the
reactor using argon as carrier and purge gas. The used ALD
sequence (cycle) was TMI/Ar-purge/H
2
O/Ar-purge. The
point of precursor or reactant saturation was determined by
online mass spectrometry. Both reactants were dosed into
the reactor until the mass traces for m/z= 115 (TMI) or
m/z=18(H
2
O) reached constant levels.
2.3 Characterization of the Catalysts
Powder X-ray diffraction (XRD), inductively coupled plas-
ma optical emission spectroscopy (ICP-OES), nitrogen
physisorption measurements, temperature programmed
reduction with hydrogen (H
2
-TPR), X-ray photoelectron
spectroscopy (XPS, under inert conditions after reduction)
and scanning transmission electron microscopy (STEM)
were used to analyze the samples. Detailed descriptions of
the methods are provided in the Supporting Information
(Sect. S2).
Chem. Ing. Tech. 2022,94, No. 11, 1765–1775 ª2022 The Authors. Chemie Ingenieur Technik published by Wiley-VCH GmbH www.cit-journal.com
Research Article 1767
Chemie
Ingenieur
Technik
15222640, 2022, 11, Downloaded from https://onlinelibrary.wiley.com/doi/10.1002/cite.202200085 by Technische Universitaet Berlin, Wiley Online Library on [09/11/2022]. See the Terms and Conditions (https://onlinelibrary.wiley.com/terms-and-conditions) on Wiley Online Library for rules of use; OA articles are governed by the applicable Creative Commons License
2.4 N
2
O Reactive Frontal Chromatography
as a Fingerprint Method
Usually, N
2
O reactive frontal chromatography (N
2
O RFC)
is used to determine the specific surface area of copper met-
al [57, 58]. Thereby, N
2
O is employed as probe molecule for
the titration of reduced copper sites. In contact with copper,
it decomposes into gaseous nitrogen and oxygen, which
exclusively oxidizes the copper surface atoms (at RT). The
number of reacted oxygens is determined by the amount of
nitrogen leaving the system. Furthermore, the stoichiometry
of exposed Cu and reacted oxygen is assumed to be 2:1.
Finally, the surface area of exposed Cu can be calculated
estimating 1.46 10
19
Cu atoms per m
2
[58]. Besides copper,
also the surface area of nickel was evaluated with a similar
N
2
O RFC method [59].
In this study, the same principle was adapted for the
investigation of oxygen deficient sites on the surface of indi-
um-based catalysts. Under hydrogenation conditions, indi-
um oxide holds a specific amount of indium atoms being
undercoordinated by oxygen (In
2
O
3–x
). The oxygen vacan-
cies (O
vac
) are active sites for the insertion (chemisorption)
of CO
2
[25]. After the hydrogenation to methanol, the for-
mer vacancy remains filled by an oxygen atom. Subse-
quently, the O
vac
can be recreated by the heterolytic dissoci-
ation of hydrogen on the surface [28]. The dissociation
forms an indium hydride (In-H) and an adjacent hydroxyl
group (In-OH). Subsequently, H
2
O can be released to re-
store the vacancy via hydride transfer from In-H to the OH
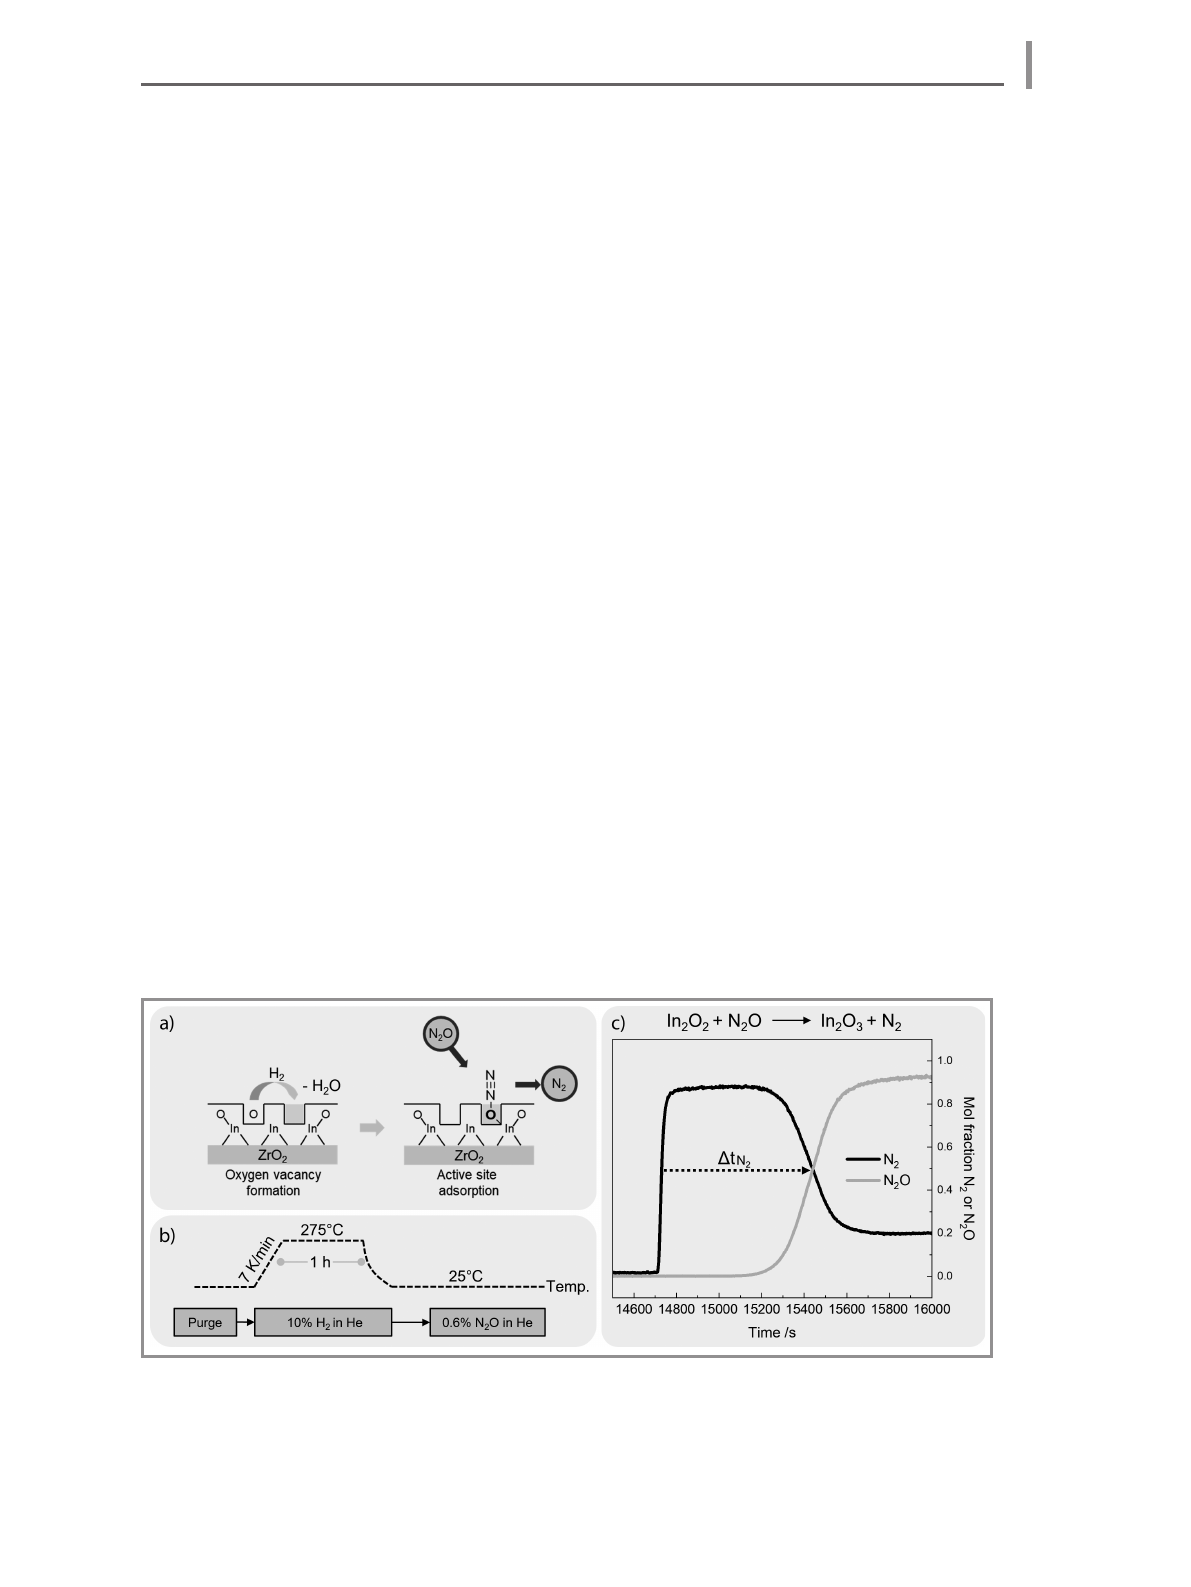
group. Here, N
2
O was used to imitate the oxygen insertion
into the vacancies after reduction by hydrogen (Fig. 1a).
Utilization of N
2
O as probe molecule is more practical than
adsorption of CO
2
as it can be done at standard tempera-
ture and pressure. Furthermore, the number of adsorption
sites correlates directly with the amount of evolved N
2
while
the adsorption of CO
2
is far more complex.
N
2
O RFC was performed in a Belcat II (Microtrac MRB,
Haan, Germany) at atmospheric pressure and RT (25 C).
The RFC reaction temperature is crucial when determining
the specific surface area of a metal. For copper, the optimal
temperature was reported to be around 300 K [57, 58]. At
elevated temperatures oxidation of the subsurface intensifies
while at lower temperatures, the N
2
O might not be con-
sumed quantitatively. In the case of nickel, the RFC temper-
ature window was found to be 323 to 373 K [59]. In this
study, however, N
2
O RFC was applied to measure the abun-
dance of oxygen vacancies on indium oxide under reductive
conditions. At RT the reduced In
2
O
3
samples were already
active for quantitative decomposition of N
2
O. To prevent
sublayer oxidation, the temperature was not further in-
crease. The effect of the RFC reaction temperature might be
subject of future investigations.
In a typical experiment, 300 mg of an indium oxide sam-
ple is loaded as fixed bed into a glass tube with an inner
diameter of 8 mm. The powder is hold in position by glass-
wool and the tube is assembled in an air-tight chamber with
one in- and outlet. The respective gas feed passes the sample
from top to bottom and the whole chamber is positioned in
a tube furnace. Exhaust gas leaving the chamber is analyzed
by an online mass spectrometer (MS). First, the chamber is
purged by pure He (99.999 %) for 10 min (Fig. 1b). Subse-
quently, the chamber is heated to 275 C (rate: 7 K min
–1
)
while dosing 30 mL min
–1
10 vol % H
2
(in He). The sample
is reduced under 10 vol % H
2
(in He) at 275 C for 1 h.
Afterwards, the chamber is cooled down to RT (25 C) while
dosing pure He (50 mL min
–1
). At RT, 30 mL min
–1
0.6 vol %
N
2
O (in He) is dosed until the signal (ion current) of
unreacted N
2
O breaks through and reaches its plateau in
the MS. The amount of N
2
O consumed was calculated from
the time until the N
2
signal descended to its half-maximum
height and the flowrate ( _
VN2O) (Eq. (4) and Fig. 1c).
www.cit-journal.com ª2022 The Authors. Chemie Ingenieur Technik published by Wiley-VCH GmbH Chem. Ing. Tech. 2022,94, No. 11, 1765–1775
Figure 1. a) Schematic adsorption mechanism of N
2
O onto supported In
2
O
3
. b) Experimental process of the N
2
O RFC on
indium oxides. c) Normalized (0,1) mol fraction of N
2
and N
2
O determined by the online MS spectrometer during N
2
O
RFC of ALD (1c) InO
x
/ZrO
2
.
1768 Research Article
Chemie
Ingenieur
Technik
15222640, 2022, 11, Downloaded from https://onlinelibrary.wiley.com/doi/10.1002/cite.202200085 by Technische Universitaet Berlin, Wiley Online Library on [09/11/2022]. See the Terms and Conditions (https://onlinelibrary.wiley.com/terms-and-conditions) on Wiley Online Library for rules of use; OA articles are governed by the applicable Creative Commons License

OinsertedðÞ
¼N2OconsumedðÞ
¼_
VN2OinðÞ
DtN2outðÞ
p
RT (4)
Tand pare the standard temperature and pressure (298 K
and 1 atm) and Ris the gas constant. Generally, the N
2
sig-
nal reaches a maximum within seconds with every N
2
O
converted into N
2
. After a certain time, the N
2
signal de-
scends to its minimum and the N
2
O signal rises to its global
maximum. Note that a N
2
signal is further detected as it is
part of the N
2
O fractionation pattern. Moreover, N
2
Ois
only converted if H
2
was dosed beforehand and the RFC
process is fully reversible. Hereby, hydrogen was able to
recreate the adsorption sites for N
2
O, similar to the report-
ed N
2
O RFC using CO as reduction agent [60].
2.5 Catalytic Testing
Catalytic activity measurements were performed in a
16-fold parallel testing unit. Each stainless-steel reactor was
loaded with 0.5 mL of a catalyst powder with a particle size
of 250–315 mm. The reactors exhibited an inner diameter of
4.5 mm and the catalyst was placed as fixed bed between
two layers of inert corundum. The temperature was set by a
programmable furnace and monitored by thermocouples at
the catalyst bed. Mass flow controllers were used to adjust
the flow rates of the inlet gases Ar (99.999 %), CO
(99.997 %), CO
2
(99.999 %) and H
2
(99.999 %). The effluent
gas concentrations were analyzed by online gas chromato-
graphs (GC, Agilent 7890B) equipped with two thermal
conductivity detectors (TCD) and one flame ionization de-
tector (FID) employing He as carrier gas. For each experi-
ment, one reactor was filled exclusively with inert corun-
dum as a reference (‘‘ref’’).
Prior to the testing, the catalysts were activated in situ at
50 bar and 300 C, in pure Ar, with a flow of 100 mL min
–1
for 1 h. Subsequently, the temperature was reduced to
225 C and the syngas feedstock was changed to a mixture
of CO
2
, CO, H
2
and Ar (17.1 vol % CO
2
, 1.9 vol % CO,
76 vol % H
2
and 5 vol % Ar). The total pressure was 80 bar
and the respective ratios were 9:1 for CO
2
/CO and ca. 4:1
for H
2
/CO
2
. The volume flow was adjusted to maintain a
GHSV of 6000 or 12 000 h
–1
. The temperature was ramped
from 225 C to 300 C in steps of 25 K and approximately
24 h holding time each. The mole fraction of Ar (c
Ar
) was
used as internal standard to correct the measured concen-
trations of all compounds (c
i
) according to Eq. (5)
ci;corrected ¼ci
cAr out;refðÞ
cAr out;reactorðÞ
(5)
The conversion of carbon dioxide (X
CO2
) was calculated
based on the change of CO
2
concentration after passing the
reactor as in Eq. (6).
XCO2¼1cCO2 out;reactorðÞ
cCO2 out;refðÞ
(6)
c
CO2 (out, reactor)
is the molar concentration of CO
2
in the
outlet gas of the respective reactor and c
CO2 (out, ref)
is the
concentration of CO
2
in the outlet of the (inert) reference
reactor. The selectivity for each product (S
i
) was determined
based on its outlet concentration and the amount of con-
verted CO
2
according to Eq. (7).
Si¼ciout;reactorðÞ
cCO2in;reactorðÞ
CiX1
CO2(7)
c
i (out, reactor)
is the molar concentration of the respective
product (e.g., MeOH) in the reactor outlet, c
CO2 (in, reactor)
the concentration of CO
2
being dosed in the reactor and C
i
is the carbon-number. The space-time yield (STY
i
) was cal-
culated from the flowrate of the respective product concen-
tration (_
ci) in the reactor outlet and its molecular weight
(MW
i
) as in Eq. (8).
STYi¼
_
ci outðÞ
MWi
acat
(8)
The quotient a
cat
is a specific property of the catalyst on
which the STY is fixed (e.g., its volume or mass of indium).
3 Results and Discussion
3.1 Proof of Concept
The N
2
O reactive frontal chromatography (RFC) was tested
for the quantification of partially reduced or undercoordi-
nated sites on indium oxide catalysts. At first, N
2
O RFC
was applied on bulk indium oxide and In
2
O
3
supported on
monoclinic ZrO
2
(m-ZrO
2
) via incipient wetness impregna-
tion (IWI). The amount of N
2
O consumed equals the
amount of oxygen atoms inserted in the vacancies (O
vac
)at
the catalyst surface (Sect. 2.4).
In Fig. 2, the number of inserted oxygen atoms per square
meter of sample is compared to the conversion of CO
2
and
space-time yield of methanol (STY MeOH) at 250 C. To rule
out the differences in densities, the STY is depicted per volume
of catalyst (mL). ZrO
2
did not consume any oxygen atoms
andshowednearlynoCO
2
conversion (< 0.75 %). Moreover,
the selectivity of MeOH was approximately 74% for all indi-
um catalysts under these conditions. For the bulk indium ox-
ide and supported indium catalysts, the conversion of CO
2
and STY scaled with the amount of inserted oxygen (Fig. 2a).
The typical range of oxygen vacancy abundance was 2.5
to 3.5 mmol per square meter of the measured material. The
number of O
vac
per m
2
increased by 12 % from bulk to sup-
ported indium oxide (7.9 wt % In). At the same time, the
conversion and STY were 31 % and 35% higher, respectively.
Therefore, the supported catalyst produced 35 % more
methanol per hour while holding 12 % more oxygen vacan-
cies per surface area. Increased loading (9.5 wt % In) led to
7.6 % more O
vac
while providing 13 % higher STY when
compared to the catalyst with 7.9 wt % In.
Chem. Ing. Tech. 2022,94, No. 11, 1765–1775 ª2022 The Authors. Chemie Ingenieur Technik published by Wiley-VCH GmbH www.cit-journal.com
Research Article 1769
Chemie
Ingenieur
Technik
15222640, 2022, 11, Downloaded from https://onlinelibrary.wiley.com/doi/10.1002/cite.202200085 by Technische Universitaet Berlin, Wiley Online Library on [09/11/2022]. See the Terms and Conditions (https://onlinelibrary.wiley.com/terms-and-conditions) on Wiley Online Library for rules of use; OA articles are governed by the applicable Creative Commons License
Loading more pages...